Chapter 2. Progress towards the EFA goals - Unesco
Chapter 2. Progress towards the EFA goals - Unesco
Chapter 2. Progress towards the EFA goals - Unesco

You also want an ePaper? Increase the reach of your titles
YUMPU automatically turns print PDFs into web optimized ePapers that Google loves.
1<br />
0<br />
0<br />
CHAPTER 2<br />
2<br />
Education for All Global Monitoring Report<br />
In Chile,<br />
a programme<br />
aimed<br />
at achieving<br />
early childhood<br />
care for<br />
all 4-year-olds<br />
has targeted<br />
<strong>the</strong> poorest<br />
households<br />
Bolivia<br />
Nicaragua<br />
Haiti<br />
Côte d’Ivoire<br />
Madagascar<br />
Kenya<br />
Botswana<br />
Viet Nam<br />
Lesotho<br />
Philippines<br />
Zambia<br />
Niger<br />
Togo<br />
Rwanda<br />
Mongolia<br />
Uganda<br />
Egypt<br />
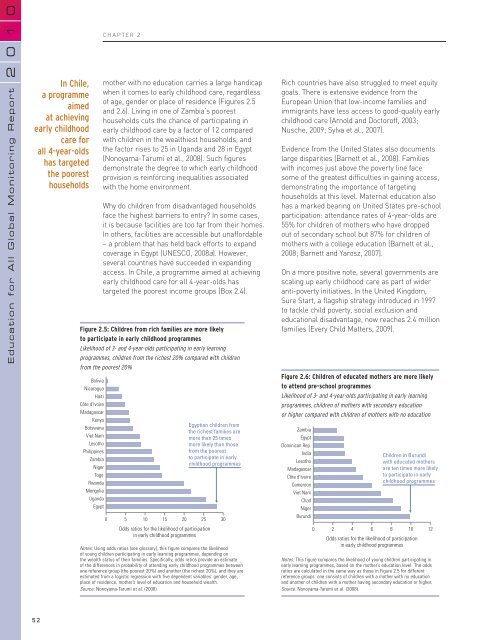
mo<strong>the</strong>r with no education carries a large handicap<br />
when it comes to early childhood care, regardless<br />
of age, gender or place of residence (Figures <strong>2.</strong>5<br />
and <strong>2.</strong>6). Living in one of Zambia’s poorest<br />
households cuts <strong>the</strong> chance of participating in<br />
early childhood care by a factor of 12 compared<br />
with children in <strong>the</strong> wealthiest households, and<br />
<strong>the</strong> factor rises to 25 in Uganda and 28 in Egypt<br />
(Nonoyama-Tarumi et al., 2008). Such figures<br />
demonstrate <strong>the</strong> degree to which early childhood<br />
provision is reinforcing inequalities associated<br />
with <strong>the</strong> home environment.<br />
Why do children from disadvantaged households<br />
face <strong>the</strong> highest barriers to entry? In some cases,<br />
it is because facilities are too far from <strong>the</strong>ir homes.<br />
In o<strong>the</strong>rs, facilities are accessible but unaffordable<br />
– a problem that has held back efforts to expand<br />
coverage in Egypt (UNESCO, 2008a). However,<br />
several countries have succeeded in expanding<br />
access. In Chile, a programme aimed at achieving<br />
early childhood care for all 4-year-olds has<br />
targeted <strong>the</strong> poorest income groups (Box <strong>2.</strong>4).<br />
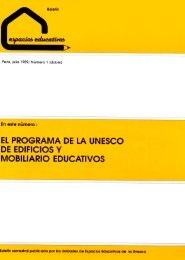
Figure <strong>2.</strong>5: Children from rich families are more likely<br />
to participate in early childhood programmes<br />
Likelihood of 3- and 4-year-olds participating in early learning<br />
programmes, children from <strong>the</strong> richest 20% compared with children<br />
from <strong>the</strong> poorest 20%<br />
Egyptian children from<br />
<strong>the</strong> richest families are<br />
more than 25 times<br />
more likely than those<br />
from <strong>the</strong> poorest<br />
to participate in early<br />
childhood programmes<br />
0 5 10 15 20 25 30<br />
Odds ratios for <strong>the</strong> likelihood of participation<br />
in early childhood programmes<br />
Notes: Using odds ratios (see glossary), this figure compares <strong>the</strong> likelihood<br />
of young children participating in early learning programmes, depending on<br />
<strong>the</strong> wealth status of <strong>the</strong>ir families. Specifically, odds ratios provide an estimate<br />
of <strong>the</strong> differences in probability of attending early childhood programmes between<br />
one reference group (<strong>the</strong> poorest 20%) and ano<strong>the</strong>r (<strong>the</strong> richest 20%), and <strong>the</strong>y are<br />
estimated from a logistic regression with five dependent variables: gender, age,<br />
place of residence, mo<strong>the</strong>r’s level of education and household wealth.<br />
Source: Nonoyama-Tarumi et al. (2008).<br />
Rich countries have also struggled to meet equity<br />
<strong>goals</strong>. There is extensive evidence from <strong>the</strong><br />
European Union that low-income families and<br />
immigrants have less access to good-quality early<br />
childhood care (Arnold and Doctoroff, 2003;<br />
Nusche, 2009; Sylva et al., 2007).<br />
Evidence from <strong>the</strong> United States also documents<br />
large disparities (Barnett et al., 2008). Families<br />
with incomes just above <strong>the</strong> poverty line face<br />
some of <strong>the</strong> greatest difficulties in gaining access,<br />
demonstrating <strong>the</strong> importance of targeting<br />
households at this level. Maternal education also<br />
has a marked bearing on United States pre-school<br />
participation: attendance rates of 4-year-olds are<br />
55% for children of mo<strong>the</strong>rs who have dropped<br />
out of secondary school but 87% for children of<br />
mo<strong>the</strong>rs with a college education (Barnett et al.,<br />
2008; Barnett and Yarosz, 2007).<br />
On a more positive note, several governments are<br />
scaling up early childhood care as part of wider<br />
anti-poverty initiatives. In <strong>the</strong> United Kingdom,<br />
Sure Start, a flagship strategy introduced in 1997<br />
to tackle child poverty, social exclusion and<br />
educational disadvantage, now reaches <strong>2.</strong>4 million<br />
families (Every Child Matters, 2009).<br />
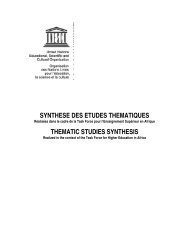
Figure <strong>2.</strong>6: Children of educated mo<strong>the</strong>rs are more likely<br />
to attend pre-school programmes<br />
Likelihood of 3- and 4-year-olds participating in early learning<br />
programmes, children of mo<strong>the</strong>rs with secondary education<br />
or higher compared with children of mo<strong>the</strong>rs with no education<br />
Zambia<br />
Egypt<br />
Dominican Rep.<br />
India<br />
Lesotho<br />
Madagascar<br />
Côte d’Ivoire<br />
Cameroon<br />
Viet Nam<br />
Chad<br />
Niger<br />
Burundi<br />
Children in Burundi<br />
with educated mo<strong>the</strong>rs<br />
are ten times more likely<br />
to participate in early<br />
childhood programmes<br />
0 2 4 6 8 10 12<br />
Odds ratios for <strong>the</strong> likelihood of participation<br />
in early childhood programmes<br />
Notes: This figure compares <strong>the</strong> likelihood of young children participating in<br />
early learning programmes, based on <strong>the</strong> mo<strong>the</strong>r’s education level. The odds<br />
ratios are calculated in <strong>the</strong> same way as those in Figure <strong>2.</strong>5 for different<br />
reference groups: one consists of children with a mo<strong>the</strong>r with no education<br />
and ano<strong>the</strong>r of children with a mo<strong>the</strong>r having secondary education or higher.<br />
Source: Nonoyama-Tarumi et al. (2008).<br />
52