Financing Education / pdf - Unesco
Financing Education / pdf - Unesco
Financing Education / pdf - Unesco

Create successful ePaper yourself
Turn your PDF publications into a flip-book with our unique Google optimized e-Paper software.
PROGRESS IN FINANCING EDUCATION FOR ALL<br />
Contribution of external aid to EFA since Dakar<br />
Swaziland) while some poor countries receive<br />
relatively low amounts (Burundi, Nigeria). These<br />
simple comparisons suggest that the allocation of<br />
aid to basic education is not strongly related to the<br />
share of out-of-school children in the school-age<br />
population or to the level of income per capita.<br />
A recent study of the behaviour of some individual<br />
donors concluded that while IDA and the United<br />
Kingdom tend to allocate their aid to basic<br />
education based on education needs and poverty,<br />
others – including France, Germany, the United<br />
States and the European Commission – are more<br />
likely to be influenced by strategic and political<br />
factors (Caillaud, 2007). Allocations are also likely<br />
to be influenced by considerations of a recipient<br />
country’s absorptive capacity.<br />
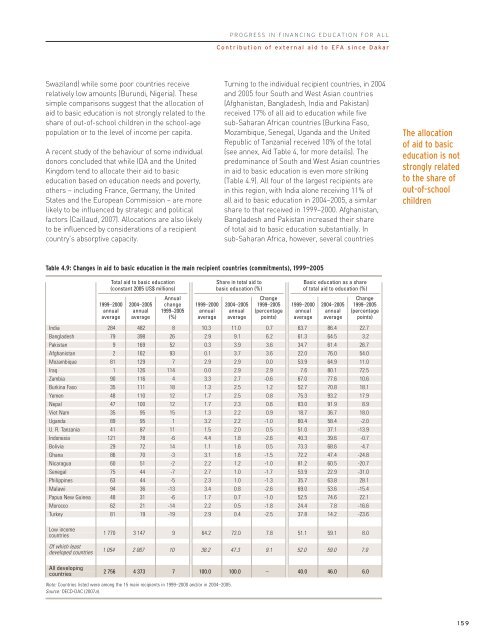
Turning to the individual recipient countries, in 2004<br />
and 2005 four South and West Asian countries<br />
(Afghanistan, Bangladesh, India and Pakistan)<br />
received 17% of all aid to education while five<br />
sub-Saharan African countries (Burkina Faso,<br />
Mozambique, Senegal, Uganda and the United<br />
Republic of Tanzania) received 10% of the total<br />
(see annex, Aid Table 4, for more details). The<br />
predominance of South and West Asian countries<br />
in aid to basic education is even more striking<br />
(Table 4.9). All four of the largest recipients are<br />
in this region, with India alone receiving 11% of<br />
all aid to basic education in 2004–2005, a similar<br />
share to that received in 1999–2000. Afghanistan,<br />
Bangladesh and Pakistan increased their share<br />
of total aid to basic education substantially. In<br />
sub-Saharan Africa, however, several countries<br />
The allocation<br />
of aid to basic<br />
education is not<br />
strongly related<br />
to the share of<br />
out-of-school<br />
children<br />
Table 4.9: Changes in aid to basic education in the main recipient countries (commitments), 1999—2005<br />
India<br />
Bangladesh<br />
Pakistan<br />
Afghanistan<br />
Mozambique<br />
Iraq<br />
Zambia<br />
Burkina Faso<br />
Yemen<br />
Nepal<br />
Viet Nam<br />
Uganda<br />
U. R. Tanzania<br />
Indonesia<br />
Bolivia<br />
Ghana<br />
Nicaragua<br />
Senegal<br />
Philippines<br />
Malawi<br />
Papua New Guinea<br />
Morocco<br />
Turkey<br />
Low income<br />
countries<br />
Of which least<br />
developed countries<br />
All developing<br />
countries<br />
Total aid to basic education<br />
(constant 2005 US$ millions)<br />
1999–2000<br />
annual<br />
average<br />
2004–2005<br />
annual<br />
average<br />
Annual<br />
change<br />
1999–2005<br />
(%)<br />
1999–2000<br />
annual<br />
average<br />
Share in total aid to<br />
basic education (%)<br />
2004–2005<br />
annual<br />
average<br />
Change<br />
1999–2005<br />
(percentage<br />
points)<br />
Basic education as a share<br />
of total aid to education (%)<br />
1999–2000<br />
annual<br />
average<br />
2004–2005<br />
annual<br />
average<br />
Change<br />
1999–2005<br />
(percentage<br />
points)<br />
284 482 8 10.3 11.0 0.7 63.7 86.4 22.7<br />
79 398 26 2.9 9.1 6.2 61.3 64.5 3.2<br />
9 169 52 0.3 3.9 3.6 34.7 61.4 26.7<br />
2 162 93 0.1 3.7 3.6 22.0 76.0 54.0<br />
81 129 7 2.9 2.9 0.0 53.9 64.9 11.0<br />
1 126 114 0.0 2.9 2.9 7.6 80.1 72.5<br />
90 116 4 3.3 2.7 -0.6 67.0 77.6 10.6<br />
35 111 18 1.3 2.5 1.2 52.7 70.8 18.1<br />
48 110 12 1.7 2.5 0.8 75.3 93.2 17.9<br />
47 100 12 1.7 2.3 0.6 83.0 91.9 8.9<br />
35 95 15 1.3 2.2 0.9 18.7 36.7 18.0<br />
89 95 1 3.2 2.2 -1.0 60.4 58.4 -2.0<br />
41 87 11 1.5 2.0 0.5 51.0 37.1 -13.9<br />
121 78 -6 4.4 1.8 -2.6 40.3 39.6 -0.7<br />
29 72 14 1.1 1.6 0.5 73.3 68.6 -4.7<br />
86 70 -3 3.1 1.6 -1.5 72.2 47.4 -24.8<br />
60 51 -2 2.2 1.2 -1.0 81.2 60.5 -20.7<br />
75 44 -7 2.7 1.0 -1.7 53.9 22.9 -31.0<br />
63 44 -5 2.3 1.0 -1.3 35.7 63.8 28.1<br />
94 36 -13 3.4 0.8 -2.6 69.0 53.6 -15.4<br />
48 31 -6 1.7 0.7 -1.0 52.5 74.6 22.1<br />
62 21 -14 2.2 0.5 -1.8 24.4 7.8 -16.6<br />
81 19 -19 2.9 0.4 -2.5 37.8 14.2 -23.6<br />
1 770 3 147 9 64.2 72.0 7.8 51.1 59.1 8.0<br />
1 054 2 067 10 38.2 47.3 9.1 52.0 59.0 7.0<br />
2 756 4 373 7 100.0 100.0 – 40.0 46.0 6.0<br />
Note: Countries listed were among the 15 main recipients in 1999–2000 and/or in 2004–2005.<br />
Source: OECD-DAC (2007a).<br />
159