Financing Education / pdf - Unesco
Financing Education / pdf - Unesco
Financing Education / pdf - Unesco

Create successful ePaper yourself
Turn your PDF publications into a flip-book with our unique Google optimized e-Paper software.
PROGRESS IN FINANCING EDUCATION FOR ALL<br />
Contribution of external aid to EFA since Dakar<br />
Table 4.11: Number of major donors to the education sector in sixty-eight low-income countries, 2003—2005<br />
Number<br />
of donors<br />
Number of<br />
countries<br />
0 1<br />
1 4<br />
2 10<br />
3 10<br />
4 6<br />
5 9<br />
6 5<br />
7 3<br />
8 4<br />
9 3<br />
11 3<br />
12 5<br />
13 3<br />
14 2<br />
Democratic People’s Republic of Korea<br />
Central African Republic, Kiribati, Liberia, Tuvalu<br />
Comoros, Congo, Côte d’Ivoire, Equatorial Guinea, the Gambia, Guinea-Bissau, Sierra Leone, Solomon Islands, Togo, Zimbabwe<br />
Cape Verde, Lesotho, Maldives, Mongolia, Myanmar, Samoa, Sao Tome and Principe, Somalia, Timor-Leste, Uzbekistan<br />
Burundi, Djibouti, Lao People’s Democratic Republic, Papua New Guinea, Republic of Moldova, Vanuatu<br />
Bhutan, Cameroon, Chad, Eritrea, Guinea, Haiti, Kyrgyzstan, Rwanda, Tajikistan<br />
Cambodia, Madagascar, Mauritania, Nigeria, Sudan<br />
Malawi, Uganda, Yemen<br />
Benin, Democratic Republic of the Congo, the Niger, Senegal<br />
Angola, Mali, Nepal<br />
Afghanistan, Ghana, Nicaragua<br />
Burkina Faso, India, Mozambique, Pakistan, Zambia<br />
Kenya, United Republic of Tanzania, Viet Nam<br />
Bangladesh, Ethiopia<br />
The share of aid<br />
through sector<br />
programmes<br />
increased between<br />
1999–2000 and<br />
2004–2005 from<br />
6% to 18%<br />
Source: FTI Secretariat.<br />
of development activities. The desire for overall<br />
sectoral coherence has also had an impact on<br />
the adoption of new approaches.<br />
Declining share of project aid<br />
and increasing programme support<br />
One indicator for monitoring the Paris Declaration<br />
is the share of aid provided to programmes, rather<br />
than to projects. It was determined that by 2010,<br />
66% of aid flows should be in this form. Despite<br />
this precise target, the indicator is difficult to<br />
measure precisely and the information donors<br />
have provided to the OECD-DAC Secretariat is only<br />
approximate, particularly for earlier years.<br />
However, the reported change in the composition<br />
of aid to education in general, and to basic<br />
education in particular, between 1999 and 2005 is<br />
so substantial as to make quite clear that changes<br />
have indeed occurred (Figures 4.16 and 4.17).<br />
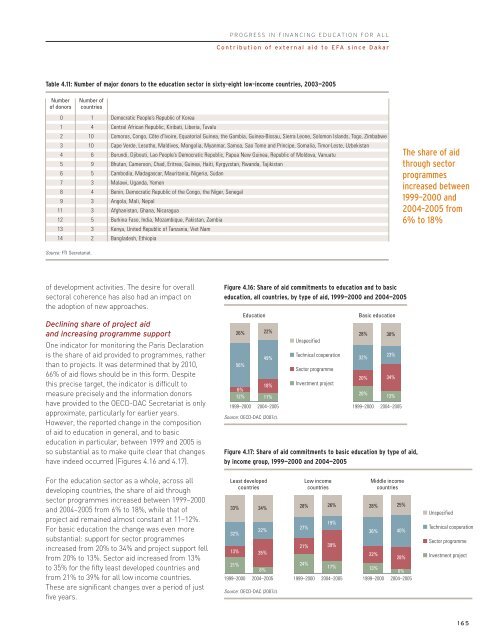
Figure 4.16: Share of aid commitments to education and to basic<br />
education, all countries, by type of aid, 1999—2000 and 2004—2005<br />
26%<br />
56%<br />
6%<br />
12%<br />
<strong>Education</strong><br />
22%<br />
49%<br />
18%<br />
11%<br />
1999–2000 2004–2005<br />
Source: OECD-DAC (2007c).<br />
Unspecified<br />
Technical cooperation<br />
Sector programme<br />
Investment project<br />
Basic education<br />
28%<br />
32%<br />
20%<br />
20%<br />
30%<br />
23%<br />
34%<br />
13%<br />
1999–2000 2004–2005<br />
Figure 4.17: Share of aid commitments to basic education by type of aid,<br />
by income group, 1999—2000 and 2004—2005<br />
For the education sector as a whole, across all<br />
developing countries, the share of aid through<br />
sector programmes increased between 1999–2000<br />
and 2004–2005 from 6% to 18%, while that of<br />
project aid remained almost constant at 11–12%.<br />
For basic education the change was even more<br />
substantial: support for sector programmes<br />
increased from 20% to 34% and project support fell<br />
from 20% to 13%. Sector aid increased from 13%<br />
to 35% for the fifty least developed countries and<br />
from 21% to 39% for all low income countries.<br />
These are significant changes over a period of just<br />
five years.<br />
Least developed<br />
countries<br />
33%<br />
32%<br />
13%<br />
21%<br />
34%<br />
22%<br />
35%<br />
8%<br />
1999–2000 2004–2005<br />
Source: OECD-DAC (2007c).<br />
28%<br />
27%<br />
21%<br />
24%<br />
Low income<br />
countries<br />
26%<br />
19%<br />
39%<br />
17%<br />
1999–2000 2004–2005<br />
Middle income<br />
countries<br />
28%<br />
36%<br />
22%<br />
25%<br />
40%<br />
28%<br />
13%<br />
6%<br />
1999–2000 2004–2005<br />
Unspecified<br />
Technical cooperation<br />
Sector programme<br />
Investment project<br />
165