Naylor Road Metro Station Area Access and Capacity - WMATA.com.
Naylor Road Metro Station Area Access and Capacity - WMATA.com.
Naylor Road Metro Station Area Access and Capacity - WMATA.com.

You also want an ePaper? Increase the reach of your titles
YUMPU automatically turns print PDFs into web optimized ePapers that Google loves.
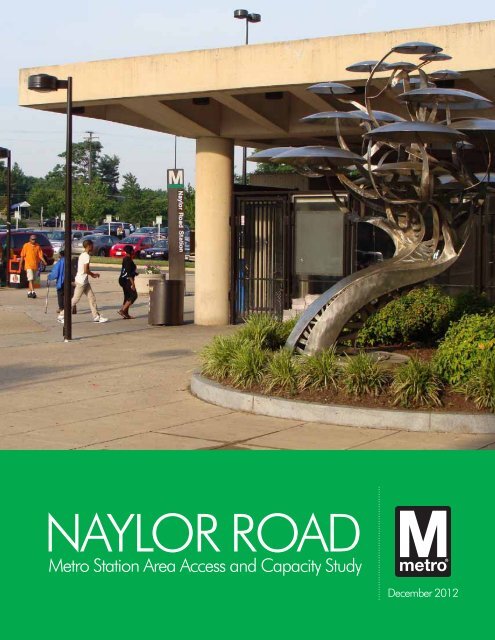
NAYLOR ROAD<br />
<strong>Metro</strong> <strong>Station</strong> <strong>Area</strong> <strong>Access</strong> <strong>and</strong> <strong>Capacity</strong> Study<br />
December 2012
NAYLOR ROAD<br />
<strong>Metro</strong> <strong>Station</strong> <strong>Area</strong> <strong>Access</strong> <strong>and</strong> <strong>Capacity</strong> Study<br />
Washington <strong>Metro</strong>politan <strong>Area</strong> Transit Authority<br />
Department of Planning <strong>and</strong> Joint Development<br />
Office of <strong>Station</strong> <strong>Area</strong> Planning <strong>and</strong> Asset Management<br />
December 2012<br />
Lead Agency<br />
Washington <strong>Metro</strong>politan <strong>Area</strong> Transit Authority<br />
Office of Real Estate <strong>and</strong> <strong>Station</strong> Planning<br />
600 5th Street NW<br />
Washington, DC 20001<br />
Stan Wall, Director of Real Estate <strong>and</strong> <strong>Station</strong> Planning<br />
Robin McElhenny, Manager of <strong>Station</strong> Planning<br />
Catherine Jones, Project Manager<br />
Consultant<br />
Parsons Brinckerhoff<br />
1401 K Street NW, Suite 701<br />
Washington, DC 20005<br />
Brian Laverty, AICP, Project Manager<br />
Crystal Saunders<br />
Nick Schmidt
Contents<br />
Executive Summary <br />
Project Purpose <br />
Context <br />
Existing <strong>Station</strong> <strong>Area</strong> Characteristics <br />
Future <strong>Station</strong> <strong>Area</strong> Characteristics <br />
Future <strong>Station</strong> <strong>Access</strong> Needs <br />
<strong>Station</strong> Re<strong>com</strong>mendations <br />
ES-1<br />
ES-1<br />
ES-1<br />
ES-2<br />
ES-4<br />
ES-5<br />
ES-6<br />
Introduction 1<br />
Project Purpose <strong>and</strong> Scope 1<br />
Context 1<br />
Existing <strong>Station</strong> <strong>Area</strong> Characteristics 5<br />
L<strong>and</strong> Use 8<br />
Zoning 9<br />
<strong>Metro</strong>rail Ridership 11<br />
<strong>Station</strong> <strong>Access</strong> 12<br />
<strong>Station</strong> <strong>Capacity</strong> & Emergency Egress 29<br />
Strengths, Weaknesses, Opportunities, <strong>and</strong> Threats 31<br />
Future <strong>Station</strong> <strong>Area</strong> Characteristics 33<br />
L<strong>and</strong> Use 33<br />
Ridership 37<br />
<strong>Station</strong> <strong>Access</strong> 38<br />
Traffic 39<br />
Future <strong>Station</strong> <strong>Access</strong> Needs 41<br />
Pedestrian 41<br />
Bicycle 44<br />
Bus 44<br />
Shuttles 46<br />
Kiss & Ride 46<br />
Park & Ride 48<br />
i | Contents
<strong>Station</strong> <strong>Capacity</strong> & Emergency Egress 48<br />
Summary 49<br />
<strong>Station</strong> Re<strong>com</strong>mendations 51<br />
Existing <strong>Station</strong> <strong>Area</strong> Re<strong>com</strong>mendations 52<br />
TOD-Based Re<strong>com</strong>mendations 59<br />
Appendices 77<br />
Appendix 1: References 77<br />
Appendix 2: Nationwide Examples of Multimodal Bus <strong>Station</strong>s 78<br />
Appendix 3: 2040 Ridership <strong>and</strong> Mode Share 80<br />
Appendix 4: Bus Bay Requirements 81<br />
Appendix 5: <strong>Station</strong> <strong>Capacity</strong> 83<br />
Appendix 6: 2040 Shuttle Dem<strong>and</strong> 84<br />
Appendix 7: 2040 Kiss & Ride Dem<strong>and</strong> 85<br />
Appendix 8: Emergency Egress 86<br />
Appendix 9: Crash Rate Comparison 93<br />
<strong>Naylor</strong> <strong>Road</strong> <strong>Metro</strong> <strong>Station</strong> <strong>Area</strong> <strong>Access</strong> <strong>and</strong> <strong>Capacity</strong> Study | ii
Figures<br />
Figure ES-1: <strong>Naylor</strong> <strong>Road</strong> <strong>Station</strong> Facilities <br />
Figure ES-2: Estimated Growth in Passenger Entries at <strong>Naylor</strong> <strong>Road</strong> <strong>Station</strong> <br />
Figure ES-3: Potential <strong>Station</strong> <strong>Access</strong> Facility Locations <br />
ES-2<br />
ES-4<br />
ES-8<br />
Figure 1: Existing <strong>Naylor</strong> <strong>Road</strong> <strong>Station</strong> <strong>Area</strong> Characteristics 5<br />
Figure 2: <strong>Naylor</strong> <strong>Road</strong> <strong>Station</strong> Location 6<br />
Figure 3: <strong>Naylor</strong> <strong>Road</strong> <strong>Station</strong> Facilities 7<br />
Figure 4: L<strong>and</strong> Use near <strong>Naylor</strong> <strong>Road</strong> <strong>Station</strong> 8<br />
Figure 5: Commercial Properties along Branch Avenue 9<br />
Figure 6: Zoning near <strong>Naylor</strong> <strong>Road</strong> <strong>Station</strong> 10<br />
Figure 7: Vision for <strong>Naylor</strong> <strong>Road</strong> <strong>Station</strong> <strong>Area</strong> <strong>and</strong> Branch Avenue 10<br />
Figure 8: <strong>Naylor</strong> <strong>Road</strong> <strong>Station</strong> <strong>Metro</strong>rail Ridership Pattern 11<br />
Figure 9: Sidewalk Availability near <strong>Naylor</strong> <strong>Road</strong> <strong>Station</strong> 13<br />
Figure 10: Curb Cuts on Branch Avenue 14<br />
Figure 11: <strong>Naylor</strong> <strong>Road</strong> Sidewalk 14<br />
Figure 12: Missing Sidewalk along <strong>Naylor</strong> <strong>Road</strong> 14<br />
Figure 13: Pedestrian Desire Lines, Pedestrian Barriers, Informal Paths 15<br />
Figure 14: Worn Pathway at Branch Avenue <strong>Station</strong> Entrance 16<br />
Figure 15: Worn Pathways at Oxon Run Drive Park & Ride Entrance 16<br />
Figure 16: Reinforced Fence at Northwest Corner of Park & Ride 16<br />
Figure 17: Observed Pedestrian Crossing Issues 17<br />
Figure 18: Pedestrian Amenities at <strong>Naylor</strong> <strong>Road</strong> <strong>and</strong> Branch Avenue Intersection 18<br />
Figure 19: <strong>Station</strong> <strong>Access</strong> at the Good Hope Avenue Roundabout 18<br />
Figure 20: Pedestrian Crossing Branch Avenue Midblock 18<br />
Figure 21: Existing Wayfinding Signage near <strong>Naylor</strong> <strong>Road</strong> <strong>Station</strong> 19<br />
Figure 22: <strong>Naylor</strong> <strong>Road</strong> <strong>Station</strong> Bicycle Racks <strong>and</strong> Lockers 20<br />
Figure 23: <strong>Naylor</strong> <strong>Road</strong> <strong>Station</strong> Bicycle Parking 20<br />
Figure 24: <strong>Naylor</strong> <strong>Road</strong> <strong>Station</strong> Bus Bay Assignments 21<br />
Figure 25: <strong>Naylor</strong> <strong>Road</strong> <strong>Station</strong> Bus Bays 22<br />
Figure 26: Shared Bus Bay <strong>and</strong> Kiss & Ride Entrance at Branch Avenue 23<br />
Figure 27: Bus Stops near <strong>Naylor</strong> <strong>Road</strong> <strong>Station</strong> 24<br />
Figure 28: Amenities Vary at Branch Avenue Bus Stops: SB at Curtis Drive (left) <strong>and</strong> NB at<br />
Southern Avenue (right) 24<br />
Figure 29: <strong>Naylor</strong> <strong>Road</strong> (left), Suitl<strong>and</strong> Parkway (right), <strong>and</strong> Branch Avenue (bottom) 26<br />
Figure 30: Average Annual Daily Traffic near <strong>Naylor</strong> <strong>Road</strong> <strong>Station</strong> 26<br />
Figure 31: Kiss & Ride Operations 28<br />
iii | Contents
Figure 32: Surplus Kiss & Ride Parking <strong>Capacity</strong> during the Afternoon Peak Period 28<br />
Figure 33: Kiss & Ride Queuing at the Bus Loop Crosswalk 28<br />
Figure 34: Southern Green Line Park & Ride Catchment <strong>Area</strong> (10/2011) 29<br />
Figure 35: <strong>Naylor</strong> <strong>Road</strong> <strong>Station</strong> Elements 30<br />
Figure 36: Vision for <strong>Naylor</strong> <strong>Road</strong> <strong>Station</strong> <strong>Area</strong> <strong>and</strong> Branch Avenue 33<br />
Figure 37: Core <strong>and</strong> Edge <strong>Area</strong>s Surrounding <strong>Naylor</strong> <strong>Road</strong> <strong>Station</strong> 34<br />
Figure 38: Property Required for Joint Development 36<br />
Figure 39: Estimated Growth in Passenger Entries at <strong>Naylor</strong> <strong>Road</strong> <strong>Station</strong> 37<br />
Figure 40: Current Concept for Branch Avenue (left) <strong>and</strong> <strong>Naylor</strong> <strong>Road</strong> (right) 39<br />
Figure 41: Pedestrian <strong>Access</strong> Issues 42<br />
Figure 42: Narrow Sidewalks on Branch Avenue between Suitl<strong>and</strong> Parkway <strong>and</strong> <strong>Naylor</strong> <strong>Road</strong> 42<br />
Figure 43: Sidewalk Issues 43<br />
Figure 44: Example Bicycle Wayfinding Sign 44<br />
Figure 45: Combined Bus Bay <strong>and</strong> Kiss & Ride <strong>Access</strong> Point 45<br />
Figure 46: Kiss & Ride Congestion <strong>and</strong> Conflict <strong>Area</strong>s 47<br />
Figure 47: Pedestrian <strong>and</strong> Bicycle Re<strong>com</strong>mendations 53<br />
Figure 48: Proposed Branch Avenue (top) <strong>and</strong> <strong>Naylor</strong> <strong>Road</strong> (bottom) Typical Sections 54<br />
Figure 49: Rapid Flash Beacon (left) <strong>and</strong> Existing <strong>Naylor</strong> <strong>Road</strong> Roundabout Signs 56<br />
Figure 50: Strategies to Reduce Queuing Conflicts in the Kiss & Ride 58<br />
Figure 51: <strong>Metro</strong>’s <strong>Station</strong> <strong>Access</strong> Hierarchy 60<br />
Figure 52: College Park-U of MD <strong>Station</strong> Bike & Ride 61<br />
Figure 53: El Monte <strong>Station</strong> (El Monte, California 61<br />
Figure 54: Examples of Retail in Parking Garages: Athens, GA <strong>and</strong> Reston Town Center, VA 62<br />
Figure 55: Wheaton <strong>Station</strong> Kiss & Ride Incorporated into Mixed-Use Building 62<br />
Figure 56: Potential Shared-Use Satellite Parking Lots 65<br />
Figure 57: Daily Distribution of Trips (Systemwide) 71<br />
Figure 58: Allowable Walking Distances between <strong>Station</strong> Facilities <strong>and</strong> Entrance 73<br />
Figure 59: Constraints for Potential <strong>Station</strong> <strong>Access</strong> Facility Locations 74<br />
Figure 60: Potential <strong>Station</strong> <strong>Access</strong> Facility Locations 75<br />
Figure A-1: Alewife <strong>Station</strong> (Cambridge, MA) 78<br />
Figure A-2: Cumberl<strong>and</strong> Statioon (Chicago, IL) 78<br />
Figure A-3: South Hills Village <strong>Station</strong> (Upper St. Clair, PA) 79<br />
Figure A-4: North Springs <strong>Station</strong> (S<strong>and</strong>y Springs, GA) 79<br />
<strong>Naylor</strong> <strong>Road</strong> <strong>Metro</strong> <strong>Station</strong> <strong>Area</strong> <strong>Access</strong> <strong>and</strong> <strong>Capacity</strong> Study | iv
Tables<br />
Table ES-1: <strong>Access</strong> <strong>and</strong> Egress at <strong>Naylor</strong> <strong>Road</strong> <strong>Station</strong> ES-3<br />
Table ES-2: 2040 Estimated Weekday Mode Share for <strong>Naylor</strong> <strong>Road</strong> <strong>Station</strong> ES-5<br />
Table ES-3: <strong>Station</strong> <strong>Capacity</strong> Analysis Results ES-5<br />
Table ES-4: Future Emergency Egress ES-5<br />
Table ES-5: Summary of Existing <strong>Station</strong> <strong>Area</strong> Re<strong>com</strong>mendations ES-6<br />
Table ES-6: Summary of Options <br />
ES-7<br />
Table ES-7: Opportunities <strong>and</strong> Constraints of Potential <strong>Station</strong>-<strong>Access</strong> Facility Locations ES-9<br />
Table 1: Previous Planning Studies for <strong>Naylor</strong> <strong>Road</strong> <strong>Station</strong> 1<br />
Table 2: Average Weekday <strong>Metro</strong>rail Ridership (May 2012) 11<br />
Table 3: <strong>Metro</strong>rail Frequency at <strong>Naylor</strong> <strong>Road</strong> <strong>Station</strong> 11<br />
Table 4: <strong>Access</strong> <strong>and</strong> Egress at <strong>Naylor</strong> <strong>Road</strong> <strong>Station</strong> 12<br />
Table 5: Bus Bay Assignments 22<br />
Table 6: Bus Bay Utilization during the Daily Peak Hour 23<br />
Table 7: Typical Weekday <strong>Station</strong> Activity 23<br />
Table 8: <strong>Naylor</strong> <strong>Road</strong> <strong>Station</strong> <strong>Area</strong> <strong>Road</strong>way Characteristics 25<br />
Table 9: Crash Data 27<br />
Table 10: Southern Green Line Park & Ride SmarTrip Data (10/2011) 29<br />
Table 11: <strong>Naylor</strong> <strong>Road</strong> <strong>Station</strong> Elements 29<br />
Table 12: Existing Passenger Circulation Facilities 30<br />
Table 13: 2012 Emergency Egress 30<br />
Table 14: Results of the <strong>Naylor</strong> <strong>Road</strong> <strong>Station</strong> SWOT Analysis 31<br />
Table 15: Core <strong>and</strong> Edge <strong>Area</strong> L<strong>and</strong> Use Distribution 35<br />
Table 16: 2010 to 2040 Population <strong>and</strong> Employment Growth 37<br />
Table 17: 2040 Estimated Weekday Mode Share for <strong>Naylor</strong> <strong>Road</strong> <strong>Station</strong> 38<br />
Table 18: Estimated Bicycle Parking Needed by 2040 44<br />
Table 19: Estimated Bus Bay Needs in 2012 & 2040 45<br />
Table 20: Unconstrained Parking Dem<strong>and</strong> at <strong>Naylor</strong> <strong>Road</strong> <strong>Station</strong> 48<br />
Table 21: <strong>Station</strong> <strong>Capacity</strong> Analysis Results 49<br />
Table 22: Future Emergency Egress 49<br />
Table 23: Summary of <strong>Naylor</strong> <strong>Road</strong> <strong>Station</strong> <strong>Access</strong> Needs 50<br />
Table 24: Summary of Existing <strong>Station</strong> <strong>Area</strong> Re<strong>com</strong>mendations 51<br />
Table 25: Pedestrian <strong>and</strong> Bicycle Re<strong>com</strong>mendations 55<br />
Table 27: Kiss & Ride Re<strong>com</strong>mendations 57<br />
Table 26: Bus Re<strong>com</strong>mendations 57<br />
Table 28: Peak Parking Periods by L<strong>and</strong> Use 63<br />
v | Contents
Table 29: Potential Shared-Use Satellite Parking Lots 67<br />
Table 30: Summary of Options 70<br />
Table 31: Opportunities <strong>and</strong> Constraints of Potential <strong>Station</strong>-<strong>Access</strong> Facility Locations 75<br />
Table A-1: Weekday <strong>Naylor</strong> <strong>Road</strong> <strong>Station</strong> Mode Share from the 2007 <strong>Metro</strong>rail<br />
Passenger Survey (all day) 80<br />
Table A-2: Estimated 2012 Weekday Mode Share of <strong>Naylor</strong> <strong>Road</strong> <strong>Station</strong> (all day) 80<br />
Table A-3: Model Results 80<br />
Table A-4: Existing Bus Bays Required 81<br />
Table A-5: Existing Bus Bay Utilization 81<br />
Table A-6: Average Peak Hour Bus Passenger Loads at <strong>Naylor</strong> <strong>Road</strong> <strong>Station</strong> (Year 2040) 82<br />
Table A-7: Bus Bays Required (Year 2040) 82<br />
Table A-8: Bus Bay Utilization (Year 2040) 82<br />
Table A-9: <strong>Capacity</strong> Analysis Inputs 83<br />
Table A-10: Summary of 2012 <strong>Capacity</strong> Analysis 83<br />
Table A-11: Summary of 2040 <strong>Capacity</strong> Analysis 83<br />
Table A-12: <strong>Station</strong> <strong>Capacity</strong> Analysis Results 83<br />
Table A-13: Household <strong>and</strong> Employment Density 84<br />
Table A-14: 2040 Kiss & Ride Parking Needs 85<br />
Table A-15: NFPA 130 Analysis Input Data 87<br />
Table A-16: NFPA 130 Preliminary Analysis 88<br />
Table A-17: NFPA 130 Complete Analysis Inputs (2012 Morning Peak) 89<br />
Table A-18: NFPA 130 Complete Analysis (2012 Morning Peak) 89<br />
Table A-19: NFPA 130 Complete Analysis Inputs (2040 Morning Peak) 90<br />
Table A-20: NFPA 130 Complete Analysis (2040 Morning Peak) 90<br />
Table A-21: NFPA 130 Complete Analysis Inputs (2012 Afternoon Peak) 91<br />
Table A-22: NFPA 130 Complete Analysis (2012 Afternoon Peak) 91<br />
Table A-23: NFPA 130 Complete Analysis Inputs (2040 Afternoon Peak) 92<br />
Table A-24: NFPA 130 Complete Analysis (2040 Afternoon Peak) 92<br />
Table A-25: Branch Avenue Crash Rate (2008) 93<br />
Table A-26: <strong>Naylor</strong> <strong>Road</strong> Crash Rate (2008) 93<br />
<strong>Naylor</strong> <strong>Road</strong> <strong>Metro</strong> <strong>Station</strong> <strong>Area</strong> <strong>Access</strong> <strong>and</strong> <strong>Capacity</strong> Study | vi
Executive Summary<br />
Project Purpose<br />
The Washington <strong>Metro</strong>politan <strong>Area</strong> Transit Authority (<strong>Metro</strong>) initiated the <strong>Naylor</strong> <strong>Road</strong> <strong>Metro</strong><br />
<strong>Station</strong> <strong>Area</strong> <strong>Access</strong> <strong>and</strong> <strong>Capacity</strong> Study to evaluate existing <strong>and</strong> future station access <strong>and</strong> capacity<br />
needs within 1/4-mile of <strong>Naylor</strong> <strong>Road</strong> <strong>Station</strong>, particularly with respect to transit-oriented joint<br />
development (TOD) within the station area.<br />
This report presents an evaluation of existing conditions <strong>and</strong> future station access <strong>and</strong> capacity<br />
needs of all modes at the <strong>Naylor</strong> <strong>Road</strong> <strong>Station</strong> <strong>and</strong> the adjacent area. In support of the planned<br />
transition of the <strong>Naylor</strong> <strong>Road</strong> <strong>Station</strong> area into a regional TOD center, this study determined<br />
the future (2040) needs for access facilities by mode <strong>and</strong> identified improvements to meet those<br />
needs. Finally, this report includes a review of relevant prior studies that have identified issues<br />
in the <strong>Naylor</strong> <strong>Road</strong> area. The findings of these previous studies are incorporated into this<br />
planning effort.<br />
Context<br />
Over the past decade, Prince George’s County, the Maryl<strong>and</strong>-National Capital Park <strong>and</strong><br />
Planning Commission (M-NCPPC), <strong>and</strong> the State of Maryl<strong>and</strong> have recognized <strong>Naylor</strong> <strong>Road</strong><br />
<strong>Station</strong> as a catalyst for development in the Branch Avenue corridor.<br />
Recognition began in the 2002 Prince George’s County Approved General Plan (General Plan), which<br />
designated the <strong>Naylor</strong> <strong>Road</strong> <strong>Station</strong> as a Community Center within the County’s Developed Tier<br />
to encourage mixed-use development. The General Plan vision for Prince George’s County’s<br />
Developed Tier is a network of sustainable mixed-use medium-to high density <strong>com</strong>munities that<br />
support transit <strong>and</strong> are oriented toward pedestrians.<br />
M-NCPPC’s 2008 Approved Preliminary Branch Avenue Corridor Sector Plan <strong>and</strong> Proposed Sectional<br />
Map Amendment (Branch Avenue Corridor Sector Plan) established policies <strong>and</strong> zoning to<br />
encourage mixed-use TOD within a half-mile radius of the <strong>Metro</strong>rail station, <strong>and</strong> designated<br />
<strong>Naylor</strong> <strong>Road</strong> <strong>Station</strong> a Regional Center—a location with high transit access for regionally<br />
marketed destinations.<br />
In 2010, the State of Maryl<strong>and</strong> formally designated the <strong>Naylor</strong> <strong>Road</strong> <strong>Station</strong> a TOD site,<br />
increasing the State’s ability to use resources to develop <strong>and</strong> construct TOD-supportive<br />
transportation projects at the station.<br />
ES-1 | Executive Summary
Existing <strong>Station</strong> <strong>Area</strong> Characteristics<br />
The elevated station platform, south of <strong>and</strong> parallel to Suitl<strong>and</strong> Parkway, is arranged in a center<br />
configuration with one access point connecting to a single mezzanine at ground level. All station<br />
area facilities are contained within three <strong>Metro</strong>-owned parcels totaling 7.6 acres. <strong>Station</strong> area<br />
facilities lie south of the platform <strong>and</strong> tracks <strong>and</strong> are bounded by <strong>Naylor</strong> <strong>Road</strong> (MD 637) to the<br />
west <strong>and</strong> south <strong>and</strong> Branch Avenue (MD 5) to the east. <strong>Naylor</strong> <strong>Road</strong> <strong>Station</strong>’s eight bus bays,<br />
which wrap around its Kiss & Ride lot, serve 11 <strong>Metro</strong>bus <strong>and</strong> TheBus routes. Vehicle access is<br />
Figure ES-1: <strong>Naylor</strong> <strong>Road</strong> <strong>Station</strong> Facilities<br />
<strong>Metro</strong> Property<br />
Study <strong>Area</strong><br />
<strong>Station</strong> Entrance<br />
N<br />
0 250’<br />
Branch Ave<br />
Suitl<strong>and</strong> Pkwy<br />
<strong>Station</strong> Platform<br />
1/4 mile<br />
Park & Ride<br />
Bus Bays<br />
Bus Layover<br />
Oxon Run Dr<br />
Good Hope Ave<br />
Kiss & Ride<br />
<strong>Naylor</strong> Rd<br />
Source: Google Earth (aerial)<br />
<strong>Naylor</strong> <strong>Road</strong> <strong>Metro</strong> <strong>Station</strong> <strong>Area</strong> <strong>Access</strong> <strong>and</strong> <strong>Capacity</strong> Study | ES-2
shared between these two facilities with<br />
entry/exit points at both <strong>Naylor</strong> <strong>Road</strong><br />
<strong>and</strong> Branch Avenue. The Kiss & Ride<br />
lot contains 73 parking spaces, <strong>and</strong> the<br />
368-space Park & Ride surface lot <strong>and</strong> its<br />
entrance roadway <strong>com</strong>prise the western<br />
half of the station area. Cyclists are<br />
ac<strong>com</strong>modated through 10 bicycle racks<br />
<strong>and</strong> four bicycle lockers.<br />
Table ES-1: <strong>Access</strong> <strong>and</strong> Egress at <strong>Naylor</strong> <strong>Road</strong> <strong>Station</strong><br />
2007 Mode Shares<br />
2007 Mode<br />
Shares*<br />
Applied to 2012<br />
Passenger Totals<br />
Mode<br />
<strong>Access</strong> Egress <strong>Access</strong> Egress<br />
Walk 24% 12% 760 377<br />
Bicycle 0% 0% 0 0<br />
Bus 37% 54% 1,170 1,695<br />
Kiss & Ride 16% 7% 505 220<br />
Park & Ride (drivers <strong>and</strong> passengers) 22% 23% 695 721<br />
Other (taxi, in<strong>com</strong>plete surveys) 1% 4% 30 125<br />
Total 100% 100% 3,160 3,138<br />
Source: 2007 <strong>Metro</strong>rail Passenger Survey, <strong>Metro</strong> faregate data<br />
* This mode share included satellite parking at the Legend Nightclub across <strong>Naylor</strong> <strong>Road</strong><br />
<strong>Naylor</strong> <strong>Road</strong> <strong>Station</strong> averaged 3,160<br />
entries <strong>and</strong> 3,138 exits per weekday<br />
during May 2012, a seven percent decline<br />
from the station’s highest recorded ridership in 2006. Morning <strong>and</strong> afternoon peaking is very<br />
pronounced, with most people entering the station in the morning <strong>and</strong> exiting in the afternoon—<br />
<strong>Naylor</strong> <strong>Road</strong> <strong>Station</strong> is heavily used by <strong>com</strong>muters traveling into the District. During the general<br />
<strong>Metro</strong>rail systemwide morning peak period (5:00 to 9:30 AM), approximately eight passengers<br />
enter the station per every exiting passenger. Conversely, almost four passengers exit the station<br />
per every entering passenger during the afternoon systemwide peak period (3:00 to 7:00 PM).<br />
Safe <strong>and</strong> efficient pedestrian access to <strong>Naylor</strong> <strong>Road</strong> <strong>Station</strong> is vital, as almost one in four<br />
<strong>Metro</strong>rail passengers access the station by foot. While the surrounding station area is fairly well<br />
connected by sidewalks of varying width <strong>and</strong> quality, many pedestrian facilities—sidewalks,<br />
crosswalks, signals, signage, etc.—in the station area need improvement <strong>and</strong> could potentially<br />
impact pedestrian safety. Nearby roadways, particularly Branch Avenue, serving as major<br />
pedestrian links are perceived as dangerous <strong>and</strong> uninviting for pedestrians, especially when<br />
crossing the street. Speeding motorists, missing or narrow sidewalks, missing crosswalks, curb<br />
cuts, long signal cycles, sidewalk obstructions, <strong>and</strong> unpaved pathways were observed along key<br />
pedestrian routes.<br />
Current dem<strong>and</strong> for bicycle parking at <strong>Naylor</strong> <strong>Road</strong> <strong>Station</strong> is low. Very few passengers bike<br />
to <strong>Naylor</strong> <strong>Road</strong> <strong>Station</strong> as a result of limited cycling facilities in the area as well as the station’s<br />
location amidst regional <strong>com</strong>muter roadways with heavy traffic. As with pedestrians, Branch<br />
Avenue is perceived as a dangerous place for cyclists as well. No bike lanes, multi-use trails,<br />
or designated shared-use roadways are available to <strong>Naylor</strong> <strong>Road</strong> <strong>Station</strong>. However, residential<br />
roadways south of the station provide a safe alternative due to low traffic volumes <strong>and</strong> direct<br />
access via Good Hope Avenue. Ten bicycle racks <strong>and</strong> four bicycle lockers are located near the<br />
station entrance. All racks are located west of the station entrance while the lockers are found<br />
south of the entrance.<br />
<strong>Naylor</strong> <strong>Road</strong> <strong>Station</strong> is served by <strong>Metro</strong>bus <strong>and</strong> Prince George’s County’s TheBus. Eleven<br />
routes directly serve seven saw-tooth bus bays; an additional unassigned serves as a passenger<br />
drop-off location for all routes. With the exception of the two bays closest to Branch Avenue,<br />
all bays are located within a counterclockwise bus loop that permits recirculation. Buses access<br />
the bus loop from Branch Avenue or <strong>Naylor</strong> <strong>Road</strong>, depending on the route. Bus drivers often<br />
experience delay when exiting via the <strong>Naylor</strong> <strong>Road</strong> roundabout as a result of heavy through<br />
ES-3 | Executive Summary
traffic. Bus bays are currently underutilized, with four of the seven revenue bays less than 50<br />
percent occupied during the daily peak hour. However, station observations revealed that<br />
the unassigned drop-off bay is frequently occupied, which may block other bus drivers from<br />
advancing to their assigned bay. No private shuttles currently provide service to the station.<br />
<strong>Station</strong> observations showed many of the Kiss & Ride lot’s temporary parking spaces are<br />
unused during the afternoon peak period—the busiest time of the day for <strong>Metro</strong>rail Kiss & Ride<br />
facilities. Many drivers prefer to wait near the curb for passengers, sometimes creating traffic<br />
bottlenecks. This is a <strong>Metro</strong>rail systemwide trend. The Kiss & Ride lot is approximately two<br />
times larger than required by existing dem<strong>and</strong>. However, <strong>Naylor</strong> <strong>Road</strong> <strong>Station</strong>’s Park & Ride is<br />
small <strong>com</strong>pared to other southern Green Line stations—368 daily spaces—<strong>and</strong> routinely reaches<br />
capacity before 8:00 AM. Off-site parking near the station remains limited.<br />
Branch Avenue, <strong>Naylor</strong> <strong>Road</strong>, <strong>and</strong> Suitl<strong>and</strong> Parkway–roadways surrounding <strong>Naylor</strong> <strong>Road</strong><br />
<strong>Station</strong>—are heavily traveled <strong>and</strong> primarily provide access for regional travelers. Crash records<br />
reveal that Branch Avenue’s crash rate was more than twice as high as nearby <strong>Naylor</strong> <strong>Road</strong> in<br />
2008, the most recent year available for <strong>com</strong>parison. Though SHA ranks Prince George’s County<br />
first in Maryl<strong>and</strong> in 2008 traffic fatalities, no roadway fatalities occurred between 2006 <strong>and</strong> 2008<br />
near <strong>Naylor</strong> <strong>Road</strong> <strong>Station</strong>.<br />
Future <strong>Station</strong> <strong>Area</strong> Characteristics<br />
The <strong>Naylor</strong> <strong>Road</strong> <strong>Station</strong> area is on the verge of revitalization <strong>and</strong> redevelopment that will<br />
define a sense of place. This vision is for <strong>com</strong>plete redevelopment of the <strong>Naylor</strong> <strong>Road</strong> <strong>Station</strong><br />
area, as well as a significant portion of properties along <strong>Naylor</strong> <strong>Road</strong> <strong>and</strong> Branch Avenue, by<br />
transforming the area from an automobile-oriented zone to a high-density, pedestrian-friendly<br />
district. This vision is supported by updated design guidelines that address building setbacks,<br />
the streetscape, building height, lighting, <strong>and</strong> other considerations.<br />
Joint development at <strong>Naylor</strong> <strong>Road</strong> <strong>Station</strong> may require the assembly of additional properties<br />
in the area between <strong>Naylor</strong> <strong>Road</strong> <strong>and</strong> Branch Avenue. Approximately, 10.7 acres are available<br />
for development, which includes the station area. To achieve the TOD <strong>com</strong>munity <strong>and</strong> regional<br />
center envisioned, parking should be carefully managed at the redeveloped site; the number of<br />
Figure ES-2: Estimated Growth in Passenger Entries at <strong>Naylor</strong><br />
<strong>Road</strong> <strong>Station</strong><br />
4,500<br />
4,017<br />
4,000<br />
2012<br />
3,500<br />
2040<br />
3,160<br />
3,004<br />
3,000<br />
2,500<br />
2,222<br />
2,000<br />
1,500<br />
1,000<br />
938 1,013<br />
500<br />
0<br />
Daily Peak Off Peak<br />
Source: MWCOG travel dem<strong>and</strong> model<br />
Entries<br />
parking spaces should be limited <strong>and</strong> shared parking<br />
between different l<strong>and</strong> uses encouraged.<br />
The study team used the MWCOG travel dem<strong>and</strong><br />
model, updated for the Purple Line project to meet<br />
Federal Transit Administration (FTA) requirements, to<br />
estimate <strong>Metro</strong>rail ridership <strong>and</strong> mode share at <strong>Naylor</strong><br />
<strong>Road</strong> <strong>Station</strong> in 2040. The model estimates a 35-percent<br />
increase in peak period <strong>Metro</strong>rail entries <strong>and</strong> an eightpercent<br />
increase in off-peak entries between 2012 <strong>and</strong><br />
2040, resulting in a total daily increase of 27 percent<br />
(Figure ES-2). Most of the growth in <strong>Naylor</strong> <strong>Road</strong> <strong>Station</strong><br />
entries is concentrated in the peak period.<br />
<strong>Naylor</strong> <strong>Road</strong> <strong>Metro</strong> <strong>Station</strong> <strong>Area</strong> <strong>Access</strong> <strong>and</strong> <strong>Capacity</strong> Study | ES-4
With the transformation of the <strong>Naylor</strong> <strong>Road</strong><br />
<strong>Station</strong> area from an automobile-oriented<br />
transit center to a regional center of mixed-use<br />
TOD, how people access the station will change<br />
by 2040 (Table ES-2). The model estimates that<br />
walk <strong>and</strong> bike access will grow significantly,<br />
owing to the expected concentration of<br />
mixed-use buildings at the station in the<br />
future. While the model estimates a decline in<br />
automobile access as a percent of daily mode<br />
share, Park & Ride usage will remain high.<br />
This study assumed that bus ridership will<br />
grow similarly to <strong>Naylor</strong> <strong>Road</strong> <strong>Station</strong>’s total entries (35 percent during peak periods <strong>and</strong> eight<br />
percent during off-peak periods) to ensure that adequate bus capacity is considered in future<br />
redevelopment. Finally, this study assumes that planning for up to three shuttle trips per hour<br />
during peak periods in 2040 is a reasonable, conservative assumption given the available data.<br />
Future <strong>Station</strong> <strong>Access</strong> Needs<br />
Realizing <strong>Naylor</strong> <strong>Road</strong> <strong>Station</strong>’s TOD vision will take years, <strong>and</strong> this redevelopment process is<br />
just now beginning through <strong>com</strong>pleted or in-process planning studies tasked with improving<br />
the station area <strong>and</strong> its multimodal access. This report uses information <strong>and</strong> findings from these<br />
studies as well as additional station observations <strong>and</strong> analyses performed specifically for this<br />
study to define station access deficiencies <strong>and</strong> opportunities for improvement—or more simply,<br />
station access “needs.”<br />
In addition, the study evaluated station capacity based on 2012 <strong>and</strong> estimated 2040 ridership<br />
levels. Table ES-3 shows that existing platform-to-mezzanine elevator capacity does not meet<br />
established st<strong>and</strong>ards, but that all other circulation<br />
elements at the existing mezzanine meet the minimum<br />
requirements for 2012 <strong>and</strong> estimated 2040 passenger loads.<br />
Circulation<br />
Element<br />
Existing<br />
This study also analyzed <strong>Naylor</strong> <strong>Road</strong> <strong>Station</strong>’s emergency<br />
egress capacity under existing conditions as well as<br />
estimated conditions in 2040 (Table ES-4). This analysis is<br />
based on the requirements set by the NFPA 130 st<strong>and</strong>ards.<br />
Evacuation time analysis is based on a worst-case-scenario<br />
with peak-direction trains containing twice the typical<br />
number of passengers to simulate a missed headway.<br />
<strong>Metro</strong> uses these guidelines as design goals when<br />
modifying station facilities to increase their emergency<br />
safety capabilities. The analysis results show that <strong>Naylor</strong><br />
<strong>Road</strong> <strong>Station</strong> presently does not meet emergency egress<br />
requirements for the afternoon peak period. However, as a<br />
result of shorter headways by 2040, the station is expected<br />
to meet all emergency egress st<strong>and</strong>ards in the future.<br />
Table ES-2: 2040 Estimated Weekday Mode Share for <strong>Naylor</strong><br />
<strong>Road</strong> <strong>Station</strong><br />
Period<br />
Park &<br />
Ride<br />
Kiss &<br />
Ride Bus<br />
Walk/<br />
Bike Total<br />
Weekday Mode Share Change from 2012 to 2040*<br />
Peak Periods -3% -49% 35% 39% 35%<br />
Off-Peak Periods 167% -75% 8% 294% 8%<br />
All day 12% -56% 30% 92% 27%<br />
Weekday Mode Share<br />
2012 23% 12% 46% 19% 100%<br />
2040 20% 4% 47% 29% 100%<br />
* Rounded to the nearest whole number<br />
Table ES-3: <strong>Station</strong> <strong>Capacity</strong> Analysis Results<br />
Elements Required<br />
2012 2040<br />
Platform Escalators 2 2 2<br />
Platform Elevators* 1 2 2<br />
Faregate Aisles 4 2 2<br />
Farecard Vendors 7 1 1<br />
* While only one platform elevator per mezzanine is required<br />
for ADA <strong>com</strong>pliance, current practice by <strong>Metro</strong> is to provide two<br />
platform elevators per mezzanine.<br />
Table ES-4: Future Emergency Egress<br />
NFPA<br />
Measure (minutes)<br />
Morning Peak<br />
Time to clear platform<br />
St<strong>and</strong>ard<br />
4.0<br />
2012<br />
3.6<br />
2040<br />
2.5<br />
Time to point of safety 6.0 5.1 4.0<br />
Afternoon Peak<br />
Time to clear platform 4.0 5.2 3.4<br />
Time to point of safety 6.0 6.7 4.9<br />
ES-5 | Executive Summary
<strong>Station</strong> Re<strong>com</strong>mendations<br />
<strong>Station</strong> access re<strong>com</strong>mendations were developed in response to station needs <strong>and</strong> are divided<br />
into two general categories:<br />
• Re<strong>com</strong>mendations based on deficiencies observed in the existing station area configuration<br />
that can be addressed either as part of or before TOD implementation, <strong>and</strong><br />
• TOD-based re<strong>com</strong>mendations, or those re<strong>com</strong>mendations tied to <strong>and</strong> made necessary by the<br />
expected redevelopment of the station area.<br />
Existing <strong>Station</strong> <strong>Area</strong> Re<strong>com</strong>mendations<br />
Existing station area re<strong>com</strong>mendations, shown in Table ES-5, were devised in response to<br />
observed deficiencies that result from the present configuration of <strong>Naylor</strong> <strong>Road</strong> <strong>Station</strong>’s<br />
facilities <strong>and</strong> the existing conditions of its surroundings. Existing station area re<strong>com</strong>mendations<br />
can be implemented independently of each other, but some re<strong>com</strong>mendations may be more<br />
effective if implemented in concert.<br />
Table ES-5: Summary of Existing <strong>Station</strong> <strong>Area</strong> Re<strong>com</strong>mendations<br />
Location<br />
Re<strong>com</strong>mendation<br />
<strong>Naylor</strong> Rd<br />
Add pedestrian signals, crosswalks, <strong>and</strong> pedestrian refuge areas at Suitl<strong>and</strong> Pkwy intersection<br />
Add sidewalks on east side between Suitl<strong>and</strong> Pkwy <strong>and</strong> Oxon Run Dr, <strong>and</strong> on both sides north of Suitl<strong>and</strong> Pkwy<br />
Add shared lane markings <strong>and</strong> “Bikes May Use Full Lane” signs north of Suitl<strong>and</strong> Pkwy*<br />
Add proposed bicycle lanes <strong>and</strong> shared lane markings south of Suitl<strong>and</strong> Pkwy<br />
Add proposed sidewalks <strong>and</strong> remove fence along observed pedestrian desire lines<br />
Install rapid flash beacons at roundabout crosswalks <strong>and</strong> crosswalk at the right-turn lane to Branch Ave<br />
Study additional marked crossing between Good Hope Ave <strong>and</strong> Branch Ave*<br />
Branch Ave Add sidewalk on east side between station entrance <strong>and</strong> Southern Ave<br />
Add proposed bicycle lanes from the District line south<br />
Add proposed pedestrian signals <strong>and</strong> crosswalks at all approaches at station entrance intersection<br />
Add pedestrian refuge areas <strong>and</strong> reduce northbound right-turn radius at station entrance intersection<br />
Add proposed new <strong>and</strong> widened sidewalks south of station entrance intersection<br />
Study midblock pedestrian hybrid signal south of station entrance intersection*<br />
Oxon Run Dr Add new <strong>and</strong> widen existing sidewalks<br />
Add shared lane markings <strong>and</strong> “Bikes May Use Full Lane” signs*<br />
Add connection to proposed Oxon Run Trail<br />
Add curb extension, crosswalks, <strong>and</strong> reduce curb radii at Oxon Park St intersection<br />
Good Hope Ave Add sidewalks on west side<br />
Suitl<strong>and</strong> Pkwy Implement proposed Suitl<strong>and</strong> Parkway multi-use path into Maryl<strong>and</strong><br />
Oxon Run Park Implement proposed Oxon Run Trail<br />
<strong>Station</strong> Footprint: Add pathway from Oxon Run Dr through Park & Ride lot to station entrance<br />
Bike & Pedestrian Add at least 10 bicycle parking spaces<br />
Bus Bays<br />
Require bus drivers to leave Bay C after discharging passengers<br />
Require operators of large shuttles to apply for a station access permit**<br />
Kiss & Ride Improve motorist awareness of Kiss & Ride entrance at Branch Avenue<br />
Add striping <strong>and</strong> signage to encourage motorists to queue near Kiss & Ride shelters<br />
Designate space for small shuttles<br />
General<br />
Implement improved wayfinding signage<br />
Add bus stop amenities—benches, shelters, sidewalk connections, <strong>and</strong> ADA accessibility features—where missing<br />
* More detailed study <strong>and</strong> analysis is required to determine overall feasibility<br />
** Requires adherence to <strong>Metro</strong>’s shuttle bus policy, two key factors are sufficient bus bay capacity <strong>and</strong> <strong>com</strong>pliance with insurance requirements.<br />
<strong>Naylor</strong> <strong>Road</strong> <strong>Metro</strong> <strong>Station</strong> <strong>Area</strong> <strong>Access</strong> <strong>and</strong> <strong>Capacity</strong> Study | ES-6
TOD-Based Re<strong>com</strong>mendations<br />
In order for the established TOD vision at <strong>Naylor</strong> <strong>Road</strong> <strong>Station</strong> to be realized, the current station<br />
area footprint—<strong>com</strong>prised of separate bus, Kiss & Ride, <strong>and</strong> Park & Ride facilities—must be<br />
reconfigured to create more developable l<strong>and</strong>. Dem<strong>and</strong> for Park & Ride <strong>and</strong> bus facilities,<br />
however, is estimated to increase in the future. Balancing the vision for a redeveloped station<br />
<strong>and</strong> the need to meet growing access dem<strong>and</strong> will require a variety of strategies—individual<br />
re<strong>com</strong>mendations tied to <strong>and</strong> made necessary by transit-oriented redevelopment—<strong>and</strong><br />
options—groups of strategies designed to ac<strong>com</strong>modate the access needs of <strong>Naylor</strong> <strong>Road</strong> <strong>Station</strong><br />
to 2040.<br />
The options presented in Table ES-6 have been grouped into those that achieve access goals by<br />
A) shifting parking from the station to other locations, B) replacing the station’s parking facilities<br />
on-site, or C) exp<strong>and</strong>ing the parking facilities of the southern Green Line. Kiss & Ride access<br />
would remain at the station under all options.<br />
Options are centered on parking because it is a central driver of transit system accessibility, <strong>and</strong><br />
because its availability is among the most important aspects of successful TOD. While dem<strong>and</strong><br />
for parking is high at <strong>Naylor</strong> <strong>Road</strong> <strong>Station</strong> <strong>and</strong> will continue to grow in the future, devoting too<br />
much space for parking can negatively impact the pedestrian- <strong>and</strong> transit-friendly environment<br />
of TOD as well as reduce the amount of developable l<strong>and</strong>. A balance must be struck to meet<br />
station access needs without <strong>com</strong>promising TOD placemaking principles. Presenting a variety of<br />
options provides different means of achieving this desired balance in the future.<br />
Table ES-6: Summary of Options<br />
Strategies<br />
All-in-one access facility (bicycle, bus, Kiss & Ride,<br />
<strong>and</strong>/or Park & Ride within the same garage)<br />
Developer-constructed garage with reserved transit<br />
parking in a mixed-use building<br />
Developer-constructed parking garage with shared<br />
transit parking in a mixed-use building<br />
Publicly-owned satellite parking facility with feeder<br />
transit service to Green Line stations<br />
Satellite parking through shared-use agreements with<br />
feeder transit service to Green Line stations<br />
Additional parking to other Green Line stations<br />
Out<strong>com</strong>es<br />
Shift Parking Replace Parking Exp<strong>and</strong> Parking<br />
Options<br />
A1 A2 A3 B1 B2 B3 C1 C2 C3<br />
Real-time parking information<br />
Preferred carpool parking <strong>and</strong>/or discounts<br />
Enhanced bus connectivity<br />
ES-7 | Executive Summary
Construction of new, permanent station area access facilities will be located on l<strong>and</strong> currently<br />
occupied by existing facilities. As a result, the <strong>Naylor</strong> <strong>Road</strong> <strong>Station</strong> area will likely require<br />
temporary relocation of these facilities to maintain access during implementation of the station<br />
area site plan. The potential locations of both permanent <strong>and</strong> temporary access facilities are<br />
governed by <strong>Metro</strong>’s <strong>Station</strong> Site <strong>and</strong> <strong>Access</strong> Planning Manual, which sets guidelines for maximum<br />
allowable walking distances between station facilities <strong>and</strong> entrance (500 feet for connecting<br />
transit stops, 600 feet for Kiss & Ride facilities, <strong>and</strong> 1,500 feet for Park & Ride facilities) in<br />
accordance to <strong>Metro</strong>’s station access hierarchy. Maximum allowable walking distances <strong>and</strong> other<br />
constraints in the area limit temporary access facilities to four general locations (Figure ES-3).<br />
Table ES-7 highlights where <strong>Metro</strong> could potentially construct facilities. The most <strong>com</strong>mon<br />
constraints for Locations 2, 3, <strong>and</strong> 4 include costs to purchase additional l<strong>and</strong>, impacts to existing<br />
businesses, <strong>and</strong> forcing customers to cross busy roadways. Location 1 is closer to the station<br />
entrance <strong>and</strong> <strong>Metro</strong> already owns much of this l<strong>and</strong>. However, Location 1 will be the focal<br />
point for joint development <strong>and</strong> the actual availability of l<strong>and</strong> may be constrained once a final<br />
site plan is defined. Note that each location is large <strong>and</strong> would allow for many different facility<br />
configurations. Narrowing down the specific facility setting within any of the four general<br />
locations is reserved for more detailed planning <strong>and</strong> design at a later date.<br />
Figure ES-3: Potential <strong>Station</strong> <strong>Access</strong> Facility Locations<br />
Potential <strong>Station</strong>-<strong>Access</strong><br />
Facility Locations<br />
<strong>Station</strong> Entrance<br />
Suitl<strong>and</strong> Pkwy<br />
N<br />
0 500’<br />
1,500 ft<br />
Oxon Run Dr<br />
<strong>Naylor</strong> Rd<br />
4<br />
500 ft<br />
600 ft<br />
1A 2<br />
1B<br />
1C<br />
3<br />
Branch Ave<br />
Source: Google Earth (aerial)<br />
<strong>Naylor</strong> <strong>Road</strong> <strong>Metro</strong> <strong>Station</strong> <strong>Area</strong> <strong>Access</strong> <strong>and</strong> <strong>Capacity</strong> Study | ES-8
Table ES-7: Opportunities <strong>and</strong> Constraints of Potential <strong>Station</strong>-<strong>Access</strong> Facility Locations<br />
Figure<br />
ES-3 Map<br />
ID<br />
Based on Maximum<br />
Allowable Walking<br />
Distance to <strong>Station</strong><br />
Entrance<br />
Bus Kiss & Park &<br />
Bays Ride Ride<br />
Opportunities Constraints<br />
1A – Proximity to station entrance<br />
– Impacts existing station access facilities<br />
– <strong>Metro</strong> owns most of the l<strong>and</strong><br />
– Impacts existing business<br />
– L<strong>and</strong> purchase may be required<br />
1B – Proximity to station entrance<br />
– Impacts existing station access facilities<br />
– <strong>Metro</strong> owns most of the l<strong>and</strong><br />
– Impacts existing business<br />
– L<strong>and</strong> purchase may be required<br />
1C – Does not impact operations of existing access – Impacts existing businesses<br />
facilities<br />
– L<strong>and</strong> purchase required<br />
2 – Does not impact operations of existing access – Customers must cross Branch Avenue<br />
facilities<br />
– Impacts existing businesses<br />
– Vehicular traffic reduced at <strong>Naylor</strong> <strong>Road</strong><br />
roundabouts<br />
– L<strong>and</strong> purchase required<br />
– Most likely redeveloped first<br />
3 – Does not impact operations of existing access – Customers must cross <strong>Naylor</strong> <strong>Road</strong><br />
facilities<br />
– Impacts existing business<br />
– L<strong>and</strong> purchase required<br />
– Relatively narrow with steep topography<br />
– Adjacent to existing residential area<br />
– Non-st<strong>and</strong>ard size parking garage<br />
– Constrained vehicular access<br />
4 – Does not impact operations of existing access – Customers must cross <strong>Naylor</strong> <strong>Road</strong><br />
facilities<br />
– Impacts existing business<br />
– Customers have a history of parking at this<br />
location<br />
– L<strong>and</strong> purchase required<br />
– Adjacent to existing residential area<br />
ES-9 | Executive Summary
Introduction<br />
Project Purpose <strong>and</strong> Scope<br />
The Washington <strong>Metro</strong>politan <strong>Area</strong> Transit Authority (<strong>Metro</strong>) initiated the <strong>Naylor</strong> <strong>Road</strong> <strong>Metro</strong><br />
<strong>Station</strong> <strong>Area</strong> <strong>Access</strong> <strong>and</strong> <strong>Capacity</strong> Study to evaluate existing <strong>and</strong> future station access <strong>and</strong> capacity<br />
needs within 1/4-mile of <strong>Naylor</strong> <strong>Road</strong> <strong>Station</strong>, particularly with respect to transit-oriented joint<br />
development (TOD) within the station area.<br />
This report presents an evaluation of existing conditions <strong>and</strong> future station access <strong>and</strong><br />
capacity needs of all modes at the <strong>Naylor</strong> <strong>Road</strong> <strong>Station</strong> <strong>and</strong> the adjacent area. In support of the<br />
station area’s planned transition into a regional TOD center, this study identified site access<br />
enhancements needed to improve pedestrian <strong>and</strong> bicycle connections <strong>and</strong> vehicular flow in the<br />
station area; determined future bus facility needs at the station; <strong>and</strong> determined future parking<br />
dem<strong>and</strong> <strong>and</strong> options for replacing <strong>Metro</strong> parking due to proposed redevelopment at the site.<br />
Finally, this report includes a review of relevant prior studies that have identified issues in the<br />
<strong>Naylor</strong> <strong>Road</strong> area. The findings of these previous studies are incorporated into this planning<br />
effort.<br />
Context<br />
Over the past decade, Prince George’s County, the Maryl<strong>and</strong>-National Capital Park <strong>and</strong><br />
Planning Commission (M-NCPPC), <strong>and</strong> the State of Maryl<strong>and</strong> have recognized <strong>Naylor</strong> <strong>Road</strong><br />
<strong>Station</strong> as a catalyst for development in the Branch Avenue corridor (Table 1). The 2002 Prince<br />
George’s County Approved General Plan (General Plan) designated the <strong>Naylor</strong> <strong>Road</strong> <strong>Station</strong><br />
as a Community Center within the County’s Developed Tier to encourage mixed-uses in<br />
support of the surrounding <strong>com</strong>munity. Prince George’s County’s Developed Tier includes<br />
the entire County inside the Beltway <strong>and</strong> contains more than half of the County’s households<br />
<strong>and</strong> employment. The General Plan vision for the Developed Tier is a network of sustainable<br />
mixed-use medium-to high density <strong>com</strong>munities that support transit <strong>and</strong> are oriented toward<br />
pedestrians. Policies for the Developed Tier emphasize quality infill <strong>and</strong> redevelopment,<br />
provision of adequate public facilities to serve existing <strong>and</strong> future residents, <strong>and</strong> preservation<br />
<strong>and</strong> enhancement of the<br />
environment.<br />
Table 1: Previous Planning Studies for <strong>Naylor</strong> <strong>Road</strong> <strong>Station</strong><br />
Plan Title Lead Agency Date<br />
Planning efforts that set<br />
development policies<br />
for <strong>Naylor</strong> <strong>Road</strong> were<br />
<strong>com</strong>pleted in the last five<br />
years. M-NCPPC’s 2008<br />
Approved Preliminary<br />
Branch Avenue Corridor<br />
Sector Plan <strong>and</strong> Proposed<br />
Prince George’s County Approved General Plan M-NCPPC 10/2002<br />
Approved Preliminary Branch Avenue Corridor Sector Plan <strong>and</strong> M-NCPPC 9/2008<br />
Proposed Sectional Map Amendment<br />
Approved Countywide Master Plan of Transportation M-NCPPC 11/2009<br />
<strong>Metro</strong>rail Bicycle & Pedestrian <strong>Access</strong> Improvements Study <strong>Metro</strong> 10/2010<br />
<strong>Naylor</strong> <strong>Road</strong> <strong>Metro</strong> <strong>Station</strong> <strong>Area</strong> <strong>Access</strong>ibility Study M-NCPPC 5/2011<br />
<strong>Metro</strong>rail <strong>Station</strong> <strong>Access</strong> Alternatives Study MWCOG 7/2012<br />
MD 5 (Branch Avenue) <strong>and</strong> MD 637 (<strong>Naylor</strong> <strong>Road</strong>) Streetscape SHA 2013<br />
Improvements<br />
<strong>Metro</strong> Green Line Corridor Action Plan M-NCPPC 2013<br />
1 | Introduction
Sectional Map Amendment (Branch Avenue Corridor Sector Plan) established policies <strong>and</strong><br />
zoning to encourage mixed-use TOD within a half-mile radius of the <strong>Metro</strong>rail station. The<br />
plan re<strong>com</strong>mended an urban mix of uses integrated with new office building within walking<br />
distance of the <strong>Naylor</strong> <strong>Road</strong> <strong>Metro</strong> <strong>Station</strong>. Specifically, the plan designated <strong>Naylor</strong> <strong>Road</strong> <strong>Station</strong><br />
a Regional Center. Regional Centers are locations for regionally marketed retail destinations,<br />
office <strong>and</strong> employment areas, higher education facilities, <strong>and</strong> possibly sports <strong>and</strong> recreational<br />
<strong>com</strong>plexes serving Prince George’s County. High-density residential may be an option if the<br />
needed public facilities <strong>and</strong> services can be provided. Regional Centers feature high transit<br />
access. The plan re<strong>com</strong>mended that <strong>Naylor</strong> <strong>Road</strong> <strong>Station</strong> employ the Mixed-Use Transportation-<br />
Oriented Zone.<br />
However, as noted in M-NCPPC’s 2009 Countywide Master Plan of Transportation, retrofitting<br />
Prince George’s County <strong>Metro</strong>rail station areas in the Developed Tier (such as <strong>Naylor</strong> <strong>Road</strong>)<br />
into TOD <strong>com</strong>munities has been a challenge. Many of these stations are isolated from nearby<br />
<strong>com</strong>munities, as they were constructed alongside major transportation infrastructure like<br />
railroads or highways. For example, Suitl<strong>and</strong> Parkway acts as a barrier between the <strong>Naylor</strong><br />
<strong>Road</strong> station <strong>and</strong> <strong>com</strong>munities to the north <strong>and</strong> west. In addition, the large amount of<br />
non-developable l<strong>and</strong> surrounding the station—Suitl<strong>and</strong> Parkway, Oxon Run Stream Valley<br />
Park, <strong>and</strong> Lincoln Memorial Cemetery—limit the development potential of the immediate<br />
<strong>Naylor</strong> <strong>Road</strong> <strong>Station</strong> area.<br />
Support at the state level arrived in 2010, when Governor O’Malley formally designated<br />
the <strong>Naylor</strong> <strong>Road</strong> <strong>Station</strong>, among other locations throughout the state, as a TOD site. This<br />
designation ensures that State resources can assist in the development of plans <strong>and</strong> construction<br />
of projects at <strong>Naylor</strong> <strong>Road</strong> <strong>Station</strong>, including street improvements such as traffic calming<br />
measures <strong>and</strong> sidewalks installation <strong>and</strong> repair. Similar support from the U.S. Department<br />
of Housing <strong>and</strong> Urban Development (HUD) arrived in 2010 when the Department issued an<br />
$800,000 Sustainable Community Challenge Grant to M-NCPPC to prepare a corridor action<br />
plan for redevelopment <strong>and</strong> improved transportation connectivity along the Green Line between<br />
Southern Avenue <strong>Station</strong> <strong>and</strong> Branch Avenue <strong>Station</strong>. M-NCPPC will <strong>com</strong>plete this study, the<br />
<strong>Metro</strong> Green Line Corridor Action Plan, in 2013.<br />
Recent planning at the regional level supports <strong>Naylor</strong> <strong>Road</strong>’s transformation into a TOD center<br />
by emphasizing <strong>and</strong> prioritizing nonmotorized station access. For example, <strong>Metro</strong>’s <strong>Metro</strong>rail<br />
Bicycle & Pedestrian <strong>Access</strong> Improvements Study (2010) identified strategies to enhance bicycle<br />
<strong>and</strong> pedestrian access <strong>and</strong> connectivity in <strong>and</strong> around <strong>Metro</strong>rail stations. <strong>Metro</strong> categorized<br />
stations into one of nine typologies that vary by l<strong>and</strong> use, adjacent transportation network, site<br />
layout, <strong>and</strong> mode split. Each station typology is paired with specific re<strong>com</strong>mendations that<br />
may be applied to other stations that exhibit similar characteristics. For example, the study<br />
concluded that some of the primary issues for <strong>Naylor</strong> <strong>Road</strong> <strong>Station</strong>, as well as other stations<br />
that share <strong>com</strong>parable features, include barriers to cycling throughout the nearby <strong>com</strong>munities<br />
<strong>and</strong> ensuring that future TOD is designed to encourage <strong>Metro</strong>rail ridership. The <strong>Metro</strong>politan<br />
Washington Council of Governments (MWCOG) carried this station typology forward into its<br />
<strong>Metro</strong>rail <strong>Station</strong> <strong>Access</strong> Alternatives Study (2012), which examined how to maximize passenger<br />
access to <strong>Metro</strong>rail stations by 2040 under different scenarios. In MWCOG’s study, <strong>Naylor</strong> <strong>Road</strong><br />
<strong>Station</strong>, noted for its long-term potential for high-density TOD or planned unit development<br />
<strong>Naylor</strong> <strong>Road</strong> <strong>Metro</strong> <strong>Station</strong> <strong>Area</strong> <strong>Access</strong> <strong>and</strong> <strong>Capacity</strong> Study | 2
(PUD), served as one of five case studies. The study found that <strong>Naylor</strong> <strong>Road</strong> <strong>Station</strong> could<br />
benefit from implementing targeted bus service improvements, satellite parking, <strong>and</strong><br />
neighborhood bus service.<br />
More detailed planning <strong>and</strong> design work continues at the state <strong>and</strong> county levels as well. In<br />
support of the Branch Avenue Corridor Sector Plan’s call for improved pedestrian links to<br />
transit, Maryl<strong>and</strong> State Highway Administration (SHA) initiated the MD 5 (Branch Avenue)<br />
<strong>and</strong> MD 637 (<strong>Naylor</strong> <strong>Road</strong>) Streetscape Improvements study (SHA Streetscape Project) to improve<br />
safety, multimodal access, <strong>and</strong> streetscape aesthetics along the periphery of <strong>Naylor</strong> <strong>Road</strong><br />
<strong>Station</strong>. SHA’s selected streetscape alternative, which is anticipated to enter construction in<br />
2014, includes sidewalks on both sides of Branch Avenue, l<strong>and</strong>scaped medians on Branch<br />
Avenue <strong>and</strong> <strong>Naylor</strong> <strong>Road</strong>, bicycle lanes on Branch Avenue <strong>and</strong> <strong>Naylor</strong> <strong>Road</strong>, on-street parking<br />
on <strong>Naylor</strong> <strong>Road</strong>, “Share the <strong>Road</strong>” signage, <strong>and</strong> ADA (Americans with Disabilities Act)<br />
intersection improvements. The <strong>Naylor</strong> <strong>Road</strong> <strong>Metro</strong> <strong>Station</strong> <strong>Area</strong> <strong>Access</strong>ibility Study (M-NCPPC<br />
<strong>Access</strong>ibility Study), <strong>com</strong>pleted by M-NCPPC in 2011, similarly developed bicycle <strong>and</strong><br />
pedestrian re<strong>com</strong>mendations around the station, including traffic calming, new striping, new<br />
or widened sidewalks, new signage, <strong>and</strong> new or modified signals. This study, funded through a<br />
grant provided by M-NCPPC’s Transportation/L<strong>and</strong> Use Connections (TLC) Program, focused<br />
on low-cost, short-term bicycle <strong>and</strong> pedestrian access improvements within 1/2-mile of <strong>Naylor</strong><br />
<strong>Road</strong> <strong>Station</strong>.<br />
3 | Introduction
Existing <strong>Station</strong> <strong>Area</strong> Characteristics<br />
<strong>Naylor</strong> <strong>Road</strong> <strong>Station</strong> is located on the southern leg of the Green Line in suburban Prince<br />
George’s County, Maryl<strong>and</strong> <strong>and</strong> less than 1/4-mile from Washington, DC (Figure 2). The station<br />
is among the newest in the <strong>Metro</strong>rail system, opening in January 2001 as part of the final<br />
segment of the Green Line to Branch Avenue <strong>Station</strong>.<br />
Figure 1: Existing <strong>Naylor</strong> <strong>Road</strong> <strong>Station</strong> <strong>Area</strong> Characteristics<br />
Source: Google Earth (bottom left)<br />
5 | Existing <strong>Station</strong> <strong>Area</strong> Characteristics
The study boundary is approximately 1/4-mile from the station entrance. The elevated station<br />
platform, south of <strong>and</strong> parallel to Suitl<strong>and</strong> Parkway, is arranged in a center configuration with<br />
one access point connecting to a single mezzanine at ground level. All station area facilities are<br />
contained within three <strong>Metro</strong>-owned parcels totaling 7.6 acres.<br />
<strong>Station</strong> area facilities lie south of the platform <strong>and</strong> tracks <strong>and</strong> are bounded by <strong>Naylor</strong> <strong>Road</strong><br />
(MD 637) to the west <strong>and</strong> south <strong>and</strong> Branch Avenue (MD 5) to the east (Figure 3). <strong>Naylor</strong> <strong>Road</strong><br />
<strong>Station</strong>’s eight bus bays, which wrap around its Kiss & Ride lot, serve 11 <strong>Metro</strong>bus <strong>and</strong> TheBus<br />
Figure 2: <strong>Naylor</strong> <strong>Road</strong> <strong>Station</strong> Location<br />
N<br />
<strong>Naylor</strong> <strong>Road</strong> <strong>Metro</strong> <strong>Station</strong> <strong>Area</strong> <strong>Access</strong> <strong>and</strong> <strong>Capacity</strong> Study | 6
outes. Vehicle access is shared between these two facilities with entry/exit points at both <strong>Naylor</strong><br />
<strong>Road</strong> <strong>and</strong> Branch Avenue. The Kiss & Ride lot contains 73 parking spaces: four h<strong>and</strong>icap spaces,<br />
four Zipcar spaces, 10 motorcycle spaces, 13 “A-spaces” (reserved for waiting motorists), <strong>and</strong><br />
42 short-term metered spaces. A 368-space Park & Ride surface lot <strong>and</strong> its entrance roadway<br />
<strong>com</strong>prise the western half of the station area. Cyclists are ac<strong>com</strong>modated at <strong>Naylor</strong> <strong>Road</strong> <strong>Station</strong><br />
as well, with 10 bicycle racks <strong>and</strong> four bicycle lockers. Several local businesses are located<br />
directly adjacent to the Kiss & Ride lot, southeast of the station platform.<br />
Figure 3: <strong>Naylor</strong> <strong>Road</strong> <strong>Station</strong> Facilities<br />
<strong>Metro</strong> Property<br />
Study <strong>Area</strong><br />
<strong>Station</strong> Entrance<br />
N<br />
0 250’<br />
Branch Ave<br />
Suitl<strong>and</strong> Pkwy<br />
<strong>Station</strong> Platform<br />
1/4 mile<br />
Park & Ride<br />
Bus Bays<br />
Bus Layover<br />
Oxon Run Dr<br />
Good Hope Ave<br />
Kiss & Ride<br />
<strong>Naylor</strong> Rd<br />
Source: Google Earth (aerial)<br />
7 | Existing <strong>Station</strong> <strong>Area</strong> Characteristics
L<strong>and</strong> Use<br />
<strong>Naylor</strong> <strong>Road</strong> <strong>Station</strong> is located approximately six miles from <strong>Metro</strong> Center <strong>Station</strong> in the<br />
Hillcrest Heights <strong>com</strong>munity. Though relatively close to downtown Washington, DC, the station<br />
is also less than three miles from the Branch Avenue <strong>Metro</strong>rail station, the final stop on the<br />
southern leg of the Green Line. <strong>Naylor</strong> <strong>Road</strong> <strong>Station</strong> is largely surrounded by low-density singlefamily<br />
homes, though some high-density multi-family apartment buildings ranging between<br />
seven to nine stories are located to the immediate north <strong>and</strong> south. Commercial development is<br />
located along Branch Avenue <strong>and</strong> <strong>Naylor</strong> <strong>Road</strong> (Figure 4).<br />
Figure 4: L<strong>and</strong> Use near <strong>Naylor</strong> <strong>Road</strong> <strong>Station</strong><br />
District of Columbia<br />
Prince George’s County, MD<br />
Lincoln<br />
Memorial<br />
Cemetery<br />
N<br />
Low Density Residential<br />
Medium Density Residential<br />
Medium to High Density<br />
Residential<br />
Commercial<br />
Institutional<br />
Public <strong>and</strong> Recreational<br />
<strong>Naylor</strong> <strong>Road</strong> <strong>Station</strong><br />
Green Line<br />
0 1,000’<br />
Washington<br />
National<br />
Cemetery<br />
Southern Ave<br />
!<br />
<strong>Station</strong><br />
<strong>Area</strong><br />
1/4 mile 1/2 mile<br />
Suitl<strong>and</strong><br />
Federal<br />
Center<br />
Suitl<strong>and</strong> Pkwy<br />
Oxon Run<br />
Stream Valley<br />
Park<br />
<strong>Naylor</strong> Rd<br />
Overlook<br />
Elementary<br />
School<br />
Branch Ave<br />
Source: Maryl<strong>and</strong> Department of Planning, DC Office of Planning<br />
<strong>Naylor</strong> <strong>Road</strong> <strong>Metro</strong> <strong>Station</strong> <strong>Area</strong> <strong>Access</strong> <strong>and</strong> <strong>Capacity</strong> Study | 8
The <strong>Naylor</strong> <strong>Road</strong> <strong>Station</strong> area <strong>and</strong> the Hillcrest<br />
Heights <strong>com</strong>munity contain a considerable<br />
amount of federally-owned l<strong>and</strong>. A large,<br />
continuous span of parkl<strong>and</strong> on either side of<br />
Suitl<strong>and</strong> Parkway surrounds the station to the<br />
west, north, <strong>and</strong> east. The Lincoln Memorial<br />
Cemetery <strong>and</strong> Washington National Cemetery<br />
occupy large tracts of l<strong>and</strong> about 1/4- to<br />
1/2-mile east of the station. Adjacent to these<br />
cemeteries is the Suitl<strong>and</strong> Federal Center, a<br />
considerably sized Federal office <strong>com</strong>plex<br />
housing the U.S. Census Bureau, among other<br />
agencies.<br />
Figure 5: Commercial Properties along Branch Avenue<br />
Because Hillcrest Heights developed between<br />
the 1920s <strong>and</strong> 1960s, well before the arrival<br />
of <strong>Metro</strong>rail service in 2001, the station area’s<br />
built environment is typical of low-density,<br />
automobile-oriented suburban <strong>com</strong>munities<br />
throughout the metropolitan Washington<br />
region. Branch Avenue, the primary <strong>com</strong>mercial<br />
corridor near the station, is characterized by<br />
aging strip-mall developments with surface<br />
Source: Google Earth<br />
parking lots, including a Budget Inn hotel,<br />
several take-out restaurants, <strong>and</strong> the Branch<br />
<strong>Metro</strong> Plaza Shopping Center, home of the<br />
Skate Palace skating center (Figure 5). <strong>Naylor</strong> <strong>Road</strong>, while less developed than Branch Avenue,<br />
includes the Legend Nightclub <strong>and</strong> a Shell gas station, among other businesses. Suitl<strong>and</strong><br />
Parkway—listed on the National Register of Historic Places <strong>and</strong> maintained by the U.S. National<br />
Park Service (NPS)—remains undeveloped.<br />
Zoning<br />
With the exception of the Suitl<strong>and</strong> Parkway greenspace north of <strong>Naylor</strong> <strong>Road</strong> <strong>Station</strong>, most l<strong>and</strong><br />
within a 1/4-mile walk to the station is zoned as Mixed-Use-Transportation Oriented (M-X-T),<br />
including l<strong>and</strong> owned by <strong>Metro</strong> (Figure 6). Before being updated in 2008 by the Branch Avenue<br />
Corridor Sector Plan, zoning near <strong>Naylor</strong> <strong>Road</strong> <strong>Station</strong> <strong>and</strong> along Branch Avenue was almost<br />
exclusively assigned <strong>com</strong>mercial uses, ranging from restaurants, retail, offices, <strong>and</strong> limited<br />
mixed-uses. The M-X-T zone has replaced <strong>com</strong>mercial zones in these areas, <strong>and</strong> it requires that<br />
new buildings have at least two out of three following uses: retail businesses; office/research/<br />
industrial; <strong>and</strong> dwellings/hotel/motel. This zone was designed to support “24-hour functional<br />
environments” <strong>and</strong> is limited to locations close to major intersections <strong>and</strong> transit corridors.<br />
Increased density is permitted on property closer to <strong>Metro</strong>rail stations, as shown in the vision<br />
for <strong>Naylor</strong> <strong>Road</strong> <strong>Station</strong> from the Branch Avenue Corridor Sector Plan (Figure 7). There are no<br />
restrictions on lot sizes or dwelling types in the M-X-T zone, instead the regulations utilize a<br />
maximum floor-to-area ratio (FAR) calculation. The zone, however, lacks regulatory authority<br />
9 | Existing <strong>Station</strong> <strong>Area</strong> Characteristics
Figure 6: Zoning near <strong>Naylor</strong> <strong>Road</strong> <strong>Station</strong><br />
District of Columbia<br />
Prince George’s County, MD<br />
<strong>Naylor</strong> <strong>Road</strong> <strong>Station</strong><br />
Green Line<br />
Washington, DC Zoning<br />
Single-Family, High-Density, Detached<br />
Residential (R-1-B)<br />
Single-Family, Semi-Detached Residential (R-2)<br />
Rowhouse Residential (R-3)<br />
Low-Density General Residence District (R-5-A)<br />
Neighborhood Shopping District (C-1)<br />
Major Business <strong>and</strong> Employment Centers (C-3-A)<br />
N<br />
0 1,000’<br />
Southern Ave<br />
<strong>Station</strong><br />
<strong>Area</strong><br />
1/4 mile 1/2 mile<br />
Suitl<strong>and</strong> Pkwy<br />
<strong>Naylor</strong> Rd<br />
Branch Ave<br />
Source: Branch Avenue Corridor Sector Plan, Prince George’s County, <strong>and</strong> DC Office of Zoning<br />
Prince George’s County Zoning<br />
Single-Family, Detached Residential (R-55)<br />
Single-Family, Semi-Detached <strong>and</strong> Two-Family,<br />
Detached Residential (R-35)<br />
Townhouse Residential (R-T)<br />
Multi-Family, Medium-Density Residential (R-18)<br />
Multi-Family, High-Density Residential (R-10)<br />
Commercial Miscellaneous (C-M)<br />
Commercial Office (C-O)<br />
Commercial Shopping Center (C-S-C)<br />
Mixed-Use-Transportation Oriented (M-X-T)<br />
Open Space (O-S)<br />
Reserved Open Space (R-O-S)<br />
Unassigned<br />
Figure 7: Vision for <strong>Naylor</strong> <strong>Road</strong> <strong>Station</strong> <strong>Area</strong> <strong>and</strong> Branch Avenue<br />
Source: Branch Avenue Corridor Sector Plan<br />
<strong>Naylor</strong> <strong>Road</strong> <strong>Metro</strong> <strong>Station</strong> <strong>Area</strong> <strong>Access</strong> <strong>and</strong> <strong>Capacity</strong> Study | 10
to require a pedestrian-friendly environment with new buildings, though these details are<br />
negotiated during the design phase. 1<br />
Developed l<strong>and</strong> beyond the M-X-T zone is almost entirely zoned residential. A multifamily,<br />
high-density residential (R-10) zone is located within 1/4-mile of <strong>Naylor</strong> <strong>Road</strong> <strong>Station</strong> to the<br />
northwest. Large residential buildings are permitted in R-10 zones, though buildings exceeding<br />
110 feet require special exception approval. Other nearby residential zones are predominantly<br />
lower-density attached, semi-detached, <strong>and</strong> detached housing. Large tracts of open space are<br />
also located nearby.<br />
1. Branch Avenue<br />
Corridor Sector<br />
Plan (2008)<br />
<strong>Metro</strong>rail Ridership<br />
<strong>Naylor</strong> <strong>Road</strong> <strong>Station</strong> averaged 3,160 entries <strong>and</strong> 3,138 exits per weekday during May 2012, a<br />
seven percent decline from the station’s highest recorded ridership in 2006 with 3,402 entries.<br />
Peak hours of ridership occur from 7:00 to 8:00<br />
AM in the morning <strong>and</strong> 5:00 to 6:00 PM in the<br />
afternoon.<br />
A large imbalance between entries <strong>and</strong> exits is<br />
observed during peak periods at <strong>Naylor</strong> <strong>Road</strong><br />
<strong>Station</strong> (Figure 8), which is indicative of heavy<br />
use by daily <strong>com</strong>muters. Morning <strong>and</strong> afternoon<br />
peaking is very pronounced, with most people<br />
entering the station in the morning <strong>and</strong> exiting<br />
in the afternoon—an indication of few jobs<br />
in the area. During the general <strong>Metro</strong>rail<br />
systemwide morning peak period (5:00 to 9:30<br />
AM), approximately eight passengers enter the<br />
station per every exiting passenger. Conversely,<br />
almost four passengers exit the station per<br />
every entering passenger during the afternoon<br />
systemwide peak period (3:00 to 7:00 PM).<br />
Midday entries remain relatively stable<br />
following the morning peak period until<br />
about 6:00 PM where they begin to decline.<br />
Exits slowly increase throughout the morning<br />
<strong>and</strong> midday periods, but greatly accelerate at<br />
2:00 PM. Following the afternoon peak period, passenger exits<br />
inconsistently decline with some small surges of increased activity<br />
around midnight.<br />
Peak period service along the Green Line has six-minute<br />
headways, while non-peak service has 12 minute headways. Table<br />
3 summarizes typical rail frequencies at the <strong>Naylor</strong> <strong>Road</strong> <strong>Station</strong><br />
for weekday <strong>and</strong> weekend time periods.<br />
Table 2: Average Weekday <strong>Metro</strong>rail Ridership (May 2012)<br />
Time Period Entries Exits Total<br />
Daily 3,160 3,138 6,298<br />
Morning Peak Hour 7:00 to 8:00 AM 645 69 714<br />
Afternoon Peak Hour 5:00 to 6:00 PM 110 560 670<br />
Source: <strong>Metro</strong> faregate data<br />
Figure 8: <strong>Naylor</strong> <strong>Road</strong> <strong>Station</strong> <strong>Metro</strong>rail Ridership Pattern<br />
350<br />
Entries<br />
300<br />
Exits<br />
250<br />
Passengers<br />
200<br />
150<br />
100<br />
50<br />
0<br />
Source: <strong>Metro</strong> faregate data<br />
Time of Day (24-Hour Clock)<br />
Table 3: <strong>Metro</strong>rail Frequency at <strong>Naylor</strong><br />
<strong>Road</strong> <strong>Station</strong><br />
Headway<br />
Day Period<br />
(minutes)<br />
Weekday Morning Peak 6<br />
Mid-day 12<br />
Afternoon Peak 6<br />
Early evening 12<br />
Late evening 20<br />
Weekend Morning to evening 12-15<br />
Evening 20<br />
11 | Existing <strong>Station</strong> <strong>Area</strong> Characteristics
Table 4: <strong>Access</strong> <strong>and</strong> Egress at <strong>Naylor</strong> <strong>Road</strong> <strong>Station</strong><br />
2007 Mode Shares<br />
2007 Mode<br />
Shares*<br />
Applied to 2012<br />
Passenger Totals<br />
Mode<br />
<strong>Access</strong> Egress <strong>Access</strong> Egress<br />
Walk 24% 12% 760 377<br />
Bicycle 0% 0% 0 0<br />
Bus 37% 54% 1,170 1,695<br />
Kiss & Ride 16% 7% 505 220<br />
Park & Ride (drivers <strong>and</strong> passengers) 22% 23% 695 721<br />
Other (taxi, in<strong>com</strong>plete surveys) 1% 4% 30 125<br />
Total 100% 100% 3,160 3,138<br />
Source: 2007 <strong>Metro</strong>rail Passenger Survey, <strong>Metro</strong> faregate data<br />
* This mode share included satellite parking at the Legend Nightclub across <strong>Naylor</strong> <strong>Road</strong><br />
<strong>Station</strong> <strong>Access</strong><br />
Results from the 2007 <strong>Metro</strong>rail Passenger<br />
Survey show an access <strong>and</strong> egress<br />
imbalance at <strong>Naylor</strong> <strong>Road</strong> <strong>Station</strong> (Table<br />
4). The data shows that considerably more<br />
people exit the station by bus than enter<br />
by bus. This difference can also be seen in<br />
the walk <strong>and</strong> Kiss & Ride modes, as exits<br />
by these modes of travel are fewer than<br />
entries. Mode shares that significantly<br />
vary between entries <strong>and</strong> exits are<br />
atypical. These results are likely due to the<br />
small number of <strong>com</strong>pleted surveys for<br />
<strong>Naylor</strong> <strong>Road</strong> <strong>Station</strong>: 188 <strong>and</strong> 143 returned surveys with <strong>Naylor</strong> <strong>Road</strong> <strong>Station</strong> as the trip origin<br />
<strong>and</strong> destination, respectively.<br />
Despite the results’ uncertainty, it is reasonable to assume that real-world conditions fall<br />
somewhere between the access <strong>and</strong> egress results in Table 4.<br />
Pedestrian<br />
Safe <strong>and</strong> efficient pedestrian access to <strong>Naylor</strong> <strong>Road</strong> <strong>Station</strong> is vital, as almost one in four<br />
<strong>Metro</strong>rail passengers access the station by foot. While the surrounding station area is fairly well<br />
connected by sidewalks of varying width <strong>and</strong> quality, many pedestrian facilities—sidewalks,<br />
crosswalks, signals, signage, etc.—in the station area need improvement <strong>and</strong> could potentially<br />
impact pedestrian safety. Nearby roadways, particularly Branch Avenue, serving as major<br />
pedestrian links are perceived as dangerous <strong>and</strong> uninviting for pedestrians, especially when<br />
crossing the street. The following key observations are the result of several site surveys to<br />
evaluate existing pedestrian access:<br />
• Large number of pedestrians crossing in the morning <strong>and</strong> afternoon peak periods<br />
• Speeding motorists on Branch Avenue<br />
• Missing <strong>and</strong> narrow sidewalks along Branch Avenue, Oxon Run Drive, <strong>and</strong> <strong>Naylor</strong> <strong>Road</strong><br />
• Curb cuts on east side of Branch Avenue for <strong>com</strong>mercial frontage impede pedestrian access<br />
• Sidewalk conditions could be enhanced on Branch Avenue<br />
• Traffic signals oriented to automobile traffic <strong>and</strong> not the pedestrian<br />
• No striped crosswalks on Branch Avenue <strong>and</strong> pedestrian refuge too narrow<br />
• Deteriorating street surfaces<br />
• Numerous access points, power poles, <strong>and</strong> signage create obstacles along sidewalks<br />
• Several impromptu unpaved paths (desired paths to station area) in the station area<br />
These pedestrian safety <strong>and</strong> connectivity concerns have been echoed in other planning studies,<br />
notably the SHA Streetscape Project <strong>and</strong> M-NCPPC <strong>Access</strong>ibility Study. Re<strong>com</strong>mendations from<br />
these studies will be discussed later in this report.<br />
<strong>Naylor</strong> <strong>Road</strong> <strong>Metro</strong> <strong>Station</strong> <strong>Area</strong> <strong>Access</strong> <strong>and</strong> <strong>Capacity</strong> Study | 12
Sidewalks<br />
Sidewalk coverage of varying width <strong>and</strong> quality is fairly extensive near <strong>Naylor</strong> <strong>Road</strong> <strong>Station</strong><br />
(Figure 9). However, sidewalks are missing on the most direct pedestrian routes of Branch<br />
Avenue, <strong>Naylor</strong> <strong>Road</strong>, <strong>and</strong> Oxon Run Drive, <strong>and</strong> some sidewalks are not wide enough for<br />
pedestrians to pass one another. Because most pedestrians can only access the station by walking<br />
along these roadways, a lack of sidewalks, even if only on one side of a roadway, is a significant<br />
issue.<br />
Sidewalks on Branch Avenue, when present, are narrow <strong>and</strong>, north of Curtis Drive to the District<br />
line, lack a vegetated buffer to separate high-speed traffic. These sidewalks are often poorly<br />
maintained. Branch Avenue sidewalks are frequently interrupted by curb cuts that provide<br />
vehicle access to aging <strong>com</strong>mercial buildings <strong>and</strong> increase the number of potential conflict points<br />
between vehicles <strong>and</strong> pedestrians (Figure 10).<br />
Figure 9: Sidewalk Availability near <strong>Naylor</strong> <strong>Road</strong> <strong>Station</strong><br />
Existing Sidewalk<br />
Missing Sidewalk<br />
<strong>Naylor</strong> <strong>Road</strong> <strong>Station</strong><br />
Green Line<br />
N<br />
0 500’<br />
Suitl<strong>and</strong> Pkwy<br />
Southern Ave<br />
1/4 mile 1/2 mile<br />
<strong>Naylor</strong> Rd<br />
Oxon Run Dr<br />
Branch Ave<br />
Source: Google Earth (aerial)<br />
13 | Existing <strong>Station</strong> <strong>Area</strong> Characteristics
Figure 10: Curb Cuts on Branch Avenue<br />
Source: Google Earth (aerial)<br />
Figure 11: <strong>Naylor</strong> <strong>Road</strong> Sidewalk<br />
Figure 12: Missing Sidewalk along <strong>Naylor</strong> <strong>Road</strong><br />
<strong>Naylor</strong> <strong>Road</strong>’s four-foot-wide sidewalks are<br />
in good condition as they are relatively new<br />
<strong>com</strong>pared to sidewalks along Branch Avenue.<br />
Most of <strong>Naylor</strong> <strong>Road</strong> sidewalks are separated<br />
from the roadway by a vegetated buffer (Figure<br />
11). Sidewalks are missing on the east side of<br />
<strong>Naylor</strong> <strong>Road</strong> between Oxon Run Drive <strong>and</strong><br />
Southern Avenue. Many pedestrians prefer to<br />
walk along the east side of <strong>Naylor</strong> <strong>Road</strong> <strong>and</strong><br />
have thus created a worn pathway (Figure<br />
12). Narrow <strong>and</strong> missing sidewalks are also<br />
found on Oxon Run Drive, one of the few direct<br />
pedestrian connections to the station from<br />
residential neighborhoods to the south.<br />
Unpaved Pathways<br />
Pedestrian access at the station area boundary<br />
is made more difficult due to few access points<br />
that often do not follow pedestrian desire lines.<br />
A barbed-wire fence encloses the station area<br />
perimeter, which funnels pedestrians into<br />
only two access points: the station entrance at<br />
Branch Avenue <strong>and</strong> the Good Hope Avenue<br />
station entrance roundabout. As a result,<br />
pedestrians have created several worn, dirt<br />
pathways from repeatedly walking where no<br />
sidewalks exist to access impromptu points of<br />
access (Figure 13). These worn pathways, often<br />
called “goat trails,” are important indicators<br />
of where the pedestrian infrastructure is not<br />
meeting the needs of the walking public, <strong>and</strong><br />
where targeted improvements are likely to have<br />
a positive impact.<br />
<strong>Station</strong> observations found that Branch Avenue<br />
is the most popular pedestrian entrance<br />
because it provides quick access to nearby<br />
businesses in the area, including the Branch<br />
<strong>Metro</strong> Plaza Shopping Center. Pedestrians<br />
so frequently walk between the station <strong>and</strong><br />
the shopping center that they have worn the<br />
ground into an ad-hoc pathway on the east <strong>and</strong><br />
west sides of Branch Avenue (Figure 14). This<br />
unplanned pathway represents a natural desire<br />
line (i.e. the most convenient <strong>and</strong> often shortest<br />
pedestrian path between two points).<br />
<strong>Naylor</strong> <strong>Road</strong> <strong>Metro</strong> <strong>Station</strong> <strong>Area</strong> <strong>Access</strong> <strong>and</strong> <strong>Capacity</strong> Study | 14
The Oxon Run Drive entrance also exhibits worn pathways that demonstrate pedestrian desire<br />
lines. The Oxon Run Drive station entrance roundabout serves the Park & Ride lot <strong>and</strong> lacks a<br />
continuous sidewalk to safely guide pedestrians to the station entrance. However, pedestrians<br />
continue to enter <strong>and</strong> exit the station area through this access point because it is convenient.<br />
Pedestrians utilize an opening in the Park & Ride fence near the payment booth, which was<br />
originally created for quicker access to the booth by <strong>Metro</strong> employees (Figure 15). Pedestrians<br />
walk through the Park & Ride lot when using this impromptu access point.<br />
Pedestrians arriving from <strong>Naylor</strong> <strong>Road</strong> north of Suitl<strong>and</strong> Parkway have accessed the station in<br />
the past by creating a hole in the fence at the northwest corner of the Park & Ride lot to reduce<br />
walking times to the station entrance. This opening, however, is currently mended with a more<br />
durable fence (Figure 16). Pedestrians have also created a dirt pathway along the east side of<br />
<strong>Naylor</strong> <strong>Road</strong> where a sidewalk presently does not exist (Figure 12).<br />
Figure 13: Pedestrian Desire Lines, Pedestrian Barriers, Informal Paths<br />
Suitl<strong>and</strong> Pkwy<br />
Pedestrian <strong>Access</strong> Point<br />
Pedestrian Desire Line<br />
Unpaved Pathway<br />
Fence<br />
<strong>Naylor</strong> <strong>Road</strong> <strong>Station</strong><br />
N<br />
0 200’<br />
Branch Ave<br />
Oxon Run Dr<br />
<strong>Naylor</strong> Rd<br />
Source: <strong>Metro</strong> Pedestrian <strong>and</strong> Bicycle Element of 2012-2017 Capital Improvement Program, Google Earth (aerial)<br />
15 | Existing <strong>Station</strong> <strong>Area</strong> Characteristics
Figure 14: Worn Pathway at Branch Avenue <strong>Station</strong> Entrance<br />
Figure 15: Worn Pathways at Oxon Run Drive Park & Ride Entrance<br />
Figure 16: Reinforced Fence at Northwest Corner of Park & Ride<br />
<strong>Naylor</strong> <strong>Road</strong> <strong>Metro</strong> <strong>Station</strong> <strong>Area</strong> <strong>Access</strong> <strong>and</strong> <strong>Capacity</strong> Study | 16
Crossings<br />
Multistory residential towers (Marlborough House, Top of the Hill Apartments, <strong>and</strong> Carriage<br />
Hill Apartments) <strong>and</strong> single-family residential neighborhoods north <strong>and</strong> south of the station<br />
generate large numbers of Suitl<strong>and</strong> Parkway <strong>and</strong> <strong>Naylor</strong> pedestrian crossings. Similarly, many<br />
pedestrians travel to the station from origins east of Branch Avenue, requiring pedestrians<br />
to cross this busy roadway. Nine collisions involving pedestrians or cyclists occurred along<br />
Branch Avenue during between 2007 <strong>and</strong> 2009. While <strong>Naylor</strong> <strong>Road</strong> intersections exhibit some<br />
crossing amenities, there is a great need for safe crossings <strong>and</strong> ADA improvements, especially at<br />
intersections that lack pedestrian crossing amenities (Figure 17).<br />
The Suitl<strong>and</strong> Parkway <strong>and</strong> <strong>Naylor</strong> <strong>Road</strong> intersection <strong>and</strong> the Branch Avenue station entrance<br />
intersection present serious pedestrian safety issues. These intersections are missing crosswalks,<br />
Figure 17: Observed Pedestrian Crossing Issues<br />
Suitl<strong>and</strong> Pkwy<br />
Midblock Crossings<br />
Large Turning Radii<br />
Missing Crosswalk<br />
Missing Pedestrian Signal<br />
Long Signal Cycle Length<br />
<strong>Station</strong> Entrance<br />
<strong>Naylor</strong> Rd<br />
N<br />
0 250’<br />
Branch Ave<br />
Oxon Run Dr<br />
Good Hope Ave<br />
<strong>Naylor</strong> Rd<br />
Source: <strong>Station</strong> observations, <strong>Naylor</strong> <strong>Road</strong> <strong>Metro</strong> <strong>Station</strong> <strong>Area</strong> <strong>Access</strong>ibility Study, Google Earth (aerial)<br />
17 | Existing <strong>Station</strong> <strong>Area</strong> Characteristics
Figure 18: Pedestrian Amenities at <strong>Naylor</strong> <strong>Road</strong> <strong>and</strong> Branch Avenue Intersection<br />
Figure 19: <strong>Station</strong> <strong>Access</strong> at the Good Hope Avenue Roundabout<br />
Figure 20: Pedestrian Crossing Branch Avenue Midblock<br />
<strong>Naylor</strong> <strong>Road</strong> <strong>Metro</strong> <strong>Station</strong> <strong>Area</strong> <strong>Access</strong> <strong>and</strong> <strong>Capacity</strong> Study | 18
pedestrian signals, <strong>and</strong> sidewalks, <strong>and</strong> are among the busiest pedestrian crossings in the study<br />
area. When crossing Suitl<strong>and</strong> Parkway, pedestrians must cross right-turn slip lanes with large<br />
turning radii. Additional study-area intersections exhibit large turning radii, which allow<br />
motorists to turn at high speeds. Only the Branch Avenue <strong>and</strong> <strong>Naylor</strong> <strong>Road</strong> intersection features<br />
a push-button pedestrian countdown timer.<br />
<strong>Naylor</strong> <strong>Road</strong>’s roundabouts, in contrast, include crosswalks <strong>and</strong> ADA-<strong>com</strong>plaint curb ramps<br />
(Figure 19). While several <strong>Naylor</strong> <strong>Road</strong> intersections were upgraded a few years ago with<br />
prominent crosswalk striping, median refuges, <strong>and</strong> pedestrian signage, its pedestrian crossings<br />
continue to present safety issues. <strong>Station</strong> observations revealed that pedestrians frequently run<br />
across <strong>Naylor</strong> <strong>Road</strong> at designated crosswalks because the roundabouts fail to provide adequate<br />
breaks in heavy traffic.<br />
In addition, pedestrians continue to cross Branch Avenue midblock in the vicinity of the station<br />
entrance (Figure 20). The nearest marked crossing of Branch Avenue, located at the <strong>Naylor</strong> <strong>Road</strong><br />
intersection, is approximately 1,000 feet from Branch Avenue station entrance. Despite the lack<br />
of crosswalks or pedestrian signals, pedestrians cross Branch Avenue midblock because doing so<br />
can reduce travel time <strong>and</strong> thus increase convenience.<br />
Wayfinding Signage<br />
Pedestrian wayfinding signage surrounding <strong>Naylor</strong> <strong>Road</strong> <strong>Station</strong> is limited. Wayfinding sign<br />
designs range from small signs with a logo <strong>and</strong> arrow only, to large signs with arrows indicating<br />
where station facilities are located (Figure 21). All of these signs are oriented to motorists, not<br />
pedestrians, <strong>and</strong> lack information about points of interest within the local <strong>com</strong>munity.<br />
Figure 21: Existing Wayfinding Signage near <strong>Naylor</strong> <strong>Road</strong> <strong>Station</strong><br />
19 | Existing <strong>Station</strong> <strong>Area</strong> Characteristics
Figure 22: <strong>Naylor</strong> <strong>Road</strong> <strong>Station</strong> Bicycle Racks <strong>and</strong> Lockers<br />
Bicycle<br />
Branch Avenue is perceived as a<br />
dangerous place for cyclists as well. The<br />
following key bicycle observations are the<br />
result of several site surveys to evaluate<br />
existing bicycle access:<br />
• Speeding on Branch Avenue<br />
• Curb cuts on east side of Branch<br />
Avenue for <strong>com</strong>mercial frontage<br />
increase the number of conflict<br />
points between cyclists <strong>and</strong> vehicles<br />
• Deteriorating street surfaces<br />
• No existing bicycle connection from<br />
the station to Oxon Run Trail<br />
Figure 23: <strong>Naylor</strong> <strong>Road</strong> <strong>Station</strong> Bicycle Parking<br />
Bicycle Lockers<br />
Bicycle Racks<br />
<strong>Naylor</strong> <strong>Road</strong> <strong>Station</strong><br />
N 0 100’<br />
Current dem<strong>and</strong> for bicycle parking is<br />
low. Very few passengers bike to <strong>Naylor</strong><br />
<strong>Road</strong> <strong>Station</strong> as a result of limited cycling<br />
facilities in the area as well as the station’s<br />
location amidst regional <strong>com</strong>muter<br />
roadways with heavy traffic. Ten bicycle<br />
racks <strong>and</strong> four bicycle lockers are located<br />
near the station entrance (Figure 22).<br />
All racks are located west of the station<br />
entrance while the lockers are found<br />
south of the entrance (Figure 23). As of<br />
December 2012, no bicycle lockers at<br />
<strong>Naylor</strong> <strong>Road</strong> <strong>Station</strong> are rented.<br />
No bike lanes, multi-use trails, or<br />
designated shared-use roadways connect<br />
directly to <strong>Naylor</strong> <strong>Road</strong> <strong>Station</strong>. However,<br />
residential roadways south of the station<br />
provide a safe alternative due to low<br />
traffic volumes <strong>and</strong> direct access via Good<br />
Hope Avenue.<br />
Source: Google Earth (aerial)<br />
Bus<br />
<strong>Naylor</strong> <strong>Road</strong> <strong>Station</strong> is served by<br />
<strong>Metro</strong>bus <strong>and</strong> Prince George’s County’s<br />
TheBus (Figure 24 <strong>and</strong> Table 5), with 26<br />
<strong>and</strong> 23 buses arriving during the morning<br />
peak hour (7:30 to 8:30 AM) <strong>and</strong> afternoon peak hour (5:00 to 6:00 PM), respectively. <strong>Metro</strong>bus<br />
service hours of operation vary considerably depending on the route. Typical <strong>Metro</strong>bus service<br />
frequencies (headway) for routes serving <strong>Naylor</strong> <strong>Road</strong> <strong>Station</strong> vary from 20 to 30 minutes during<br />
<strong>Naylor</strong> <strong>Road</strong> <strong>Metro</strong> <strong>Station</strong> <strong>Area</strong> <strong>Access</strong> <strong>and</strong> <strong>Capacity</strong> Study | 20
the morning <strong>and</strong> afternoon peak periods <strong>and</strong> 30 to 45 minutes during off peak periods. Some<br />
routes do not operate on Sundays.<br />
<strong>Metro</strong>bus routes 34, 36, 39, C12, C14, F14, H11, H12, H13, <strong>and</strong> M2, <strong>and</strong> TheBus route 32 directly<br />
serve the station’s eight saw-tooth bus bays. However, only seven bays have a route assigned.<br />
Bay C, located near the station entrance, serves as a passenger drop-off location for all routes.<br />
Bay F, which is utilized by <strong>Metro</strong>bus routes 36 <strong>and</strong> 39, is the most frequently-served bay<br />
at <strong>Naylor</strong> <strong>Road</strong> <strong>Station</strong>, with eight buses during the morning peak hour <strong>and</strong> six during the<br />
afternoon peak hour. Bays C <strong>and</strong> D are large enough to ac<strong>com</strong>modate articulated buses.<br />
Buses access <strong>Naylor</strong> <strong>Road</strong> <strong>Station</strong> bays from one of two locations—at Branch Avenue <strong>and</strong> at<br />
<strong>Naylor</strong> <strong>Road</strong>—that are shared with the Kiss & Ride lot located inside the counterclockwise bus<br />
Figure 24: <strong>Naylor</strong> <strong>Road</strong> <strong>Station</strong> Bus Bay Assignments<br />
Suitl<strong>and</strong> Pkwy<br />
C<br />
B<br />
A<br />
D<br />
E<br />
Branch Ave<br />
F<br />
G<br />
H<br />
Oxon Run Dr<br />
<strong>Naylor</strong> Rd<br />
Bay<br />
A<br />
B<br />
D<br />
E<br />
F<br />
F<br />
G<br />
H<br />
<strong>Metro</strong>bus<br />
M2<br />
F14<br />
H11, H12, H13<br />
C12, C14<br />
36<br />
39<br />
34<br />
TheBus<br />
32<br />
N<br />
0 200’<br />
Source: Google Earth (aerial)<br />
21 | Existing <strong>Station</strong> <strong>Area</strong> Characteristics
loop. The Branch Avenue entrance intersection is controlled via traffic signal, permitting left<br />
turns into <strong>and</strong> out of the station. Along the southern edge of the station area, the shared <strong>Naylor</strong><br />
<strong>Road</strong> bus loop <strong>and</strong> Kiss & Ride entrance features a roundabout. Bus drivers often experience<br />
delay when exiting the station at this location during peak hours as a result of heavy through<br />
traffic on <strong>Naylor</strong> <strong>Road</strong>.<br />
Most bus bays are located along the west side of the bus loop, though Bays A through C are<br />
located along its northern edge parallel to the station platform (Figure 24). Up to four buses can<br />
layover along the bus loop roadway east of the Kiss & Ride. While the loop design of the bus bay<br />
area allows for easy recirculation after layover for most routes, buses can only access Bays A <strong>and</strong><br />
B from Branch Avenue, <strong>and</strong> not from the bus loop itself. Routes serving these bays layover at<br />
their assigned bay.<br />
Table 5: Bus Bay Assignments<br />
Headway<br />
Bay Route Destination Serving Operator Morning Midday Afternoon<br />
A M2 Fairfax Village Southern Ave <strong>Metro</strong>bus 20 - 20<br />
B F14 New Bradbury Hts, Addison <strong>Road</strong>, Capital Heights, L<strong>and</strong>over <strong>Metro</strong>bus 30 50 30<br />
Carrollton Mall, Glenarden<br />
C Unassigned Used as a drop-off area - - - -<br />
D H11 Temple Hills Hillcrest Heights, Marlow Heights, Marlow Overlook <strong>Metro</strong>bus - - 15-30<br />
H12 Temple Hills Hillcrest Heights, Marlow Heights, Marlow Overlook <strong>Metro</strong>bus 18-35 60 -<br />
H13 Temple Hills Branch Ave direct <strong>Metro</strong>bus 20 - -<br />
E C12 Branch Ave Carriage Hill, Hillcrest Heights, Applegate <strong>Metro</strong>bus - - 25<br />
C14 Branch Ave Carriage Hill, Iverson Mall, Applegate <strong>Metro</strong>bus 30 60 -<br />
F 36 Friendship Hillcrest, Branch Ave, Penn Ave, Wisconsin Ave <strong>Metro</strong>bus 15-30 30 15-30<br />
Heights<br />
39 Potomac Pk/ Southern Ave, Penn Ave, Limited Stop <strong>Metro</strong>bus 15 - -<br />
State Dept<br />
G 34 Archives <strong>Naylor</strong> Rd, Penn Ave, Eastern Market, 7th St <strong>Metro</strong>bus 20 30 15<br />
H TB32 Clinton Iverson Mall, Camp Springs, Kaiser Permanente TheBus 30 30 30<br />
Figure 25: <strong>Naylor</strong> <strong>Road</strong> <strong>Station</strong> Bus Bays<br />
<strong>Naylor</strong> <strong>Road</strong> <strong>Metro</strong> <strong>Station</strong> <strong>Area</strong> <strong>Access</strong> <strong>and</strong> <strong>Capacity</strong> Study | 22
The current eight bus bays are<br />
underutilized, with four of the seven<br />
revenue bays less than 50 percent occupied<br />
during the daily peak hour (Table 6).<br />
Nearly twice the number of buses<br />
currently serving <strong>Naylor</strong> <strong>Road</strong> <strong>Station</strong><br />
could be ac<strong>com</strong>modated with the existing<br />
configuration.<br />
Figure 26: Shared Bus Bay <strong>and</strong> Kiss & Ride Entrance at Branch<br />
Avenue<br />
Despite the relatively low utilization of its<br />
bus bays, many passengers enter <strong>and</strong> exit<br />
buses at <strong>Naylor</strong> <strong>Road</strong> <strong>Station</strong>. Roughly the<br />
same number of passengers board a bus as<br />
board a train at the station, as summarized<br />
in Table 7.<br />
<strong>Station</strong> observations revealed that use<br />
of Bay C, the unassigned drop-off bay,<br />
Route<br />
is inconsistent. Most, but not all, drivers<br />
prefer to stop just beyond Bay C near the<br />
station entrance, <strong>and</strong> in proximity to a<br />
fire hydrant. Many drivers remain at the<br />
drop-off location instead of proceeding<br />
to their assigned bay, blocking its use by<br />
other drivers who then temporarily double<br />
park <strong>and</strong> unload passengers. During field<br />
observations for this study, a doubleparked<br />
bus conducted a driver change, blocking all buses behind it.<br />
The station area appears in to be in good condition overall, though litter<br />
is sometimes an issue <strong>and</strong> Bays F <strong>and</strong> G are missing bus maps as of June<br />
2012. Bay C does not display a bus map either, but it is not assigned a<br />
specific bus route. In addition, motorists mistakenly enter the bus-only<br />
area from the Branch Avenue entrance due to poor signage <strong>and</strong> very<br />
short site distance. Motorists are allowed 70 feet before realizing they<br />
must stay to the left to access the Kiss & Ride lot, as shown in Figure 26.<br />
Table 6: Bus Bay Utilization during the Daily Peak Hour<br />
Beyond the bus loop bus bays, only one bus stop is located within the study area (1/4-mile<br />
from <strong>Naylor</strong> <strong>Road</strong> <strong>Station</strong>): a southbound stop on Branch Avenue near the District line (Figure<br />
27). This <strong>and</strong> other stops near the station but not within the study area lack amenities such as<br />
shelters, benches, or bus schedules. Some stops south of the station lack sidewalk access entirely<br />
or are located near intersections without ADA-<strong>com</strong>pliant curb ramps.<br />
Bus<br />
Bay<br />
Buses per<br />
Peak Hour<br />
Total Time at<br />
Bay (minutes)<br />
Bay<br />
Utilization<br />
Provider<br />
M2 <strong>Metro</strong>bus A 3.0 24 40%<br />
F14 <strong>Metro</strong>bus B 2.0 20 33%<br />
Drop-off N/A C N/A N/A N/A<br />
H11-13 <strong>Metro</strong>bus D 4.0 44 73%<br />
C12, C14 <strong>Metro</strong>bus E 2.4 22 36%<br />
36, 39 <strong>Metro</strong>bus F 8.0 76 127%<br />
34 <strong>Metro</strong>bus G 4.0 40 67%<br />
TB32 TheBus H 2.0 26 43%<br />
Table 7: Typical Weekday <strong>Station</strong><br />
Activity<br />
Daily<br />
Entries<br />
Daily<br />
Exits<br />
Mode<br />
<strong>Metro</strong>rail 3,160 3,138<br />
All Buses 3,250 3,250<br />
Total 6,410 6,388<br />
Source: <strong>Metro</strong> faregate data (2012),<br />
MWCOG 2008 Regional Bus Survey<br />
Note: Bus values are approximate<br />
Branch Avenue bus stop amenities vary by location (Figure 28). The northbound Branch Avenue<br />
bus stop near the District line lacks a sidewalk, shelter, <strong>and</strong> bench, while two other Branch<br />
Avenue stops near the station lack shelters <strong>and</strong> benches but are located on sidewalks. The<br />
23 | Existing <strong>Station</strong> <strong>Area</strong> Characteristics
Figure 27: Bus Stops near <strong>Naylor</strong> <strong>Road</strong> <strong>Station</strong><br />
Bus Stop<br />
<strong>Naylor</strong> <strong>Road</strong> <strong>Station</strong><br />
N<br />
0 1,000’<br />
<strong>Naylor</strong> <strong>Road</strong><br />
1/4 mile 1/2 mile<br />
Figure 28: Amenities Vary at Branch Avenue Bus Stops: SB at Curtis Drive (left) <strong>and</strong> NB at Southern Avenue (right)<br />
Source: Google Earth (right)<br />
<strong>Naylor</strong> <strong>Road</strong> <strong>Metro</strong> <strong>Station</strong> <strong>Area</strong> <strong>Access</strong> <strong>and</strong> <strong>Capacity</strong> Study | 24
southbound Branch Avenue bus stop at Curtis Drive—the most <strong>com</strong>plete bus stop in the area—<br />
includes a sidewalk, shelter, bench, <strong>and</strong> NextBus phone number sign.<br />
Shuttle<br />
No private shuttles currently provide service to <strong>Naylor</strong> <strong>Road</strong> <strong>Station</strong>. As summarized in <strong>Metro</strong>’s<br />
Shuttle Services at <strong>Metro</strong> Facilities study (2011), <strong>Metro</strong>rail stations that are served by private<br />
shuttles are most often close, but beyond a reasonable walking distance (about 1/2 mile), to highdensity<br />
offices <strong>and</strong> apartment or condominium buildings. <strong>Naylor</strong> <strong>Road</strong> <strong>Station</strong>’s lack of private<br />
shuttle service is indicative of a lack of similar activity centers near the station. For example,<br />
proximate high-density apartment <strong>and</strong> condominium buildings are well within 1/2-mile from<br />
the station, <strong>and</strong> with the exception of Suitl<strong>and</strong> Federal Center, which is adjacent to Suitl<strong>and</strong><br />
<strong>Station</strong>, high-density office space is absent from the <strong>com</strong>munity. In addition, major roadways<br />
surrounding the station are well served by existing bus routes, reducing the market for private<br />
shuttles.<br />
However, station observations for the Shuttle Services at <strong>Metro</strong> Facilities study showed that<br />
automobile dealerships are a <strong>com</strong>mon source for appointment-only shuttles to <strong>Metro</strong>rail<br />
stations. While these shuttle services were not observed at <strong>Naylor</strong> <strong>Road</strong> <strong>Station</strong>, many<br />
dealerships are located several miles to the southeast in Marlow Heights along St. Barnabas<br />
<strong>Road</strong> <strong>and</strong> Branch Avenue. It is possible that some dealership shuttles may infrequently serve<br />
<strong>Naylor</strong> <strong>Road</strong> <strong>Station</strong> due to customer requests despite that most of these dealerships are closer to<br />
Suitl<strong>and</strong> <strong>Station</strong> or Branch Avenue <strong>Station</strong>.<br />
Vehicular <strong>Access</strong><br />
Nearby <strong>Road</strong>ways<br />
Branch Avenue, <strong>Naylor</strong><br />
<strong>Road</strong>, <strong>and</strong> Suitl<strong>and</strong><br />
Parkway–roadways<br />
surrounding <strong>Naylor</strong><br />
<strong>Road</strong> <strong>Station</strong>—are<br />
heavily traveled. While<br />
Branch Avenue <strong>and</strong><br />
Table 8: <strong>Naylor</strong> <strong>Road</strong> <strong>Station</strong> <strong>Area</strong> <strong>Road</strong>way Characteristics<br />
<strong>Road</strong>way Functional Classification<br />
Travel<br />
Lanes<br />
Speed<br />
Limit Median<br />
Branch Avenue Urban Freeway/Expressway 5 30 L<strong>and</strong>scaped<br />
<strong>Naylor</strong> <strong>Road</strong> Urban Minor Arterial 2 25 L<strong>and</strong>scaped/Center Turn Lane<br />
Suitl<strong>and</strong> Parkway Urban Freeway/Expressway 4 45 L<strong>and</strong>scaped<br />
Source: SHA State Highway Location Reference<br />
Suitl<strong>and</strong> Parkway primarily provide access for regional travelers, <strong>Naylor</strong> <strong>Road</strong> provides more<br />
local access. Table 8 summarizes characteristics of these roadways.<br />
Branch Avenue (MD 5) is primarily a major north-south urban freeway/expressway. Near the<br />
station, however, it functions more as a traditional arterial with a speed limit of 30 miles per<br />
hour <strong>and</strong> several signal-controlled intersections. This segment of Branch Avenue is a five-lane<br />
(three southbound lanes <strong>and</strong> two northbound lanes) divided roadway with multiple access<br />
points to adjacent <strong>com</strong>mercial development.<br />
<strong>Naylor</strong> <strong>Road</strong> (MD 637) is a two-lane Urban Minor Arterial with two traffic circles, each at a<br />
<strong>Naylor</strong> <strong>Road</strong> <strong>Station</strong> area access point (Oxon Run Drive <strong>and</strong> Good Hope Avenue). In Prince<br />
George’s County, <strong>Naylor</strong> <strong>Road</strong> connects Branch Avenue with the District line in an east-west<br />
direction.<br />
25 | Existing <strong>Station</strong> <strong>Area</strong> Characteristics
Figure 29: <strong>Naylor</strong> <strong>Road</strong> (left), Suitl<strong>and</strong> Parkway (right), <strong>and</strong> Branch Avenue (bottom)<br />
Source: Andrew Bossi (Creative Commons)<br />
Figure 30: Average Annual Daily Traffic near<br />
<strong>Naylor</strong> <strong>Road</strong> <strong>Station</strong><br />
Average Annual Daily<br />
Traffic<br />
60,000<br />
50,000<br />
40,000<br />
30,000<br />
20,000<br />
10,000<br />
0<br />
2008 2009 2010<br />
<strong>Naylor</strong> <strong>Road</strong><br />
Branch Avenue (South of <strong>Naylor</strong> <strong>Road</strong>)<br />
Branch Avenue (DC Line)<br />
Source: SHA<br />
Suitl<strong>and</strong> Parkway is owned <strong>and</strong> operated by NPS <strong>and</strong><br />
classified as an urban expressway/freeway. It primarily<br />
serves trips passing through the project area, with access<br />
points at both <strong>Naylor</strong> <strong>Road</strong> (at-grade intersection) <strong>and</strong><br />
Branch Avenue (grade-separated interchange). Suitl<strong>and</strong><br />
Parkway is a barrier to a connected network of local roads.<br />
A large portion of traffic between the District <strong>and</strong> the<br />
County uses the at-grade <strong>Naylor</strong> <strong>Road</strong> intersection because<br />
Southern Avenue is discontinuous between <strong>Naylor</strong> <strong>Road</strong><br />
<strong>and</strong> Branch Avenue. The break in Southern Avenue forces<br />
traffic into Prince George’s County <strong>and</strong> increases congestion<br />
near <strong>Naylor</strong> <strong>Road</strong> <strong>Station</strong>. The system of residential streets<br />
serving the station area is haphazard <strong>and</strong> disconnected.<br />
Figure 30 shows that Branch Avenue’s annual average daily<br />
traffic (AADT) volumes vary considerably between <strong>Naylor</strong> <strong>Road</strong> <strong>and</strong> the District line, as much<br />
of Branch Avenue’s traffic likely turns onto Suitl<strong>and</strong> Parkway or <strong>Naylor</strong> <strong>Road</strong>, <strong>and</strong> to a lesser<br />
extent into <strong>Naylor</strong> <strong>Road</strong> <strong>Station</strong> <strong>and</strong> nearby shopping <strong>and</strong> restaurants.<br />
<strong>Naylor</strong> <strong>Road</strong> <strong>Metro</strong> <strong>Station</strong> <strong>Area</strong> <strong>Access</strong> <strong>and</strong> <strong>Capacity</strong> Study | 26
Crash data, summarized in Table 9 <strong>and</strong> provided by SHA<br />
as recorded by police reports, reveals that Branch Avenue<br />
experiences more collisions than <strong>Naylor</strong> <strong>Road</strong>.<br />
While some of these collisions may be attributed higher<br />
traffic volumes on Branch Avenue, the crash rate (i.e.<br />
typically the number of crashes per million or 100 million<br />
vehicle miles traveled, or VMT) appears <strong>com</strong>paratively high<br />
to <strong>Naylor</strong> <strong>Road</strong>. For year 2008—the only year available for<br />
<strong>com</strong>parison as AADT data is from 2008 to 2010 <strong>and</strong> crash<br />
data is from 2006 to 2008—Branch Avenue’s total crash rate<br />
(420 crashes per 100 million VMT) is more than two times<br />
<strong>Naylor</strong> <strong>Road</strong>’s rate (201 crashes per 100 million VMT), as<br />
Table 9: Crash Data<br />
Crash Type 2006 2007 2008 Total<br />
Branch Avenue (Curtis Drive to Suitl<strong>and</strong> Parkway)<br />
Fatal 0 0 0 0<br />
Injury 21 19 20 60<br />
Property 19 33 15 67<br />
Total 40 52 35 127<br />
<strong>Naylor</strong> <strong>Road</strong> (<strong>Metro</strong>rail tracks to Branch Avenue)<br />
Fatal 0 0 0 0<br />
Injury 3 3 4 10<br />
Property 6 4 2 12<br />
Total 9 7 6 22<br />
Source: SHA<br />
calculated using the Federal Highway Administration’s (FHWA) formula (Appendix 9). Total<br />
collisions dropped on Branch Avenue <strong>and</strong> <strong>Naylor</strong> <strong>Road</strong> between 2006 <strong>and</strong> 2008, though Branch<br />
Avenue property crashes increased greatly in 2007 before dropping in 2008. In contrast to SHA<br />
ranking Prince George’s County first in Maryl<strong>and</strong> in 2008 traffic fatalities, no roadway fatalities<br />
occurred between 2006 <strong>and</strong> 2008 near <strong>Naylor</strong> <strong>Road</strong> <strong>Station</strong>.<br />
Kiss & Ride<br />
The <strong>Naylor</strong> <strong>Road</strong> <strong>Station</strong> Kiss & Ride lot includes a taxi st<strong>and</strong>, 13 A-spaces (15-minute<br />
temporary parking at all times), 42 short-term metered spaces (free 15-minute parking during<br />
peak periods), four Zipcar spaces, four h<strong>and</strong>icap spaces, <strong>and</strong> 10 motorcycle spaces. During<br />
the afternoon peak period, when the greatest incidence of motorists waiting to pick up rail<br />
passengers typically takes place, 55 temporary parking spaces are available (13 A-spaces <strong>and</strong> 42<br />
short-term metered spaces). H<strong>and</strong>icap, motorcycle, <strong>and</strong> Zipcar spaces, as well as the taxi st<strong>and</strong>,<br />
are omitted from any analysis of Kiss & Ride capacity, as they are not available to most motorists<br />
picking up passengers.<br />
Field observations conducted during the afternoon peak period at <strong>Naylor</strong> <strong>Road</strong> <strong>Station</strong> in<br />
August 2011 showed that the average dwell time for vehicles in the Kiss & Ride is approximately<br />
2.7 minutes. Rounding this figure up to three minutes <strong>and</strong> adding a 30-second buffer between<br />
vehicles using the same space yields a capacity of one vehicle per space every 3.5 minutes, or 17<br />
vehicles per hour for each space. Factored by the 55 available spaces, that results in an overall<br />
Kiss & Ride capacity of approximately 935 vehicles per hour. Considering that the station<br />
ridership estimates that the maximum daily Kiss & Ride pickups are approximately 505 (see<br />
Table 4), there is ample capacity to ac<strong>com</strong>modate all users in the Kiss & Ride lot (Figure 32).<br />
Even if all 505 maximum daily pickups occurred in a single hour, the <strong>Naylor</strong> <strong>Road</strong> Kiss & Ride<br />
would only require approximately 30 temporary parking spaces to ac<strong>com</strong>modate dem<strong>and</strong>.<br />
Nevertheless, during field observations congestion was observed to be a problem. The<br />
congestion stemmed from motorists waiting for passengers in areas other than marked spaces,<br />
which illustrates that may people picking up passengers prefer to queue rather than pull into<br />
a parking space. This problem is particularly acute in the curved lane immediately adjacent to<br />
the crosswalk closest to the station entrance (Figure 33). Congestion in this spot is particularly<br />
problematic as it can back up to the entrance of the Kiss & Ride lot.<br />
27 | Existing <strong>Station</strong> <strong>Area</strong> Characteristics
Figure 31: Kiss & Ride Operations<br />
Branch Ave<br />
A-Spaces<br />
Zipcar Spaces<br />
H<strong>and</strong>icap Spaces<br />
Metered Spaces<br />
A-Spaces<br />
Bus Only<br />
Automobile Only<br />
Bus <strong>and</strong> Automobile<br />
Motorcycle Spaces<br />
N<br />
<strong>Naylor</strong> Rd<br />
0 100’<br />
Source: Google Earth (aerial)<br />
Figure 32: Surplus Kiss & Ride Parking <strong>Capacity</strong> during the<br />
Afternoon Peak Period<br />
Figure 33: Kiss & Ride Queuing at the Bus Loop Crosswalk<br />
<strong>Naylor</strong> <strong>Road</strong> <strong>Metro</strong> <strong>Station</strong> <strong>Area</strong> <strong>Access</strong> <strong>and</strong> <strong>Capacity</strong> Study | 28
Park & Ride<br />
<strong>Naylor</strong> <strong>Road</strong> <strong>Station</strong>’s Park & Ride<br />
capacity is relatively small <strong>com</strong>pared<br />
to other southern Green Line stations<br />
in Prince George’s County (Table 10).<br />
The station’s sole Park & Ride surface<br />
lot southwest of the station entrance<br />
has a total of 368 parking spaces, which<br />
includes eight h<strong>and</strong>icap spaces. Parking<br />
costs $4.50 per day, though <strong>Metro</strong>rail<br />
customers may reserve a space for $65<br />
per month in addition to the daily rate.<br />
Dem<strong>and</strong> for parking exceeds available<br />
capacity at <strong>Naylor</strong> <strong>Road</strong> <strong>Station</strong>; <strong>Metro</strong><br />
estimates that weekday utilization of<br />
the station’s Park & Ride lot averages<br />
108 percent (only 80 percent of <strong>Naylor</strong><br />
<strong>Road</strong> Park & Ride transactions are<br />
attributable to registered SmarTrip<br />
cards, with additional transactions from<br />
non-registered cards) <strong>and</strong> often reaches<br />
Table 10: Southern Green Line Park & Ride SmarTrip Data (10/2011)<br />
Total Park<br />
& Ride<br />
Transactions<br />
Transactions<br />
to Registered<br />
SmarTrip Cards<br />
<strong>Station</strong><br />
Park & Ride<br />
Spaces<br />
Percent<br />
Registered<br />
Southern Avenue 1,980 1,630 1,305 80%<br />
<strong>Naylor</strong> <strong>Road</strong> 368 379 302 80%<br />
Suitl<strong>and</strong> 1,890 1,634 1,345 82%<br />
Branch Avenue 3,072 3,067 2,518 82%<br />
Total 7,310 6,710 5,470 82%<br />
Figure 34: Southern Green Line Park & Ride Catchment <strong>Area</strong> (10/2011)<br />
Distance to <strong>Station</strong> from<br />
Residence<br />
45%<br />
40%<br />
35%<br />
30%<br />
25%<br />
20%<br />
15%<br />
10%<br />
5%<br />
0%<br />
< 1 Mile 1 to 2<br />
Miles<br />
Southern Avenue<br />
<strong>Naylor</strong> <strong>Road</strong><br />
Suitl<strong>and</strong><br />
Branch Avenue<br />
2 to 3<br />
Miles<br />
3 to 5<br />
Miles<br />
5 to 10<br />
Miles<br />
capacity by 8:00 AM or earlier. A percentage greater than 100 percent indicates parking turnover<br />
during the day <strong>and</strong> that some motorists used private parking at Legend Nightclub across <strong>Naylor</strong><br />
<strong>Road</strong>, which is now closed. Additional off-site parking near the station remains limited.<br />
Figure 34 summarizes the Park & Ride catchment area of southern Green Line stations using<br />
data from registered SmarTrip cards. Most of <strong>Naylor</strong> <strong>Road</strong> <strong>Station</strong>’s Park & Ride customers<br />
drive relatively short distances <strong>com</strong>pared to other southern Green Line stations. About 57<br />
percent of registered SmarTrip card customers using the Park & Ride drive three miles or less.<br />
For some people, this is a reasonable distance for cycling <strong>and</strong>, if less than 1/2 mile, walking.<br />
Almost 20 percent of registered SmarTrip cardholders who utilize <strong>Naylor</strong> <strong>Road</strong> <strong>Station</strong>’s Park &<br />
Ride drive distances in excess of 10 miles, with some driving beyond 25 miles. Figure 34 shows<br />
that Park & Ride customers at other southern Green Line stations tend to travel longer distances<br />
to the station, particularly those who use Branch Avenue <strong>Station</strong>.<br />
10 to 25<br />
Miles<br />
> 25<br />
Miles<br />
<strong>Station</strong> <strong>Capacity</strong> & Emergency Egress<br />
<strong>Naylor</strong> <strong>Road</strong> <strong>Station</strong> has an elevated, center platform situated above a<br />
ground-level mezzanine with a single entrance between the bus bays<br />
<strong>and</strong> Park & Ride lot. Faregates <strong>and</strong> vending machines are located in the<br />
mezzanine, with a single exitfare machine located inside the paid portion<br />
of the mezzanine (Table 11). One elevator <strong>and</strong> two escalator/stairway pairs<br />
provide access between the mezzanine <strong>and</strong> the station platform.<br />
Table 11: <strong>Naylor</strong> <strong>Road</strong> <strong>Station</strong><br />
Elements<br />
Facility<br />
Quantity<br />
Entrances 1<br />
Faregates 4<br />
Farecard Machines 7<br />
Exitfare Machines 1<br />
Elevators 1<br />
Escalators 2<br />
Stairways 2<br />
29 | Existing <strong>Station</strong> <strong>Area</strong> Characteristics
Table 12: Existing Passenger Circulation Facilities<br />
Element Required Existing<br />
Platform Escalators 2 2<br />
Platform Elevators* 2 1<br />
Faregate Aisles 2 4<br />
Farecard Vendors 1 7<br />
* While only one platform elevator per mezzanine is required<br />
for ADA <strong>com</strong>pliance, current practice by <strong>Metro</strong> is to provide two<br />
platform elevators per mezzanine.<br />
Table 13: 2012 Emergency Egress<br />
NFPA<br />
St<strong>and</strong>ard<br />
Morning<br />
Peak<br />
Afternoon<br />
Peak<br />
Measure (minutes)<br />
Time to clear platform 4.0 3.6 5.2<br />
Time to point of safety 6.0 5.1 6.7<br />
The number of faregates at <strong>Naylor</strong> <strong>Road</strong> <strong>Station</strong> exceeds<br />
the number of required faregates based on observed<br />
ridership (see Table 12). However, faregate queuing<br />
is still <strong>com</strong>monplace during peak periods based on<br />
observations, suggesting additional faregates are needed<br />
to decrease entrance <strong>and</strong> exit times. Two stairways, each<br />
of which is paired with an escalator, provide vertical<br />
capacity beyond the available capacity of the two<br />
escalators. The station falls short of elevator redundancy,<br />
as two per platform are required per current <strong>Metro</strong><br />
practice.<br />
The station partially meets emergency egress st<strong>and</strong>ards<br />
set by the National Fire Protection Association (NFPA)<br />
St<strong>and</strong>ard for Fixed Guideway Transit <strong>and</strong> Passenger Rail<br />
Systems 2007 (NFPA 130), which requires that in an emergency situation the platform can<br />
be cleared of passengers within four minutes <strong>and</strong> that all passengers can reach a point of<br />
safety within six minutes. Evacuation time analysis is based on a worst-case-scenario with<br />
peak-direction trains containing twice the typical number of passengers to simulate a missed<br />
headway. <strong>Metro</strong> uses these guidelines as design goals, not requirements, when modifying<br />
station facilities to increase their emergency safety capabilities.<br />
Table 13 shows that all passengers in the afternoon peak cannot clear the station platform <strong>and</strong><br />
reach a point of safety—in this case, ground level beyond the mezzanine entrance—within the<br />
NFPA st<strong>and</strong>ard. However, emergency egress st<strong>and</strong>ards are met during the morning peak.<br />
Figure 35: <strong>Naylor</strong> <strong>Road</strong> <strong>Station</strong> Elements<br />
<strong>Naylor</strong> <strong>Road</strong> <strong>Metro</strong> <strong>Station</strong> <strong>Area</strong> <strong>Access</strong> <strong>and</strong> <strong>Capacity</strong> Study | 30
Strengths, Weaknesses, Opportunities, <strong>and</strong> Threats<br />
The <strong>Naylor</strong> <strong>Road</strong> Strength, Weakness, Opportunities, <strong>and</strong> Threat (SWOT) analysis summarizes<br />
the most significant findings from the existing conditions survey conducted as part of this<br />
survey. Through the SWOT analysis, the study team determined that, although small in stature,<br />
the station area provides an abundance of strengths <strong>and</strong> opportunities. Table 14 summarizes the<br />
SWOT analysis findings.<br />
The strengths <strong>and</strong> opportunities that make <strong>Naylor</strong> <strong>Road</strong> <strong>Station</strong> ripe for renewed development<br />
are primarily based on its proximity to Washington, DC <strong>and</strong> activity centers in Prince George’s<br />
County, excellent connectivity via rail (three stops to Anacostia, six stops to L’Enfant) <strong>and</strong> bus<br />
(served by eight lines) service, <strong>and</strong> on a groundswell of planning focus on development of<br />
<strong>Naylor</strong> <strong>Road</strong> <strong>and</strong> the other stations of the outer Green Line. Most of the weaknesses identified<br />
center on degraded infrastructure that has suffered from lack of investment in prior years.<br />
The l<strong>and</strong>scape for <strong>Naylor</strong> <strong>Road</strong> is shifting in a direction that promises to covert several of its<br />
weaknesses into strengths. Due to the work already done through the SHA Streetscape Project<br />
<strong>and</strong> the <strong>Metro</strong> Green Line Corridor Action Plan, among other efforts, the opportunity is present for<br />
funding <strong>and</strong> <strong>com</strong>mitment on the local, regional, <strong>and</strong> state levels for infrastructure improvements<br />
around the station <strong>and</strong> high-value TOD.<br />
Table 14: Results of the <strong>Naylor</strong> <strong>Road</strong> <strong>Station</strong> SWOT Analysis<br />
Strengths (S) Weakness (W) Opportunities (O) Threats (T)<br />
• <strong>Metro</strong> service<br />
• Proximity to the District of<br />
Columbia<br />
• Bus service<br />
• State of MD priority TOD site<br />
• Poor pedestrian access<br />
• No dedicated bike access/bike<br />
lanes/bike share<br />
• Poor sidewalk (infrastructure)<br />
conditions<br />
• Funding for infrastructure<br />
improvements<br />
• Redevelopment of Core <strong>Area</strong><br />
• Adjacent underutilized l<strong>and</strong><br />
• Opportunities for mixed-use<br />
• No street lights<br />
• Aging (blighted) retail<br />
• Lack of continuous ADA development<br />
• <strong>Access</strong>ibility <strong>and</strong> visibility<br />
facilities along Branch Avenue<br />
• New access points into station<br />
• Plans for building the trail<br />
network<br />
• Oxon Run Stream Valley Park<br />
• Hillcrest Heights Community<br />
Center<br />
• Lack of pedestrian signals <strong>and</strong><br />
refuse areas<br />
• Limited parking capacity<br />
• Poor signage<br />
• New signage theme <strong>and</strong><br />
wayfinding plan<br />
31 | Existing <strong>Station</strong> <strong>Area</strong> Characteristics
Future <strong>Station</strong> <strong>Area</strong> Characteristics<br />
L<strong>and</strong> Use<br />
The <strong>Naylor</strong> <strong>Road</strong> <strong>Station</strong> area <strong>and</strong> the Hillcrest Heights <strong>com</strong>munity are on the verge of<br />
revitalization <strong>and</strong> redevelopment that will define a sense of place. This vision was established<br />
by the Branch Avenue Corridor Sector Plan, which identified <strong>Naylor</strong> <strong>Road</strong> <strong>Station</strong> as a Regional<br />
Center—a mixed-use regional destination to be <strong>com</strong>prised of <strong>com</strong>mercial, retail, office, <strong>and</strong>/<br />
or institutional development—as a result of its high degree of transit accessibility. This plan<br />
proposes the <strong>com</strong>plete redevelopment of the <strong>Naylor</strong> <strong>Road</strong> <strong>Station</strong>, as well as a significant<br />
Figure 36: Vision for <strong>Naylor</strong> <strong>Road</strong> <strong>Station</strong> <strong>Area</strong> <strong>and</strong> Branch Avenue<br />
Branch Avenue<br />
<strong>Naylor</strong> <strong>Road</strong> <strong>Metro</strong> area<br />
<strong>Naylor</strong> <strong>Road</strong><br />
Illustrative concept of Branch<br />
Avenue redevelopment, showing<br />
possible new building footprints,<br />
streets <strong>and</strong> green spaces for<br />
mixed-use development. This<br />
illustration portrays only one<br />
of many possible long-range<br />
redevelopment scenarios that may<br />
result from implementation of the<br />
re<strong>com</strong>mended l<strong>and</strong> use concept<br />
for this area.<br />
Source: Branch Avenue Corridor Sector Plan<br />
Vision Elements<br />
Five elements frame the vision for the Branch Avenue Corridor sector plan area. The plan<br />
is organized around these elements:<br />
• L<strong>and</strong> Use <strong>and</strong> Economic Development<br />
• Design <strong>and</strong> Appearance<br />
• Infrastructure to Support the Plan<br />
• Quality of Life<br />
• Community Involvement<br />
33 | Future <strong>Station</strong> <strong>Area</strong> Characteristics<br />
L<strong>and</strong> Use <strong>and</strong> Economic Development<br />
The plan guides future uses of l<strong>and</strong> in ways that will promote economic development, encourage<br />
the development of a high-density mix of l<strong>and</strong> uses at <strong>Naylor</strong> <strong>Road</strong> <strong>Metro</strong> <strong>Station</strong>, <strong>and</strong> promote
The core area is where<br />
the highest densities<br />
<strong>and</strong> intensities<br />
are encouraged.<br />
These densities <strong>and</strong><br />
intensities taper off<br />
toward the edge area.<br />
3. Designate properties within the <strong>Naylor</strong> <strong>Road</strong> <strong>Metro</strong> <strong>Station</strong> area, existing <strong>com</strong>mercial<br />
areas along Branch Avenue (including Iverson Mall, the Marlow Heights Shopping<br />
Center), properties on Old Silver Hill <strong>Road</strong>, property north of the intersection of<br />
Branch Avenue <strong>and</strong> St. Barnabas <strong>Road</strong>, <strong>and</strong> properties fronting St. Barnabas <strong>Road</strong><br />
between 28th Avenue <strong>and</strong> Holly Tree <strong>Road</strong> to mixed l<strong>and</strong> use classification.<br />
4. Rezone the area designated for mixed l<strong>and</strong> uses to the Mixed Use-Transportation<br />
Oriented (M-X-T) Zone that will implement the vision <strong>and</strong> goals of the sector<br />
plan, <strong>and</strong> revisit the M-X-T Zone if new mixed-use zoning tools be<strong>com</strong>e available<br />
to efficiently <strong>and</strong> effectively implement the mixed-use, pedestrian- <strong>and</strong> transit–<br />
Figure 37: Core <strong>and</strong> Edge <strong>Area</strong>s oriented Surrounding development <strong>Naylor</strong> pattern re<strong>com</strong>mended <strong>Road</strong> by this portion plan. of properties along <strong>Naylor</strong> <strong>Road</strong> <strong>and</strong><br />
<strong>Station</strong><br />
5. Designate Branch the Avenue, <strong>Naylor</strong> <strong>Road</strong> by transforming the area from<br />
<strong>Metro</strong> an automobile-oriented <strong>Station</strong> Core <strong>Area</strong> (from zone to a high-density,<br />
Suitl<strong>and</strong> Parkway to Curtis Drive)<br />
pedestrian-friendly district, as shown in Figure 36.<br />
as a mixed-use, high-density<br />
residential/office/retail l<strong>and</strong> use<br />
classification to achieve a vertical<br />
<strong>and</strong> The horizontal Sector mix Plan of uses envisions in a <strong>Naylor</strong> <strong>Road</strong> <strong>Station</strong><br />
urban that form, strengthens with emphasis the on existing <strong>com</strong>munity <strong>and</strong><br />
transit-oriented development,<br />
using attracts the following new residents, st<strong>and</strong>ards <strong>and</strong> retail, <strong>and</strong> employment<br />
guidelines: through increased pedestrian <strong>and</strong> bicycle<br />
5.1 connectivity, Provide minimum more density pleasant streetscapes,<br />
improved for residential vehicular development circulation, new parks, <strong>and</strong><br />
at 42 dwelling units per acre.<br />
updated design principles to promote <strong>com</strong>munity<br />
5.2 safety. Use a This floor area vision ratio (FAR) is supported by updated design<br />
range for nonresidential<br />
guidelines development that from address 1.0–2.5. building setbacks, the<br />
streetscape, building height, lighting, <strong>and</strong> other<br />
considerations. High-density development will be<br />
focused north of Curtis Drive. While only a conceptual development plan for the station area has<br />
been defined (Figure 36), the plan’s strategies for the <strong>Naylor</strong> <strong>Road</strong> <strong>Station</strong> “core” area (Figure<br />
37) include development ranging from four to 12 stories, continuous ground floor retail, eightto<br />
20-foot sidewalks, a plaza at the <strong>Naylor</strong> <strong>Road</strong> <strong>and</strong> Branch Avenue intersection, <strong>and</strong> a ban on<br />
“big box” retail. “Edge” areas outside of the redevelopment cores would require lower-density<br />
residential uses with fewer dwellings per acre <strong>and</strong> smaller floor-to-area ratios (FAR). Table 15<br />
highlights the differences between core <strong>and</strong> edge areas by distribution of proposed l<strong>and</strong> uses.<br />
Source: Branch Avenue Corridor Sector Plan<br />
48 Approved Branch Avenue Corridor Sector Plan<br />
<strong>and</strong> Sectional Map Amendment<br />
Further planning for this <strong>and</strong> the other southern Prince George’s County Green Line stations is<br />
currently underway with the <strong>Metro</strong> Green Line Corridor Action Plan, which will define a similar<br />
transit-oriented <strong>and</strong> walkable vision for <strong>Naylor</strong> <strong>Road</strong> <strong>Station</strong> <strong>and</strong> Southern Avenue, Suitl<strong>and</strong>,<br />
<strong>and</strong> Branch Avenue <strong>Station</strong>s.<br />
Joint Development<br />
Prince George’s County has been trying to attract development around its <strong>Metro</strong>rail stations<br />
for years, <strong>and</strong> efforts have recently intensified. The County Executive Office designated the<br />
<strong>Naylor</strong> <strong>Road</strong> <strong>Station</strong> area as a priority for redevelopment. Subsequently, the State of Maryl<strong>and</strong><br />
designated <strong>Naylor</strong> <strong>Road</strong> as a priority TOD site <strong>and</strong> design work for streetscape <strong>and</strong> pedestrian<br />
improvements are on-going. The State’s designation came as a result of the 2008 “TOD Law”<br />
that defines TOD as a “transportation purpose,” meaning MDOT property, personnel, <strong>and</strong><br />
funds, as well as other tools <strong>and</strong> support mechanisms, may be authorized to support TOD<br />
projects throughout the state.<br />
TOD is characterized by a mix of uses within a ½ mile (10-minute) walking distance of a transit<br />
station. Building pedestrian friendly neighborhoods around transit stations provides large<br />
numbers of people with easy access to the transit system as well as connections with other<br />
modes public transportation.<br />
<strong>Metro</strong> has a very active public/private Joint Development Program, which is a creative program<br />
through which property interests owned <strong>and</strong>/or controlled by <strong>Metro</strong> are marketed to private<br />
<strong>Naylor</strong> <strong>Road</strong> <strong>Metro</strong> <strong>Station</strong> <strong>Area</strong> <strong>Access</strong> <strong>and</strong> <strong>Capacity</strong> Study | 34
developers with the objective of developing TOD. <strong>Metro</strong> aggressively seeks partners to develop<br />
<strong>Metro</strong>-owned or controlled property in order to achieve the following goals:<br />
• Promote TOD by giving priority to joint development proposals that contain the following<br />
smart growth strategies:<br />
□□Reduce automobile dependency;<br />
□□Increase pedestrian/bicycle-originated transit trips;<br />
□□Foster safe station areas;<br />
□□Enhance surrounding area connections to transit stations, including bus access;<br />
□□Provide mixed-use development with housing in <strong>com</strong>pliance with local regulations; <strong>and</strong><br />
□□Offer the opportunity to obtain goods <strong>and</strong> services <strong>and</strong> enjoy active public spaces near<br />
transit stations.<br />
• Attract new riders to the transit system by fostering <strong>com</strong>mercial <strong>and</strong> residential<br />
development projects on <strong>Metro</strong>-owned or controlled l<strong>and</strong> <strong>and</strong> on private properties adjacent<br />
to <strong>Metro</strong> stations.<br />
• Create a source of revenue for the Authority to maintain the transit system by expediently<br />
negotiating joint development agreements between <strong>Metro</strong> <strong>and</strong> public or private<br />
development entities.<br />
• Assist <strong>Metro</strong> local area jurisdictions in recapturing a portion of their past financial<br />
contributions <strong>and</strong> continuing to make subsidy payments by augmenting the local property<br />
tax base, as well as other local revenue.<br />
The development of these cohesive neighborhoods not only supports transit but illustrates how<br />
transit can support l<strong>and</strong>-use planning. The design, configuration, diversity, <strong>and</strong> intensity of uses<br />
emphasize a pedestrian-oriented environment <strong>and</strong> makes transit use more convenient. These<br />
neighborhoods ideally include retail, office, open space, <strong>and</strong> <strong>com</strong>munity uses, <strong>and</strong> provide<br />
residents with a sense of place. Joint development supports these goals by providing a focal<br />
point for residential, retail, <strong>and</strong> employment growth within existing urban service areas. The<br />
provision of high frequency rail <strong>and</strong> bus transit at <strong>Metro</strong> stations helps to relieve congestion<br />
on local roadways. In short, joint development is a business approach to public transportation,<br />
incorporating real estate development to generate revenue, <strong>and</strong> provide benefits to transit<br />
system users.<br />
At <strong>Naylor</strong> <strong>Road</strong> <strong>Station</strong>, such a project may require the assembly of additional properties in the<br />
area between <strong>Naylor</strong> <strong>Road</strong>, Branch Avenue, <strong>and</strong> the <strong>Metro</strong>rail tracks (Figure 38). This 10.7-acre<br />
triangular piece of l<strong>and</strong> includes station property<br />
owned by <strong>Metro</strong> <strong>and</strong> <strong>com</strong>mercial buildings with<br />
various property owners. The Branch Avenue<br />
Sector Plan identified this area for redevelopment.<br />
Redevelopment opportunities for small-scale<br />
office <strong>and</strong> retail can be found near this station that<br />
serves the local single- <strong>and</strong> multifamily residential<br />
<strong>com</strong>munity nearby. Appropriate zoning <strong>and</strong><br />
Table 15: Core <strong>and</strong> Edge <strong>Area</strong> L<strong>and</strong> Use Distribution<br />
Requested Distribution<br />
Proposed L<strong>and</strong> Use Type Core <strong>Area</strong>s Edge <strong>Area</strong>s<br />
Residential 20% to 60% 40% to 70%<br />
Retail <strong>and</strong> services 10% to 40% 10% to 40%<br />
Office 20% to 60% 10% to 40%<br />
Public/quasi-public uses 10% to 20% 10% to 20%<br />
Source: Branch Avenue Corridor Sector Plan<br />
35 | Future <strong>Station</strong> <strong>Area</strong> Characteristics
guidelines are in place to encourage well-designed development, as evidenced by the mixed-use,<br />
pedestrian-friendly vision for the station area shown in Figure 36.<br />
The Branch Avenue Corridor Sector Plan’s residential market analysis, which used Census<br />
<strong>and</strong> other economic data ranging from 1990 to 2006, concluded that the corridor “can support<br />
more owner-occupied condominiums <strong>and</strong> townhome development, with most residential<br />
redevelopment opportunities existing at <strong>Naylor</strong> <strong>Road</strong> <strong>Station</strong>.” The analysis concluded that the<br />
retail market is underserved <strong>and</strong> that “the primary market area with its household in<strong>com</strong>e could<br />
support full-service grocers, full-service drug stores, sit-down restaurants, a mid-size furniture<br />
store, a mid-sized sporting goods store, miscellaneous store retailers, <strong>and</strong> general merch<strong>and</strong>isers<br />
Figure 38: Property Required for Joint Development<br />
Suitl<strong>and</strong> Pkwy<br />
<strong>Metro</strong> Property<br />
Other Property<br />
<strong>Station</strong> Entrance<br />
N<br />
0 250’<br />
Branch Ave<br />
Oxon Run Dr<br />
Good Hope Ave<br />
<strong>Naylor</strong> Rd<br />
Source: Google Earth (aerial)<br />
<strong>Naylor</strong> <strong>Road</strong> <strong>Metro</strong> <strong>Station</strong> <strong>Area</strong> <strong>Access</strong> <strong>and</strong> <strong>Capacity</strong> Study | 36
over the next ten years.” In addition, “the<br />
corridor could support modest additional<br />
growth for neighborhood-servicing offices as the<br />
trade area population <strong>and</strong> in<strong>com</strong>e continue to<br />
grow.” The Branch Avenue Corridor Sector Plan<br />
was published in September 2008.<br />
Parking should be carefully managed at the<br />
redeveloped site. The goal is to limit the number<br />
of parking spaces <strong>and</strong> encourage shared<br />
parking between different l<strong>and</strong> uses that need<br />
it at different times of day or at different times<br />
of the week. Offices, for example, typically<br />
need parking during weekdays, while retail<br />
<strong>and</strong> entertainment venues more likely need it<br />
evenings or on weekends.<br />
Figure 39: Estimated Growth in Passenger Entries at <strong>Naylor</strong><br />
<strong>Road</strong> <strong>Station</strong><br />
4,500<br />
4,017<br />
4,000<br />
2012<br />
3,500<br />
2040<br />
3,160<br />
3,004<br />
3,000<br />
2,500<br />
2,222<br />
2,000<br />
1,500<br />
1,000<br />
938 1,013<br />
500<br />
0<br />
Daily Peak Off Peak<br />
Source: MWCOG travel dem<strong>and</strong> model<br />
Entries<br />
Ridership<br />
The study team used the MWCOG travel dem<strong>and</strong> model, updated for the Purple Line project<br />
to meet Federal Transit Administration (FTA) requirements, to estimate <strong>Metro</strong>rail ridership<br />
<strong>and</strong> mode share at <strong>Naylor</strong> <strong>Road</strong> <strong>Station</strong> in 2040. An advantage of using the travel dem<strong>and</strong><br />
model to estimate future growth is that it accounts for the change in person trip patterns from<br />
demographic change <strong>and</strong> it accounts for effects of constrained parking on station dem<strong>and</strong>.<br />
The estimates are based on year 2040 of the Round 8.0 of the Cooperative Forecasts. The<br />
forecasts for <strong>Naylor</strong> <strong>Road</strong> <strong>Station</strong> area show an overall population increase of two percent <strong>and</strong><br />
an employment increase of 23 percent, reflecting the expected redevelopment of the station<br />
area into an office <strong>and</strong> <strong>com</strong>mercial regional center (Table 16). As shown in Figure 39, the model<br />
Table 16: 2010 to 2040 Population <strong>and</strong> Employment Growth<br />
2010 2040 2010 to 2040 Change<br />
2010 to 2040<br />
Percent Change<br />
Household<br />
Population<br />
Employment<br />
Household<br />
Population<br />
TAZ* Jurisdiction<br />
301 DC 2,240 5,297 544 2,637 6,135 577 397 838 33 18% 16% 6%<br />
302 DC 1,127 2,095 68 1,172 2,179 70 45 84 2 4% 4% 3%<br />
District Total 3,367 7,392 612 3,809 8,314 647 442 922 35 13% 12% 6%<br />
751 MD 683 1,648 3,608 664 1,575 4,244 -19 -73 636 1% -3% 25%<br />
757 MD 1,817 4,526 1,146 1,814 4,369 1,272 -3 -157 126 0% -3% 11%<br />
769 MD 1,232 3,201 1,219 1,246 3,098 1,426 14 -103 207 1% -3% 17%<br />
770 MD 2,097 5,112 95 2,080 4,931 602 -17 -181 507 -1% -4% 534%<br />
Maryl<strong>and</strong> Total 5,829 14,487 6,068 5,804 13,973 7,544 -25 -514 1,476 0% -4% 24%<br />
<strong>Naylor</strong> <strong>Road</strong> Total 9,196 21,879 6,680 9,613 22,287 8,191 417 408 1,511 5% 2% 23%<br />
Source: MWCOG Round 8.0 Cooperative Forecasts<br />
*TAZ identification numbers correspond to the 2,191-TAZ regional division<br />
Employment<br />
Household<br />
Population<br />
Employment<br />
Household<br />
Population<br />
Employment<br />
37 | Future <strong>Station</strong> <strong>Area</strong> Characteristics
estimates a 35-percent increase in peak period <strong>Metro</strong>rail entries <strong>and</strong> an eight-percent increase in<br />
off-peak entries between 2012 <strong>and</strong> 2040, resulting in a total daily increase of 27 percent. Most of<br />
the growth in <strong>Naylor</strong> <strong>Road</strong> <strong>Station</strong> entries is concentrated in the peak period. This is consistent<br />
with the redevelopment vision for the station area that emphasizes high-density office in the<br />
immediate <strong>Naylor</strong> <strong>Road</strong> <strong>Station</strong> area, which will increase peak-period <strong>com</strong>muting.<br />
<strong>Station</strong> <strong>Access</strong><br />
With the transformation of the <strong>Naylor</strong> <strong>Road</strong> <strong>Station</strong> area from an automobile-oriented transit<br />
center to a regional center of mixed-use TOD, how people access the station will change by 2040.<br />
The travel dem<strong>and</strong> model results, shown in Table 17, are expressed as percent changes in mode<br />
share from 2012 to 2040. The model estimated mode share changes for the peak <strong>and</strong> off-peak<br />
periods; when <strong>com</strong>bined these periods account for a typical weekday. Results are shown for<br />
these three periods—peak periods, off-peak periods, <strong>and</strong> all day—to provide a clearer picture of<br />
how ridership is estimated to change. The last two rows of Table 17 show the before-<strong>and</strong>-after<br />
snapshot of weekday station access.<br />
As would be expected from a wholesale l<strong>and</strong> use transformation that emphasizes walking <strong>and</strong><br />
cycling, the model estimated that nonmotorized access will grow significantly by 2040, owing<br />
to the expected concentration of employment <strong>and</strong> retail adjacent to the station entrance as well<br />
proximity to new high-density residential along Branch Avenue <strong>and</strong> <strong>Naylor</strong> <strong>Road</strong>. The model<br />
did not separate walking <strong>and</strong> bicycle trips, but pedestrians will likely <strong>com</strong>prise the vast majority<br />
of these trips as <strong>Metro</strong>’s bicycle access target for <strong>Naylor</strong> <strong>Road</strong> <strong>Station</strong> is one percent.<br />
The model estimated a decline in automobile access as a percent of daily mode share,<br />
particularly Kiss & Ride access. This is likely due to the changing demographics of station area<br />
TAZs, a key input into the model. The model results are consistent with the likely future for<br />
<strong>Naylor</strong> <strong>Road</strong> <strong>Station</strong> based on previous studies. As a result of a future joint development, the<br />
existing Park & Ride lot could be removed or consolidated into a multi-level garage. Similarly,<br />
the Kiss & Ride function will need to be incorporated into the new development.<br />
The model’s initial results showed flat or negative bus ridership growth to the station. However,<br />
the purpose of this study is to ensure adequate future access capacity for all modes, <strong>and</strong> as<br />
such a conservative approach would be to plan for some increase in bus access facility needs.<br />
To ensure that adequate bus capacity is considered, this study assumes bus ridership to <strong>Naylor</strong><br />
Table 17: 2040 Estimated Weekday Mode Share for <strong>Naylor</strong><br />
<strong>Road</strong> <strong>Station</strong><br />
Period<br />
Park &<br />
Ride<br />
Kiss &<br />
Ride Bus<br />
Walk/<br />
Bike Total<br />
Weekday Mode Share Change from 2012 to 2040*<br />
Peak Periods -3% -49% 35% 39% 35%<br />
Off-Peak Periods 167% -75% 8% 294% 8%<br />
All day 12% -56% 30% 92% 27%<br />
Weekday Mode Share<br />
2012 23% 12% 46% 19% 100%<br />
2040 20% 4% 47% 29% 100%<br />
* Rounded to the nearest whole number<br />
<strong>Road</strong> <strong>Station</strong> will grow similarly to the<br />
station’s <strong>Metro</strong>rail entries (35 percent during<br />
peak periods <strong>and</strong> eight percent during off-peak<br />
periods). As residential densities increase near<br />
the station <strong>and</strong> along Branch Avenue, bus<br />
ridership can be expected to similarly increase.<br />
This study also included a separate analysis to<br />
estimate future access needs for private shuttles<br />
(i.e. non-<strong>Metro</strong> <strong>and</strong> non-county services that<br />
typically serve offices, apartments, hospitals,<br />
<strong>Naylor</strong> <strong>Road</strong> <strong>Metro</strong> <strong>Station</strong> <strong>Area</strong> <strong>Access</strong> <strong>and</strong> <strong>Capacity</strong> Study | 38
educational centers, auto dealers, <strong>and</strong> hotels). The shuttle analysis methodology, developed<br />
initially for <strong>Metro</strong>’s Shuttle Services at <strong>Metro</strong> Facilities study, is based on the premise that factors<br />
contributing to the decision to offer shuttle services will continue into the future <strong>and</strong> that the<br />
number of shuttle trips to any particular <strong>Metro</strong>rail station is reasonably related to demographic<br />
variables in the surrounding area. Put more simply, estimating future shuttle trips is a function<br />
of how many shuttles exist at the station now <strong>and</strong> how l<strong>and</strong> use, households, <strong>and</strong> employment<br />
around the station will change by 2040.<br />
Employing this methodology was not feasible for <strong>Naylor</strong> <strong>Road</strong> <strong>Station</strong> because no shuttles<br />
currently serve it. Therefore, future shuttle trips to the station were estimated using relationships<br />
between shuttles, distance from <strong>Metro</strong>rail stations, <strong>and</strong> household <strong>and</strong> employment densities<br />
throughout the Washington region, as observed during the development of the Shuttle Services at<br />
<strong>Metro</strong> Facilities study. More detail on these relationships is provided in the Appendix. Planning<br />
for up to three shuttle trips per hour during peak periods in 2040 is a reasonable, conservative<br />
assumption given the available data.<br />
Traffic<br />
The SHA Streetscape Project plans to physically transform Branch Avenue <strong>and</strong> <strong>Naylor</strong> into<br />
urban boulevards to support TOD <strong>and</strong> multimodal mobility in the <strong>Naylor</strong> <strong>Road</strong> <strong>Station</strong> area<br />
<strong>and</strong> farther south along Branch Avenue, as envisioned in the Branch Avenue Corridor Sector<br />
Plan. A key study goal is to calm speeding, weaving, <strong>and</strong> congestion on Branch Avenue <strong>and</strong><br />
<strong>Naylor</strong> <strong>Road</strong> while maintaining capacity. The plan re<strong>com</strong>mends a 120- to 150-foot rightof-way<br />
for Branch Avenue <strong>and</strong> a 120-foot right-of-way for <strong>Naylor</strong> <strong>Road</strong>. The additional ROW<br />
will ac<strong>com</strong>modate streetscape elements such as on-street bicycle lanes, wider sidewalks, high<br />
visibility crosswalks, pedestrian refuges, driveway consolidation, driveway apron crossings,<br />
sidewalk bump-outs, on-street parking, pedestrian signals, retimed traffic signals, <strong>and</strong> roadway<br />
restriping <strong>and</strong> resurfacing. Proposed pedestrian <strong>and</strong> bicycle improvements to these roadways<br />
Concept 2 - Hybrid<br />
will be paired with traffic calming measures to make these <strong>com</strong>muter roadways accessible to<br />
all users, slow down drivers, <strong>and</strong> improve safety for everyone. The proposed roadway designs,<br />
shown in Figure 40, are inspired by the Branch Avenue Corridor Sector Plan. Construction is<br />
anticipated to begin in 2014, though a funding source has not been identified.<br />
Concept 2 - Hybrid<br />
Figure 40: Current Concept for Branch Avenue (left) <strong>and</strong> <strong>Naylor</strong> <strong>Road</strong> (right)<br />
Source: MD 5 (Branch Avenue) <strong>and</strong> MD 637 (<strong>Naylor</strong> <strong>Road</strong>) Streetscape Improvements<br />
39 | Future <strong>Station</strong> <strong>Area</strong> Characteristics
Future <strong>Station</strong> <strong>Access</strong> Needs<br />
The <strong>Naylor</strong> <strong>Road</strong> <strong>Station</strong> area is expected to undergo a wholesale transformation from an<br />
auto-centric transit station to a mixed-use, transit-oriented regional center with high-density<br />
housing, offices, <strong>and</strong> retail. Realizing this vision will take years, <strong>and</strong> this redevelopment process<br />
is just now beginning through <strong>com</strong>pleted or in-process planning studies tasked with improving<br />
the station area <strong>and</strong> its multimodal access. This report uses information <strong>and</strong> findings from<br />
these studies as well as additional station observations <strong>and</strong> analyses to define station access<br />
deficiencies <strong>and</strong> opportunities for improvement—or more simply, station access “needs.”<br />
Needs highlighted in this section are grouped by mode of access. The next section, <strong>Station</strong><br />
Re<strong>com</strong>mendations, summarizes re<strong>com</strong>mendations proposed in response to these defined needs.<br />
Pedestrian<br />
Twenty-nine percent more pedestrians <strong>and</strong> cyclists are estimated to access <strong>Naylor</strong> <strong>Road</strong><br />
<strong>Station</strong> by 2040 <strong>com</strong>pared to 2012, with pedestrians making up almost all of the increase.<br />
Comprehensive redevelopment of the station area would significantly contribute to this<br />
increase in walking trips. TOD near the station is planned to greatly improve the pedestrian<br />
experience through the use of <strong>com</strong>plete street <strong>and</strong> placemaking principles. Until then, the station<br />
area remains automobile-oriented <strong>and</strong> in some cases inhospitable to pedestrians. Pedestrian<br />
infrastructure within <strong>and</strong> surrounding the <strong>Naylor</strong> <strong>Road</strong> <strong>Station</strong> area is lacking in many, but not<br />
all, respects, <strong>and</strong> it will need to be improved to not only facilitate the anticipated increase in<br />
pedestrians by 2040 but also ac<strong>com</strong>modate the many pedestrians who access the station now.<br />
The following pedestrian needs result from the existing station area configuration.<br />
Desired <strong>Access</strong> Points<br />
Despite its large footprint, pedestrian access to <strong>Naylor</strong> <strong>Road</strong> <strong>Station</strong> is limited as much of the<br />
automobile-oriented station area is protected by a fence capped with barbed wire. Pedestrians<br />
have created impromptu access points to reach the station entrance more quickly or to save time<br />
when walking to nearby locations. Impromptu access points are located along pedestrian desire<br />
lines <strong>and</strong> are characterized by worn, dirt pathways where from frequent use.<br />
Figure 41 highlights the location of three observed desire lines: the northwest corner of the<br />
Park & Ride lot, the Oxon Run Drive station entrance, <strong>and</strong> the Branch Avenue station entrance.<br />
Worn pathways are important indicators of where the pedestrian infrastructure is not meeting<br />
the needs of the walking public, <strong>and</strong> where targeted improvements are likely to have a positive<br />
impact.<br />
Safe Pedestrian Crossings<br />
Figure 17, shown previously in Existing <strong>Station</strong> <strong>Area</strong> Characteristics, shows pedestrian crossing<br />
issues that are in need of improvement. Crosswalks <strong>and</strong> pedestrian signals are missing at several<br />
intersections where pedestrians frequently travel. Signal cycles along Branch Avenue are long<br />
41 | Future <strong>Station</strong> <strong>Access</strong> Needs
due to heavy vehicle traffic, inconveniencing pedestrians. Some pedestrians cross Branch Avenue<br />
at dangerous midblock locations to avoid waiting; midblock crossings are also the result of the<br />
station area’s superblock street network, which provides minimal safe crossing opportunities.<br />
Several study-area intersections have large turning radii, which allow motorists to turn at high<br />
speeds.<br />
Figure 41: Pedestrian <strong>Access</strong> Issues<br />
Suitl<strong>and</strong> Pkwy<br />
Branch Ave<br />
Oxon Run Dr<br />
Good Hope Ave<br />
<strong>Naylor</strong> Rd<br />
Authorized Pedestrian <strong>Access</strong><br />
Observed Desire Lines<br />
Fence<br />
<strong>Station</strong> Entrance<br />
<strong>Naylor</strong> Rd<br />
N<br />
0 250’<br />
Source: Google Earth (aerial)<br />
Figure 42: Narrow Sidewalks on Branch Avenue between Suitl<strong>and</strong> Parkway <strong>and</strong> <strong>Naylor</strong> <strong>Road</strong><br />
<strong>Naylor</strong> <strong>Road</strong> <strong>Metro</strong> <strong>Station</strong> <strong>Area</strong> <strong>Access</strong> <strong>and</strong> <strong>Capacity</strong> Study | 42
Comprehensive Sidewalk Coverage<br />
Large gaps exist in sidewalk coverage near <strong>Naylor</strong> <strong>Road</strong> <strong>Station</strong>. As shown in Figure 43, Branch<br />
Avenue, <strong>Naylor</strong> <strong>Road</strong>, <strong>and</strong> Oxon Run Drive—the most direct pedestrian routes to <strong>and</strong> from the<br />
station—are missing sidewalks. The sidewalk on the west side of Branch Avenue is narrow <strong>and</strong><br />
lacks a vegetated buffer between it <strong>and</strong> the busy street, resulting in an un<strong>com</strong>fortable pedestrian<br />
environment. The sidewalk on Oxon Run Drive is narrow as well.<br />
Wayfinding Signage<br />
Wayfinding signage is limited for pedestrians <strong>and</strong> cyclists. As the station area <strong>and</strong> Branch<br />
Avenue corridor are redeveloped into mixed-use <strong>com</strong>munities, more visitors <strong>and</strong> daytime<br />
office workers who are not as familiar with the area as residents will use <strong>Naylor</strong> <strong>Road</strong> <strong>Station</strong>.<br />
Wayfinding signage is needed to direct these pedestrians along efficient <strong>and</strong> safe pathways to<br />
<strong>and</strong> from the station.<br />
Figure 43: Sidewalk Issues<br />
Suitl<strong>and</strong> Pkwy<br />
Missing Sidewalks<br />
Narrow Sidewalks<br />
<strong>Station</strong> Entrance<br />
<strong>Naylor</strong> Rd<br />
N<br />
0 250’<br />
Oxon Run Dr<br />
Branch Ave<br />
<strong>Naylor</strong> Rd<br />
Good Hope Ave<br />
Source: Google Earth (aerial)<br />
43 | Future <strong>Station</strong> <strong>Access</strong> Needs
Table 18: Estimated Bicycle Parking Needed by<br />
2040<br />
Bicycle Parking Spaces<br />
Existing* Needed Difference Growth<br />
24 32 8 33.3%<br />
* Assumes two spaces per rack <strong>and</strong> one space per locker<br />
Figure 44: Example Bicycle Wayfinding Sign<br />
Source: Erica M. (Creative Commons)<br />
Bicycle<br />
<strong>Metro</strong> is encouraging bicycle access to <strong>Metro</strong>rail stations with<br />
targeted improvements, demonstration projects, <strong>and</strong> updated<br />
policies <strong>and</strong> goals, including a systemwide average bicycle<br />
mode share goal of 3.5 percent of passengers arriving in the<br />
morning peak by 2030. As this systemwide goal is an average<br />
across all stations, some stations will have higher or lower<br />
goals based on existing ridership. The bicycle mode share<br />
goal for <strong>Naylor</strong> <strong>Road</strong> <strong>Station</strong>, for example, is one percent, or<br />
32 cyclists in the morning peak based on <strong>Metro</strong>’s projections.<br />
Achieving this goal will require <strong>Metro</strong> <strong>and</strong> local jurisdictions<br />
to address the following needs.<br />
Bicycle Connectivity to Surrounding<br />
Communities<br />
No bicycle lanes or designated pathways connect the<br />
surrounding <strong>com</strong>munities to <strong>Naylor</strong> <strong>Road</strong> <strong>Station</strong>, <strong>and</strong> both<br />
<strong>Naylor</strong> <strong>Road</strong> <strong>and</strong> Branch Avenue are challenging for cyclists<br />
due to narrow lanes <strong>and</strong> heavy traffic volumes. A lack of<br />
such bicycle facilities, as well as the busy primary roadways<br />
surrounding the station area, likely contributes to the low<br />
number of cyclists accessing the station. Direct bicycle<br />
facilities are needed to safely <strong>and</strong> <strong>com</strong>fortably guide cyclists<br />
of all abilities to the station.<br />
Additional Bicycle Parking<br />
<strong>Metro</strong>’s goal is to increase bicycle mode share of all customers accessing the station. <strong>Metro</strong><br />
estimates that <strong>Naylor</strong> <strong>Road</strong> <strong>Station</strong> will need 32 total bicycle parking spaces to meet this goal by<br />
2030, an increase of 33 percent beyond present bicycle parking capacity (Table 18).<br />
Wayfinding Signage<br />
Wayfinding signage is limited for pedestrians <strong>and</strong> cyclists. As bicycle lanes <strong>and</strong> shared-use trails<br />
are implemented in the following years, wayfinding signage is needed to direct cyclists along<br />
safe paths to <strong>Naylor</strong> <strong>Road</strong> <strong>Station</strong>.<br />
Bus<br />
This study assumes a 35-percent increase in peak-period bus boardings at <strong>Naylor</strong> <strong>Road</strong> <strong>Station</strong><br />
by 2040. When this assumption is applied on a line-by-line basis for all routes serving <strong>Naylor</strong><br />
<strong>Road</strong> station, the overall level of service increases from 25 to 33 buses per hour in the peak<br />
periods. This increase in <strong>Naylor</strong> <strong>Road</strong> <strong>Station</strong> bus activity, when measured against bus dwell<br />
times at <strong>Naylor</strong> <strong>Road</strong>, results in an increase in the total number of needed bays from six to<br />
seven, still below the existing eight bays (Table 19). Thus, future bus service increases assumed<br />
in this study will not necessitate additional bus bay capacity beyond what is currently available.<br />
However, present <strong>and</strong> future conditions at <strong>Naylor</strong> <strong>Road</strong> <strong>Station</strong> present some opportunities to<br />
improve bus operations.<br />
<strong>Naylor</strong> <strong>Road</strong> <strong>Metro</strong> <strong>Station</strong> <strong>Area</strong> <strong>Access</strong> <strong>and</strong> <strong>Capacity</strong> Study | 44
Bus Stop <strong>Access</strong> <strong>and</strong><br />
Amenities<br />
Some bus stops near <strong>Naylor</strong> <strong>Road</strong><br />
<strong>Station</strong> lack passenger amenities <strong>and</strong><br />
lack adequate access for disabled<br />
passengers. <strong>Metro</strong>’s Guidelines: Design<br />
<strong>and</strong> Placement of Transit Stops defines<br />
the type of amenities suggested for<br />
each of three bus stops types (basic<br />
stop, enhanced service bus stop, <strong>and</strong><br />
transit center). Bus stops near <strong>Naylor</strong><br />
<strong>Road</strong> <strong>Station</strong> are classified as basic<br />
stops. The guidelines suggest the following elements for basic stops: a bus stop sign, a 5’ x<br />
8’ concrete pad that <strong>com</strong>plies with the Americans with Disabilities Act of 1990 <strong>Access</strong>ibility<br />
Guidelines (ADAAG), an adjacent four-foot-wide sidewalk, an information case that contains<br />
a detailed schedule, <strong>and</strong> a NextBus phone number sign for up-to-date arrival information.<br />
Basic stops with higher ridership qualify for shelters <strong>and</strong> benches at 50 or more boardings per<br />
day, while lighting is only needed at stops with evening service. Prince George’s County has<br />
established st<strong>and</strong>ards for bus stop amenities as well. For example, shelters are suggested for<br />
stops that exceed 100 boardings per day or 20 boardings per hour, are located within 1/4-mile<br />
from a major trip generator, <strong>and</strong> serves two or more bus routes. Prince George’s County’s bus<br />
stop guidelines state that stops should be located within 100 feet of curb cuts to allow access by<br />
disabled passengers.<br />
Bus Delay at <strong>Naylor</strong> <strong>Road</strong> Roundabouts<br />
Bus drivers have <strong>com</strong>plained that the <strong>Naylor</strong> <strong>Road</strong> roundabouts do not provide adequate<br />
gaps in traffic during peak periods. Roundabouts are only controlled by yield signs <strong>and</strong> not<br />
traffic signals. As most vehicles travel through these roundabouts on <strong>Naylor</strong> <strong>Road</strong> during peak<br />
periods, opportunities to turn onto <strong>Naylor</strong> <strong>Road</strong> from the bus bay access point or Oxon Run<br />
Drive during the busiest times are limited.<br />
Separate Bus Bay <strong>and</strong> Kiss & Ride <strong>Access</strong> Points<br />
<strong>Naylor</strong> <strong>Road</strong> <strong>Station</strong> was designed with shared access to the bus bays <strong>and</strong> Kiss & Ride parking<br />
lot, as shown previously in Figure 31. Buses <strong>and</strong> automobiles, particularly when accessing the<br />
station area from <strong>Naylor</strong> <strong>Road</strong>, share roadway<br />
space, introducing conflicting travel patterns<br />
between the modes <strong>and</strong> potentially delaying buses<br />
trying to exit the station. <strong>Metro</strong>’s <strong>Station</strong> Site <strong>and</strong><br />
<strong>Access</strong> Planning Manual states that separate modes<br />
should be provided if feasible. The manual further<br />
states that “bus traffic should be separate from<br />
automobile traffic wherever possible.” Expected<br />
redevelopment of the <strong>Naylor</strong> <strong>Road</strong> <strong>Station</strong> area<br />
will provide an opportunity to redesign these<br />
facilities <strong>and</strong> separate their entrances <strong>and</strong> exits.<br />
Table 19: Estimated Bus Bay Needs in 2012 & 2040<br />
Bus Lines<br />
2012 2040<br />
Serving <strong>Naylor</strong><br />
<strong>Road</strong> <strong>Station</strong><br />
Peak Hour<br />
Buses/Hour<br />
Bus Bays<br />
Required<br />
Peak Hour<br />
Buses/Hour<br />
Bus Bays<br />
Required<br />
M2 3 0.4 4 0.5<br />
F14 2 0.3 3 0.5<br />
H11/12/13 4 0.7 5 0.9<br />
C12/C14 2.4 0.4 3 0.5<br />
36 4 0.9 5 1.2<br />
39 4 0.3 5 0.4<br />
34 4 0.7 5 0.8<br />
TB32 2 0.4 3 0.7<br />
Total 25 6.0 33 7.0<br />
Figure 45: Combined Bus Bay <strong>and</strong> Kiss & Ride <strong>Access</strong> Point<br />
45 | Future <strong>Station</strong> <strong>Access</strong> Needs
Shuttles<br />
No private shuttle services access <strong>Naylor</strong> <strong>Road</strong> <strong>Station</strong>. This study estimates between three<br />
to five shuttles may serve the station by 2040 based on expected changes in population <strong>and</strong><br />
employment density in the surrounding <strong>com</strong>munities. Private shuttles can provide a vital<br />
service for <strong>Metro</strong>rail passengers <strong>and</strong> should be ac<strong>com</strong>modated where possible.<br />
Guidelines in <strong>Metro</strong>’s <strong>Station</strong> Site <strong>and</strong> <strong>Access</strong> Planning Manual re<strong>com</strong>mend one curbside shuttle<br />
space for every 10 vehicle parking spaces in a station Kiss & Ride. The <strong>Naylor</strong> <strong>Road</strong> Kiss & Ride<br />
lot provides no dedicated space for shuttle services as currently configured. Despite relatively<br />
low future shuttle utilization <strong>com</strong>pared to other <strong>Metro</strong>rail stations, small shuttle services need<br />
dedicated space to improve Kiss & Ride operations <strong>and</strong> formalize their presence. Conversely,<br />
large shuttles are better served by station bus bays. Shuttles that intend to use a bus bay instead<br />
of the Kiss & Ride must first apply for permission to do so from <strong>Metro</strong>.<br />
Kiss & Ride<br />
Vehicle Delay at <strong>Naylor</strong> <strong>Road</strong> Roundabout<br />
As with bus drivers, motorists who are exiting the Kiss & Ride at the <strong>Naylor</strong> <strong>Road</strong> roundabout<br />
often have difficulty turning onto <strong>Naylor</strong> <strong>Road</strong> during peak periods. As most vehicles travel<br />
through this roundabout, opportunities to turn onto <strong>Naylor</strong> <strong>Road</strong> can be limited during the<br />
busiest times of day.<br />
Separate Bus Bay <strong>and</strong> Kiss & Ride <strong>Access</strong> Points<br />
As mentioned previously, <strong>Naylor</strong> <strong>Road</strong> <strong>Station</strong>’s Kiss & Ride <strong>and</strong> bus bay access points are<br />
shared. Entering the Kiss & Ride from Branch Avenue can be particularly confusing for motorists<br />
as the driveway fairly quickly diverges into two pathways, one for the bus bays <strong>and</strong> the other for<br />
the Kiss & Ride, <strong>and</strong> the proper path is not well marked. Motorists often erroneously enter the<br />
bus bay facility from this entrance, <strong>and</strong>, as a result, must make a <strong>com</strong>plete loop around the Kiss<br />
& Ride to correctly enter. These shared access points create potential safety conflicts between<br />
buses <strong>and</strong> automobiles, <strong>and</strong> shared exits mean buses may be slowed by Kiss & Ride traffic.<br />
Kiss & Ride Congestion<br />
Like other Kiss & Rides in the <strong>Metro</strong>rail system, a portion of Kiss & Ride customers at <strong>Naylor</strong><br />
<strong>Road</strong> <strong>Station</strong> do not utilize temporary parking spaces <strong>and</strong> instead prefer to wait for passengers<br />
as close to the station entrance as possible. These motorists can queue along the curb near the<br />
station entrance crosswalk. Due to the limited space along the curb, congestion in this location<br />
is problematic as vehicles can back up to the Kiss & Ride entrance, which can impact bus<br />
operations. An improvement is needed in the short-term to alleviate congestion <strong>and</strong> resulting<br />
potential bus/automobile conflicts.<br />
Long-term improvements are needed as well, as the <strong>Naylor</strong> <strong>Road</strong> <strong>Station</strong> Kiss & Ride would<br />
likely be redesigned as part of a station area redevelopment. <strong>Station</strong> observations revealed<br />
that most of the 55 temporary parking spaces (A-spaces <strong>and</strong> metered spaces) go unused, even<br />
during the afternoon peak period. To estimate a conservative, maximum number of temporary<br />
parking spaces needed for a future Kiss & Ride facility, this study utilized <strong>Naylor</strong> <strong>Road</strong> <strong>Station</strong>’s<br />
<strong>Naylor</strong> <strong>Road</strong> <strong>Metro</strong> <strong>Station</strong> <strong>Area</strong> <strong>Access</strong> <strong>and</strong> <strong>Capacity</strong> Study | 46
12 percent Kiss & Ride mode share from the 2007 <strong>Metro</strong>rail Passenger Survey. Based on station<br />
observations, which showed a parking utilization rate of approximately 17 vehicles per hour,<br />
30 spaces will be sufficient to ac<strong>com</strong>modate a 12-percent share of 2040 <strong>Naylor</strong> <strong>Road</strong> <strong>Station</strong><br />
passengers (see the Appendix for calculation details). <strong>Station</strong> observations further revealed that<br />
the more immediate limitation of the existing Kiss & Ride is the amount of curbside pick-up<br />
space, which sometimes results in long queues. This is a <strong>Metro</strong>rail systemwide trend. Therefore,<br />
this study re<strong>com</strong>mends that the future <strong>Naylor</strong> <strong>Road</strong> <strong>Station</strong> Kiss & Ride provide at least 30<br />
temporary parking spaces, <strong>and</strong> that its design ac<strong>com</strong>modates a greater amount of space for<br />
curbside queuing.<br />
If Kiss & Ride dem<strong>and</strong> proves to be lower than 12 percent, it would be advisable for any future<br />
Kiss & Ride configuration to allow for some flexibility to repurpose unneeded Kiss & Ride<br />
spaces to other uses, such as additional bicycle parking or car-sharing spaces. Future TOD<br />
Figure 46: Kiss & Ride Congestion <strong>and</strong> Conflict <strong>Area</strong>s<br />
Branch Ave<br />
Conflict <strong>Area</strong>s<br />
Motorists’ Preferred<br />
Waiting <strong>Area</strong><br />
<strong>Station</strong> Entrance<br />
N<br />
<strong>Naylor</strong> Rd<br />
0 100’<br />
Source: Google Earth (aerial)<br />
47 | Future <strong>Station</strong> <strong>Access</strong> Needs
plans will also need to be taken into account inasmuch as the street grid created may present<br />
other “unofficial” locations for Kiss & Ride activity to take place, such as street curbsides free of<br />
parked cars during peak hours.<br />
Park & Ride<br />
Parking at <strong>Naylor</strong> <strong>Road</strong> <strong>Station</strong> is constrained. The station’s single Park & Ride surface lot<br />
contains 368 daily parking spaces, which represents only five percent of all available parking<br />
on the southern Green Line (Southern Avenue <strong>Station</strong>, <strong>Naylor</strong> <strong>Road</strong> <strong>Station</strong>, Suitl<strong>and</strong> <strong>Station</strong>,<br />
<strong>and</strong> Branch Avenue <strong>Station</strong>). Daily parking will very likely remain constrained into the future<br />
given the expected redevelopment of the station area into a transit-oriented regional center that<br />
emphasizes pedestrian <strong>and</strong> bicycle access.<br />
This study utilized the MWCOG travel dem<strong>and</strong> model to estimate the magnitude of 2040<br />
parking dem<strong>and</strong> by assuming <strong>Naylor</strong> <strong>Road</strong> <strong>Station</strong> parking is unconstrained. Such an analysis<br />
helps <strong>Metro</strong> underst<strong>and</strong> the imbalance between parking supply <strong>and</strong> dem<strong>and</strong>. The results of<br />
this analysis showed that, in an unconstrained parking scenario, daily parking dem<strong>and</strong> would<br />
be reduced at both Suitl<strong>and</strong> <strong>Station</strong> <strong>and</strong> Branch Avenue <strong>Station</strong> <strong>and</strong> increased for <strong>Naylor</strong> <strong>Road</strong><br />
<strong>Station</strong>, most likely because <strong>Naylor</strong><br />
Table 20: Unconstrained Parking Dem<strong>and</strong> at <strong>Naylor</strong> <strong>Road</strong> <strong>Station</strong><br />
2040 Peak Period Park & Ride<br />
Dem<strong>and</strong>*<br />
Constrained Unconstrained<br />
<strong>Station</strong><br />
Parking<br />
Scenario<br />
Parking<br />
Scenario<br />
Total<br />
Difference<br />
Percent<br />
Difference<br />
<strong>Naylor</strong> <strong>Road</strong> 646 2,325 +1,679 +260%<br />
Suitl<strong>and</strong> 3,462 2,862 -600 -17%<br />
Branch Avenue 5,035 4,534 -501 -10%<br />
Source: MWCOG travel dem<strong>and</strong> model<br />
* These numbers represent the number of desired parking trips in 2040, not the number of<br />
parking spaces. The number of desired trips can be higher than the number of spaces due to<br />
turnover.<br />
<strong>Road</strong> <strong>Station</strong> is closer to the District<br />
<strong>and</strong> would thus save time for daily<br />
<strong>com</strong>muters. The analysis found that<br />
2040 Park & Ride trips to <strong>Naylor</strong> <strong>Road</strong><br />
<strong>Station</strong> would increase by 260 percent<br />
if parking were unconstrained, as<br />
shown in Table 20. If trying to meet<br />
this dem<strong>and</strong>, <strong>Metro</strong> would need a Park<br />
& Ride facility of approximately 2,325<br />
daily spaces, assuming an average<br />
occupancy rate is 1.04 people per<br />
vehicle.<br />
Significantly increasing the amount of Park & Ride spaces at <strong>Naylor</strong> <strong>Road</strong> <strong>Station</strong> to such a<br />
degree, however, does not conform to <strong>Metro</strong>’s, Prince George’s County’s, or Maryl<strong>and</strong>’s vision<br />
for the station area. The vision for a redeveloped <strong>Naylor</strong> <strong>Road</strong> <strong>Station</strong> emphasizes alternative<br />
modes of access, such as walking, cycling, <strong>and</strong> bus services, <strong>and</strong> the high capital cost of<br />
providing enough parking to meet dem<strong>and</strong> throughout the <strong>Metro</strong>rail system has similarly<br />
prompted <strong>Metro</strong> to focus on promoting these modes of access, which have lower capital costs.<br />
Even the constrained scenario shows parking dem<strong>and</strong> well over the existing parking capacity<br />
of <strong>Naylor</strong> <strong>Road</strong> <strong>Station</strong>, likely due to reuse of spaces <strong>and</strong> overflow parking inherent in current<br />
parking utilization data.<br />
<strong>Station</strong> <strong>Capacity</strong> & Emergency Egress<br />
Infrastructure requirements were evaluated with a station capacity analysis based on 2012 <strong>and</strong><br />
estimated 2040 ridership levels <strong>and</strong> requirements set by <strong>Metro</strong> <strong>and</strong> the Transit <strong>Capacity</strong> <strong>and</strong><br />
Quality of Service Manual. This analysis established the minimum required vertical (e.g. elevators<br />
<strong>Naylor</strong> <strong>Road</strong> <strong>Metro</strong> <strong>Station</strong> <strong>Area</strong> <strong>Access</strong> <strong>and</strong> <strong>Capacity</strong> Study | 48
<strong>and</strong> escalators) <strong>and</strong> horizontal (e.g. faregate aisles <strong>and</strong><br />
farecard vendors) circulation elements. Table 21 shows that<br />
existing platform-to-mezzanine elevator capacity does not<br />
meet established st<strong>and</strong>ards, but that all other circulation<br />
elements at the existing mezzanine meet the minimum<br />
requirements for 2012 <strong>and</strong> estimated 2040 passenger loads.<br />
This study also analyzed <strong>Naylor</strong> <strong>Road</strong> <strong>Station</strong>’s emergency<br />
egress capacity under existing conditions as well as<br />
estimated conditions in 2040. This analysis is based on the<br />
requirements set by the NFPA 130 st<strong>and</strong>ards. Evacuation<br />
time analysis is based on a worst-case-scenario with peakdirection<br />
trains containing twice the typical number of<br />
passengers to simulate a missed headway. <strong>Metro</strong> uses these<br />
guidelines as design goals when modifying station facilities<br />
to increase their emergency safety capabilities. The results<br />
of this analysis are shown in Table 22.<br />
Table 21: <strong>Station</strong> <strong>Capacity</strong> Analysis Results<br />
Circulation<br />
Elements Required<br />
Element<br />
Existing 2012 2040<br />
Platform Escalators 2 2 2<br />
Platform Elevators* 1 2 2<br />
Faregate Aisles 4 2 2<br />
Farecard Vendors 7 1 1<br />
* While only one platform elevator per mezzanine is required<br />
for ADA <strong>com</strong>pliance, current practice by <strong>Metro</strong> is to provide two<br />
platform elevators per mezzanine.<br />
Table 22: Future Emergency Egress<br />
NFPA<br />
Measure (minutes)<br />
Morning Peak<br />
Time to clear platform<br />
St<strong>and</strong>ard<br />
4.0<br />
2012<br />
3.6<br />
2040<br />
2.5<br />
Time to point of safety 6.0 5.1 4.0<br />
Afternoon Peak<br />
Time to clear platform 4.0 5.2 3.4<br />
Time to point of safety 6.0 6.7 4.9<br />
The results show that <strong>Naylor</strong> <strong>Road</strong> <strong>Station</strong> meets all<br />
emergency egress st<strong>and</strong>ards in 2040. Emergency egress times are shorter in 2040 than present<br />
conditions despite growing ridership. This is ac<strong>com</strong>plished by increasing the number of peakdirection<br />
trains in the peak period to one train every 2.5 minutes; a peak-direction train currently<br />
arrives every 4.6 minutes on average during the peak hour. More trains with greater capacity<br />
can serve the station as the headways are reduced, reducing the number of people per train <strong>and</strong>,<br />
thus, the number of people exiting the station in an emergency situation.<br />
Summary<br />
<strong>Station</strong> area needs discussed in this section are grouped by access mode <strong>and</strong> summarized<br />
in Table 23. The station area is expected to undergo a <strong>com</strong>prehensive transformation<br />
associated with TOD. Some of these needs are directly tied to or even made necessary by the<br />
redevelopment of the station <strong>and</strong> would not happen in the absence of TOD. Other needs are<br />
based on deficiencies observed in the existing station area configuration <strong>and</strong> can be addressed<br />
either as part of or before a TOD plan. For example, the need to provide seven bus bays only<br />
takes effect if the existing bus bays are to be rebuilt as part of station area redevelopment.<br />
Conversely, the need for planned <strong>and</strong> proposed bicycle lanes <strong>and</strong> paths relates to a deficiency in<br />
the existing station area conditions, <strong>and</strong> remains the same whether or not TOD is implemented<br />
at <strong>Naylor</strong> <strong>Road</strong> <strong>Station</strong>.<br />
49 | Future <strong>Station</strong> <strong>Access</strong> Needs
Table 23: Summary of <strong>Naylor</strong> <strong>Road</strong> <strong>Station</strong> <strong>Access</strong> Needs<br />
Need<br />
Pedestrian<br />
Formalized popular desire lines<br />
Wayfinding signage<br />
Safer crossings at intersections <strong>and</strong> midblock locations<br />
Comprehensive coverage of sidewalks with adequate width<br />
Bicycle<br />
New bicycle parking to at least meet future bicycle mode share goal<br />
Planned <strong>and</strong> proposed bicycle lanes <strong>and</strong> paths<br />
Wayfinding signage<br />
Bus<br />
Amenities at nearby bus stops<br />
Designated drop-off space for large shuttles<br />
Seven bus bays to serve growth in bus travel to <strong>Naylor</strong> <strong>Road</strong> <strong>Station</strong><br />
Routing of buses away from roundabouts<br />
Separation of bus <strong>and</strong> automobile access points<br />
Kiss & Ride<br />
Designated drop-off space for small shuttles<br />
Thirty short-term parking spaces (A-spaces <strong>and</strong> metered spaces) to serve future dem<strong>and</strong><br />
Kiss & Ride design to discourage queue congestion<br />
Separation of bus <strong>and</strong> automobile access points<br />
Park & Ride<br />
Replacement of 368 daily parking spaces<br />
Existing<br />
<strong>Station</strong> <strong>Area</strong><br />
Transit-<br />
Oriented<br />
Development<br />
<strong>Naylor</strong> <strong>Road</strong> <strong>Metro</strong> <strong>Station</strong> <strong>Area</strong> <strong>Access</strong> <strong>and</strong> <strong>Capacity</strong> Study | 50
<strong>Station</strong> Re<strong>com</strong>mendations<br />
<strong>Station</strong> access re<strong>com</strong>mendations were developed in response to station needs. Like the needs<br />
identified in the previous section, <strong>Naylor</strong> <strong>Road</strong> <strong>Station</strong> access re<strong>com</strong>mendations are divided into<br />
two general categories:<br />
• Re<strong>com</strong>mendations based on deficiencies observed in the existing station area configuration<br />
that can be addressed either as part of or before TOD implementation, <strong>and</strong><br />
• TOD-based re<strong>com</strong>mendations, or those re<strong>com</strong>mendations tied to <strong>and</strong> made necessary by the<br />
expected redevelopment of the station area.<br />
Table 24: Summary of Existing <strong>Station</strong> <strong>Area</strong> Re<strong>com</strong>mendations<br />
Location<br />
Re<strong>com</strong>mendation<br />
<strong>Naylor</strong> Rd<br />
Add pedestrian signals, crosswalks, <strong>and</strong> pedestrian refuge areas at Suitl<strong>and</strong> Pkwy intersection<br />
Add sidewalks on east side between Suitl<strong>and</strong> Pkwy <strong>and</strong> Oxon Run Dr, <strong>and</strong> on both sides north of Suitl<strong>and</strong> Pkwy<br />
Add shared lane markings <strong>and</strong> “Bikes May Use Full Lane” signs north of Suitl<strong>and</strong> Pkwy*<br />
Add proposed bicycle lanes <strong>and</strong> shared lane markings south of Suitl<strong>and</strong> Pkwy<br />
Add proposed sidewalks <strong>and</strong> remove fence along observed pedestrian desire lines<br />
Install rapid flash beacons at roundabout crosswalks <strong>and</strong> crosswalk at the right-turn lane to Branch Ave<br />
Study additional marked crossing between Good Hope Ave <strong>and</strong> Branch Ave*<br />
Branch Ave Add sidewalk on east side between station entrance <strong>and</strong> Southern Ave<br />
Add proposed bicycle lanes from the District line south<br />
Add proposed pedestrian signals <strong>and</strong> crosswalks at all approaches at station entrance intersection<br />
Add pedestrian refuge areas <strong>and</strong> reduce northbound right-turn radius at station entrance intersection<br />
Add proposed new <strong>and</strong> widened sidewalks south of station entrance intersection<br />
Study midblock pedestrian hybrid signal south of station entrance intersection*<br />
Oxon Run Dr Add new <strong>and</strong> widen existing sidewalks<br />
Add shared lane markings <strong>and</strong> “Bikes May Use Full Lane” signs*<br />
Add connection to proposed Oxon Run Trail<br />
Add curb extension, crosswalks, <strong>and</strong> reduce curb radii at Oxon Park St intersection<br />
Good Hope Ave Add sidewalks on west side<br />
Suitl<strong>and</strong> Pkwy Implement proposed Suitl<strong>and</strong> Parkway multi-use path into Maryl<strong>and</strong><br />
Oxon Run Park Implement proposed Oxon Run Trail<br />
<strong>Station</strong> Footprint: Add pathway from Oxon Run Dr through Park & Ride lot to station entrance<br />
Bike & Pedestrian Add at least 10 bicycle parking spaces<br />
Bus Bays<br />
Require bus drivers to leave Bay C after discharging passengers<br />
Require operators of large shuttles to apply for a station access permit**<br />
Kiss & Ride Improve motorist awareness of Kiss & Ride entrance at Branch Avenue<br />
Add striping <strong>and</strong> signage to encourage motorists to queue near Kiss & Ride shelters<br />
Designate space for small shuttles<br />
General<br />
Implement improved wayfinding signage<br />
Add bus stop amenities—benches, shelters, sidewalk connections, <strong>and</strong> ADA accessibility features—where missing<br />
* More detailed study <strong>and</strong> analysis is required to determine overall feasibility<br />
** Requires adherence to <strong>Metro</strong>’s shuttle bus policy, two key factors are sufficient bus bay capacity <strong>and</strong> <strong>com</strong>pliance with insurance requirements.<br />
51 | <strong>Station</strong> Re<strong>com</strong>mendations
Specific implementation timelines are not defined in this study. However, TOD-based<br />
re<strong>com</strong>mendations rely on the implementation of the mixed-use vision for the station <strong>and</strong><br />
are therefore generally considered long-term re<strong>com</strong>mendations. Existing station area<br />
re<strong>com</strong>mendations, on the other h<strong>and</strong>, are not dependent upon TOD <strong>and</strong> can thus be<br />
implemented at any point in the near term or long term. Implementing many of the station area<br />
re<strong>com</strong>mendations will involve coordination between <strong>Metro</strong> <strong>and</strong> various local, regional, <strong>and</strong><br />
federal agencies, private developers, <strong>and</strong> members of the <strong>com</strong>munity. Re<strong>com</strong>mendations are not<br />
constrained by implementation costs.<br />
Existing <strong>Station</strong> <strong>Area</strong> Re<strong>com</strong>mendations<br />
Existing station area re<strong>com</strong>mendations, shown in Table 24, were devised in response to observed<br />
deficiencies that result from the present configuration of <strong>Naylor</strong> <strong>Road</strong> <strong>Station</strong>’s facilities <strong>and</strong><br />
the existing conditions of its surroundings. A few of these re<strong>com</strong>mendations will remain<br />
relevant only until the station area is redeveloped, at which point the existing facilities will be<br />
removed <strong>and</strong> reconfigured. Most existing station area re<strong>com</strong>mendations will stay relevant after<br />
station area redevelopment because the need will remain after the introduction of TOD or they<br />
address a nearby need beyond <strong>Metro</strong> property. Existing station area re<strong>com</strong>mendations can be<br />
implemented independently of each other, but some re<strong>com</strong>mendations may be more effective if<br />
implemented in concert.<br />
Pedestrian <strong>and</strong> Bicycle<br />
Improving the <strong>Naylor</strong> <strong>Road</strong> <strong>Station</strong> area’s walking <strong>and</strong> cycling environment is a critical step<br />
toward realizing its mixed-use, transit-oriented vision. Many of the station area’s pedestrian<br />
<strong>and</strong> bicycle deficiencies can be addressed before TOD is implemented. This study’s existing<br />
station area pedestrian <strong>and</strong> bicycle re<strong>com</strong>mendations (Table 25) are designed to improve safety,<br />
convenience, <strong>and</strong> accessibility. These re<strong>com</strong>mendations, which are mapped in Figure 47, are<br />
the result of station observations performed during this study as well as findings presented in<br />
previously <strong>com</strong>pleted <strong>and</strong> ongoing station area improvement plans.<br />
As noted in Table 25, some of these re<strong>com</strong>mendations require more detailed operational <strong>and</strong><br />
safety analyses to conclude overall feasibility. Implementing any of these re<strong>com</strong>mendations will<br />
require coordination between <strong>Metro</strong> <strong>and</strong> local, regional, <strong>and</strong> federal partners, including NPS,<br />
Maryl<strong>and</strong> Department of Transportation (MDOT), SHA, M-NCPPC, Prince George’s County<br />
Department of Public Works <strong>and</strong> Transportation (DPW&T), <strong>and</strong> DDOT.<br />
For example, re<strong>com</strong>mendations 1, 2, 4, 5, 9, 10, <strong>and</strong> 12 in Table 25 highlight improvements<br />
proposed by the SHA Streetscape Project—currently in the design phase <strong>and</strong> planned to begin<br />
construction in 2014, if funding is identified—<strong>and</strong> supported by foundation laid by the Branch<br />
Avenue Corridor Sector Plan. The SHA Streetscape Project is expected to improve crossing<br />
safety, widen or add sidewalks to a 6.5- to 10-foot width, <strong>and</strong> add bicycle facilities on <strong>Naylor</strong><br />
<strong>Road</strong> south of Suitl<strong>and</strong> Parkway <strong>and</strong> on Branch Avenue south of the <strong>Naylor</strong> <strong>Road</strong> <strong>Station</strong> access<br />
point (see Figure 48 for proposed cross sections). The SHA Streetscape Project also plans to<br />
improve access along observed pedestrian desire lines with a ramp <strong>and</strong> sidewalk on <strong>Naylor</strong><br />
<strong>Road</strong> at the northwest corner of the Park & Ride, <strong>and</strong> sidewalks on both sides of the Park & Ride<br />
entryway between the roundabout <strong>and</strong> the Park & Ride payment booths.<br />
<strong>Naylor</strong> <strong>Road</strong> <strong>Metro</strong> <strong>Station</strong> <strong>Area</strong> <strong>Access</strong> <strong>and</strong> <strong>Capacity</strong> Study | 52
Figure 47: Pedestrian <strong>and</strong> Bicycle Re<strong>com</strong>mendations<br />
20<br />
19<br />
2<br />
9<br />
Suitl<strong>and</strong> Pkwy<br />
2<br />
3<br />
8<br />
Southern Ave<br />
19<br />
1<br />
2<br />
5<br />
1/4 mile<br />
22<br />
10<br />
11<br />
20<br />
16<br />
4<br />
6<br />
5<br />
21<br />
Branch Ave<br />
13<br />
15<br />
14<br />
Oxon Run Dr<br />
17<br />
14<br />
Good Hope Ave<br />
18<br />
6 4<br />
7<br />
12<br />
<strong>Naylor</strong> Rd<br />
6<br />
12<br />
9<br />
Rapid Flash Beacon<br />
Shared-Lane Markings <strong>and</strong> Signs<br />
Bicycle Lanes<br />
Shared-Use Path<br />
Sidewalk<br />
<strong>Station</strong> Entrance<br />
N<br />
0 500’<br />
Source: Google Earth (aerial)<br />
53 | <strong>Station</strong> Re<strong>com</strong>mendations
Figure 48: Proposed Branch Avenue (top) <strong>and</strong> <strong>Naylor</strong> <strong>Road</strong> (bottom) Typical Sections<br />
Source: MD 5 (Branch Avenue) <strong>and</strong> MD 637 (<strong>Naylor</strong> <strong>Road</strong>) Streetscape Improvements<br />
<strong>Naylor</strong> <strong>Road</strong> <strong>Metro</strong> <strong>Station</strong> <strong>Area</strong> <strong>Access</strong> <strong>and</strong> <strong>Capacity</strong> Study | 54
Not all re<strong>com</strong>mendations will be addressed through the SHA Streetscape Project. The<br />
installation of a pedestrian hybrid signal—more <strong>com</strong>monly referred to as a HAWK (high<br />
intensity activated crosswalk) signal—at a midblock crossing on Branch Avenue is unlikely. SHA<br />
currently does not support midblock crossing signals, but it is important to note the potential<br />
need for a crossing at this location for future consideration. This study re<strong>com</strong>mends that the<br />
final <strong>Naylor</strong> <strong>Road</strong> <strong>Station</strong> site plan should consider such pedestrian desire lines when locating<br />
new streets through the station area. Ideally these streets will eliminate the existing superblock<br />
pattern along Branch Avenue <strong>and</strong> provide multiple safe crossing points for pedestrians.<br />
Other re<strong>com</strong>mendations include installing rapid flash beacons at <strong>Naylor</strong> <strong>Road</strong> roundabouts <strong>and</strong><br />
the right-turn lane at Branch Avenue to alert motorists of crossing pedestrians (see Figure 49).<br />
Pedestrians are currently at risk when crossing these roundabouts, as motorists often continue<br />
through the intersections without yielding. Rapid flash beacons are user actuated, either by<br />
pressing a push button or with the aid of a pedestrian detection system.<br />
<strong>Metro</strong>’s Pedestrian <strong>and</strong> Bicycle Element of the 2012-2017 Capital Improvement Program re<strong>com</strong>mends<br />
establishing a formal pedestrian pathway through the Park & Ride lot from the Oxon Run Drive<br />
roundabout. Many pedestrians already follow the course of this proposed path when accessing<br />
the station, which causes them to cross vehicular traffic at several unmarked locations. This<br />
pathway should include paved sidewalks, designated crosswalks, <strong>and</strong> wayfinding signage.<br />
The Park & Ride lot may lose some parking spaces depending on the path’s actual alignment, if<br />
implemented.<br />
Table 25: Pedestrian <strong>and</strong> Bicycle Re<strong>com</strong>mendations<br />
Figure<br />
Location 47 ID Re<strong>com</strong>mendation<br />
<strong>Naylor</strong> Rd 1 Add pedestrian signals, crosswalks, <strong>and</strong> pedestrian refuge areas at Suitl<strong>and</strong> Pkwy intersection<br />
2 Add sidewalks on east side between Suitl<strong>and</strong> Pkwy <strong>and</strong> Oxon Run Dr, <strong>and</strong> on both sides north of Suitl<strong>and</strong> Pkwy<br />
3* Add shared lane markings <strong>and</strong> “Bikes May Use Full Lane” signs north of Suitl<strong>and</strong> Pkwy<br />
4 Add proposed bicycle lanes <strong>and</strong> shared lane markings south of Suitl<strong>and</strong> Pkwy<br />
5 Add proposed sidewalks <strong>and</strong> remove fence along observed pedestrian desire lines<br />
6 Install rapid flash beacons at roundabout crosswalks <strong>and</strong> crosswalk at the right-turn lane to Branch Ave<br />
7* Study additional marked crossing between Good Hope Ave <strong>and</strong> Branch Ave<br />
Branch Ave 8 Add sidewalk on east side between station entrance <strong>and</strong> Southern Ave<br />
9 Add proposed bicycle lanes from the District line south<br />
10 Add proposed pedestrian signals <strong>and</strong> crosswalks at all approaches at station entrance intersection<br />
11 Add pedestrian refuge areas <strong>and</strong> reduce northbound right-turn radius at station entrance intersection<br />
12 Add proposed new <strong>and</strong> widened sidewalks south of station entrance intersection<br />
13* Study midblock pedestrian hybrid signal south of station entrance intersection<br />
Oxon Run Dr 14 Add new <strong>and</strong> widen existing sidewalks<br />
15* Add shared lane markings <strong>and</strong> “Bikes May Use Full Lane” signs<br />
16 Add connection to proposed Oxon Run Trail<br />
17 Add curb extension, crosswalks, <strong>and</strong> reduce curb radii at Oxon Park St intersection<br />
Good Hope Ave 18 Add sidewalks on west side<br />
Suitl<strong>and</strong> Pkwy 19 Implement proposed Suitl<strong>and</strong> Parkway multi-use path into Maryl<strong>and</strong><br />
Oxon Run Park 20 Implement proposed Oxon Run Trail<br />
<strong>Station</strong> Footprint: 21 Add pathway from Oxon Run Dr through Park & Ride lot to station entrance<br />
Bike & Pedestrian 22 Add at least 10 bicycle parking spaces<br />
General N/A Implement improved wayfinding signage<br />
* More detailed study <strong>and</strong> analysis is required to determine overall feasibility<br />
55 | <strong>Station</strong> Re<strong>com</strong>mendations
Figure 49: Rapid Flash Beacon (left) <strong>and</strong> Existing <strong>Naylor</strong> <strong>Road</strong> Roundabout<br />
Implementing bicycle lanes<br />
Signs<br />
<strong>and</strong> pathways proposed in the<br />
2009 Prince George’s Countywide<br />
Master Plan of Transportation<br />
<strong>and</strong> the 2005 District of Columbia<br />
Bicycle Master Plan would greatly<br />
exp<strong>and</strong> bicycle access. Proposed<br />
facilities include a Branch Avenue<br />
bicycle lane from the District<br />
boundary south to the Capital<br />
Beltway (I-495), a Branch Avenue<br />
bicycle lane within the District<br />
with a terminus at Southern<br />
Avenue, <strong>and</strong> two off-street<br />
hard-surface trails: a new Oxon<br />
Run Trail (located entirely on<br />
Source: Eric O’Brien (Creative Commons, left image only)<br />
M-NCPPC l<strong>and</strong> that will provide<br />
access to <strong>Naylor</strong> <strong>Road</strong> <strong>and</strong><br />
Southern Avenue station) <strong>and</strong> the extension of the Suitl<strong>and</strong> Parkway Trail southeast to Branch<br />
Avenue <strong>Station</strong> from its current terminus at the District line. Implementation of a portion of the<br />
Branch Avenue bicycle lanes—from the station entrance to Curtis Drive—is planned as part of<br />
the SHA Streetscape Project. Though not proposed in the SHA Streetscape Project, this study<br />
re<strong>com</strong>mends further study <strong>and</strong> analysis of shared lane markings <strong>and</strong> “Bikes May Use Full Lane”<br />
signs on <strong>Naylor</strong> <strong>Road</strong> north of Suitl<strong>and</strong> Parkway.<br />
While dem<strong>and</strong> for bicycle parking is low at <strong>Naylor</strong> <strong>Road</strong> <strong>Station</strong> today, improving bicycle access<br />
with the re<strong>com</strong>mended lanes <strong>and</strong> pathways should encourage more cyclists. <strong>Metro</strong> would need<br />
to construct at least 10 additional bicycle parking spaces 2 at <strong>Naylor</strong> <strong>Road</strong> <strong>Station</strong> in support of<br />
the agency’s 3.5 percent systemwide bicycle mode share goal.<br />
<strong>Metro</strong>’s Pedestrian <strong>and</strong> Bicycle Element of the 2012-2017 Capital Improvement Program re<strong>com</strong>mends<br />
placing additional parking within sight of the station manager to reduce the opportunity for<br />
theft, a known issue at the station. Given those considerations, the most suitable location for<br />
additional bicycle parking is east of the station entrance.<br />
This study re<strong>com</strong>mends the development of consistent wayfinding signage to direct pedestrians<br />
<strong>and</strong> cyclists to the station. Wayfinding signage will be particularly important as bicycle lanes <strong>and</strong><br />
pathways are constructed, <strong>and</strong> as the station redevelops <strong>and</strong> foot traffic increases.<br />
2. A st<strong>and</strong>ard<br />
U-rack can<br />
ac<strong>com</strong>modate<br />
two bicycles,<br />
while a locker<br />
ac<strong>com</strong>modates<br />
one.<br />
Bus<br />
Buses operate relatively well at <strong>Naylor</strong> <strong>Road</strong> <strong>Station</strong>, as the bus bays are able to smoothly<br />
ac<strong>com</strong>modate all routes that currently serve the station. The current bus bay configuration can<br />
adequately serve increases in bus activity estimated for 2040. Therefore, physical changes to the<br />
bus bay facility are not needed, though this study assumes the existing facility will be relocated<br />
or at least altered as a result of station area redevelopment. Re<strong>com</strong>mendations for bus operations<br />
are highlighted in Table 26.<br />
<strong>Naylor</strong> <strong>Road</strong> <strong>Metro</strong> <strong>Station</strong> <strong>Area</strong> <strong>Access</strong> <strong>and</strong> <strong>Capacity</strong> Study | 56
Nearby Branch Avenue bus stops<br />
lack amenities <strong>and</strong> this study<br />
re<strong>com</strong>mends adding amenities<br />
to enhance the convenience <strong>and</strong><br />
accessibility for bus passengers.<br />
Additional amenities outside of<br />
the study area but within 1/2-mile<br />
of the station are needed at stops<br />
Table 26: Bus Re<strong>com</strong>mendations<br />
Location Re<strong>com</strong>mendation<br />
Bus Bays Require bus drivers to leave Bay C after discharging passengers<br />
Require operators of large shuttles to apply for a station access permit*<br />
General Add bus stop amenities—benches, shelters, sidewalk connections, <strong>and</strong><br />
ADA accessibility features—where missing<br />
* Requires adherence to <strong>Metro</strong>’s shuttle bus policy, two key factors are sufficient bus bay capacity<br />
<strong>and</strong> <strong>com</strong>pliance with insurance requirements.<br />
along Curtis Drive, 28th Parkway, <strong>and</strong> Berkley Street. Many of these stops lack amenities<br />
suggested for basic bus stops, most notably amenities such as sidewalks or ADA-<strong>com</strong>pliant<br />
curb ramps. Adding these <strong>and</strong> other basic amenities, for example schedules, concrete<br />
boarding pads, <strong>and</strong> NextBus information signs, would improve the bus riding experience for<br />
existing passengers <strong>and</strong> possibly attract additional riders. Improving these stops will require<br />
coordination between <strong>Metro</strong> <strong>and</strong> Prince George’s County DPW&T.<br />
Some improvements can be made in the station area, too. <strong>Metro</strong> should require bus drivers to<br />
exit the Bay C drop-off area immediately after discharging all passengers <strong>and</strong> relocate their bus<br />
to either their assigned bay or the layover area, depending on the next scheduled departure<br />
time. Supervisors should enforce this <strong>and</strong> all other st<strong>and</strong>ard <strong>Metro</strong> operating rules to reduce<br />
operational conflicts at this occasionally congested location.<br />
Finally, though no private or public shuttle operators serve <strong>Naylor</strong> <strong>Road</strong> <strong>Station</strong>, this study<br />
estimates some shuttle activity in the future, most likely once redevelopment is <strong>com</strong>plete. <strong>Metro</strong><br />
should require shuttle operators in the future to apply for use of station bus bays for large<br />
shuttle buses. Issuance of permits is dependent on several factors including bus bay capacity <strong>and</strong><br />
providers <strong>com</strong>pliance with insurance requirements. More details on <strong>Metro</strong>’s proposed shuttle<br />
permitting program can be found in the Shuttle Services at <strong>Metro</strong> Facilities plan.<br />
Bus delay at <strong>Naylor</strong> <strong>Road</strong> roundabouts <strong>and</strong> <strong>com</strong>bined Kiss & Ride/bus bay access points are<br />
notable deficiencies, but improvements to these issues should be addressed during development<br />
of the final TOD site plan of the station area. Designers should look for opportunities to separate<br />
the entrances to these facilities <strong>and</strong> route buses away from unsignalized intersections with heavy<br />
traffic volumes, such as the <strong>Naylor</strong> <strong>Road</strong> roundabouts.<br />
Kiss & Ride<br />
The Kiss & Ride facility as currently configured is large enough to ac<strong>com</strong>modate existing <strong>and</strong><br />
future dem<strong>and</strong>. However, some signage <strong>and</strong> striping modifications to the existing Kiss & Ride<br />
could improve operations during congested periods. This study assumes that more substantive<br />
design changes will likely occur in the future to ac<strong>com</strong>modate station area redevelopment.<br />
Re<strong>com</strong>mendations for Kiss & Ride operations are highlighted in Table 27.<br />
In advance of station<br />
redevelopment, alteration<br />
of the Branch Avenue<br />
station entrance should<br />
be considered to remove<br />
Table 27: Kiss & Ride Re<strong>com</strong>mendations<br />
Location Re<strong>com</strong>mendation<br />
Kiss & Ride Improve motorist awareness of Kiss & Ride entrance at Branch Avenue<br />
Add striping <strong>and</strong> signage to encourage motorists to queue near Kiss & Ride shelters<br />
Designate space for small shuttles<br />
57 | <strong>Station</strong> Re<strong>com</strong>mendations
confusion about how to enter the Kiss & Ride. A large, bold sign with an arrow that states “KISS<br />
& RIDE KEEP LEFT” could reduce the frequency of motorists accidentally entering the bus bay<br />
facility. In addition, this study re<strong>com</strong>mends signage <strong>and</strong> pavement markings near the north Kiss<br />
& Ride crosswalk to encourage motorists to wait for passengers near the Kiss & Ride shelters.<br />
Moving the vehicle queue farther downstream would reduce the likelihood of conflicts with the<br />
bus loop. Cross-hatch pavement markings <strong>and</strong> “DO NOT BLOCK THE INTERSECTION” signs<br />
should be added to alert motorists of the bus loop/Kiss & Ride conflict areas, as shown in Figure<br />
50.<br />
Kiss & Rides are required to include dedicated shuttle space based on <strong>Metro</strong>’s <strong>Station</strong> Site <strong>and</strong><br />
<strong>Access</strong> Planning Manual. Though not needed now, Kiss & Ride space for use by small shuttles<br />
should be formalized in the future when needed. Large shuttles should apply for a permit to use<br />
a bus bay. As with bus operations, delay at <strong>Naylor</strong> <strong>Road</strong> roundabouts <strong>and</strong> the <strong>com</strong>bined Kiss &<br />
Ride <strong>and</strong> bus bay access points are problematic <strong>and</strong> improvements should be considered during<br />
development of the final TOD site plan of the station area.<br />
Figure 50: Strategies to Reduce Queuing Conflicts in the Kiss & Ride<br />
KISS & RIDE<br />
Branch Ave<br />
T A X I<br />
O N L Y<br />
PASSENGER<br />
DROP-OFF<br />
ZONE<br />
STANDING<br />
T A X I<br />
O N L Y<br />
W A I T<br />
FOR<br />
PASSENGERS<br />
IN SPACES<br />
Do Not Block<br />
Intersection Markings<br />
Sign Location<br />
<strong>Station</strong> Entrance<br />
N<br />
0 50’<br />
Source: Google Earth (aerial)<br />
<strong>Naylor</strong> <strong>Road</strong> <strong>Metro</strong> <strong>Station</strong> <strong>Area</strong> <strong>Access</strong> <strong>and</strong> <strong>Capacity</strong> Study | 58
Park & Ride<br />
Re<strong>com</strong>mendations relating to <strong>Naylor</strong> <strong>Road</strong> <strong>Station</strong>’s Park & Ride lot are dependent upon<br />
implementation of TOD <strong>and</strong> therefore summarized in the following section. No changes are<br />
re<strong>com</strong>mended to existing Park & Ride operations.<br />
TOD-Based Re<strong>com</strong>mendations<br />
In order for the established vision of TOD at <strong>Naylor</strong> <strong>Road</strong> to be realized, the current station<br />
area footprint—<strong>com</strong>prised of separate bus, Kiss & Ride, <strong>and</strong> Park & Ride facilities—must be<br />
reconfigured to create more developable l<strong>and</strong>. Dem<strong>and</strong> for Park & Ride <strong>and</strong> bus facilities,<br />
however, is estimated to increase in the future. Balancing the vision for a redeveloped station<br />
<strong>and</strong> the need to meet growing access dem<strong>and</strong> will require a variety of strategies.<br />
This study identifies future access <strong>and</strong> capacity needs at <strong>Naylor</strong> <strong>Road</strong> <strong>Station</strong>, but does not<br />
design a site plan for redevelopment of <strong>Metro</strong> property. Future station access needs in this report<br />
will provide context to future planning that will determine the character <strong>and</strong> layout of station<br />
area redevelopment. Exactly what the future station area will look like is presently unknown,<br />
<strong>and</strong> will be largely dependent on future agreements between <strong>Metro</strong>, Prince George’s County, the<br />
State of Maryl<strong>and</strong>, <strong>and</strong> developers seeking to undertake redevelopment of the site. Given this<br />
uncertainty, this section proposes a variety of strategies, which are individual re<strong>com</strong>mendations<br />
tied to <strong>and</strong> made necessary by transit-oriented redevelopment of the station area. Options<br />
are groups of strategies designed to ac<strong>com</strong>modate the access needs of <strong>Naylor</strong> <strong>Road</strong> <strong>Station</strong> in<br />
2040. While joint development is expected to begin before 2040, station facilities will need to be<br />
designed to ac<strong>com</strong>modate ridership needs over the next several decades.<br />
The options presented here have been grouped into those that achieve access goals by A) shifting<br />
parking from the station to other locations, B) replacing the station’s parking facilities on-site, or<br />
C) exp<strong>and</strong>ing the parking facilities of the southern Green Line. Kiss & Ride access would remain<br />
at the station under all options. Options are centered on parking because it is a central driver of<br />
transit system accessibility, <strong>and</strong> because its availability is among the most important aspects of<br />
successful TOD. While dem<strong>and</strong> for parking is high at <strong>Naylor</strong> <strong>Road</strong> <strong>Station</strong> <strong>and</strong> will continue to<br />
grow in the future, devoting too much space for parking can negatively impact the pedestrian<strong>and</strong><br />
transit-friendly environment of TOD as well as reduce the amount of developable l<strong>and</strong>. A<br />
balance must be struck to meet station access needs without <strong>com</strong>promising TOD placemaking<br />
principles. Presenting a variety of options provides different means of achieving this desired<br />
balance in the future.<br />
Assumptions<br />
Strategies <strong>and</strong> options in this section are based on a set of assumptions regarding future<br />
development characteristics <strong>and</strong> future transportation connectivity <strong>and</strong> accessibility. The<br />
following assumptions are <strong>com</strong>posed of factors, constraints, <strong>and</strong> considerations that influenced<br />
the development of TOD-based strategies for <strong>Naylor</strong> <strong>Road</strong> <strong>Station</strong>.<br />
1. <strong>Naylor</strong> <strong>Road</strong> <strong>Station</strong> will be redeveloped into a regional center in <strong>com</strong>pliance with the<br />
Branch Avenue Sector Plan’s approved M-X-T zone, which permits high-density, mixed-use<br />
buildings up to 12 stories high. The tallest buildings would be located the closest to the<br />
station entrance.<br />
59 | <strong>Station</strong> Re<strong>com</strong>mendations
2. Human-scaled design characteristics that promote walking, cycling, <strong>and</strong> transit will be<br />
prioritized above automobile-oriented development when the station is redeveloped.<br />
3. The entire station footprint will be developed. The existing bus, Kiss & Ride <strong>and</strong> Park &<br />
Ride facilities will be reconfigured to create developable l<strong>and</strong>.<br />
4. Existing station area pedestrian <strong>and</strong> bicycle re<strong>com</strong>mendations will be addressed as part of<br />
future redevelopment plans.<br />
5. The new street network in the final <strong>Naylor</strong> <strong>Road</strong> <strong>Station</strong> site plan will increase access to new<br />
development <strong>and</strong> connect to the existing street network <strong>and</strong> intersections.<br />
6. The overall amount of <strong>Metro</strong>-operated parking on the southern Green Line in Prince<br />
George’s County will not be reduced. In effect, if parking is removed at <strong>Naylor</strong> <strong>Road</strong><br />
<strong>Station</strong> to ac<strong>com</strong>modate development, it will be replaced with parking elsewhere along the<br />
southern Green Line.<br />
Strategies<br />
Strategies presented in this section are individual re<strong>com</strong>mendations tied to <strong>and</strong> made necessary<br />
by TOD redevelopment of the station area. Like the existing station area re<strong>com</strong>mendations,<br />
TOD-related strategies are often <strong>com</strong>plementary, <strong>and</strong> could be implemented in conjunction with<br />
one another. This section provides a brief summary of each strategy, highlighting advantages<br />
<strong>and</strong> disadvantages.<br />
Figure 51: <strong>Metro</strong>’s <strong>Station</strong> <strong>Access</strong> Hierarchy<br />
Source: <strong>Station</strong> Site <strong>and</strong> <strong>Access</strong> Planning Manual<br />
All-In-One Parking Garage<br />
This study recognizes that the footprint of the<br />
<strong>Naylor</strong> <strong>Road</strong> <strong>Station</strong> access facilities—Park & Ride,<br />
Kiss & Ride, <strong>and</strong> bus bay loop—must change to<br />
ac<strong>com</strong>modate future joint development. However,<br />
dem<strong>and</strong> for these facilities in the future is expected<br />
to be at least as great as current dem<strong>and</strong>. One<br />
strategy to address both of these circumstances is to<br />
<strong>com</strong>bine each facility into an “all-in-one” parking<br />
garage with Kiss & Ride facilities <strong>and</strong> bike parking<br />
on the lower level(s), as well as bus facilities. Park &<br />
Ride facilities would occupy the upper levels of the<br />
all-in-one parking garage. The layout of the modal<br />
access facilities in relation to one another would<br />
be guided by <strong>Metro</strong>’s station access hierarchy<br />
established in the <strong>Station</strong> Site <strong>and</strong> <strong>Access</strong> Planning<br />
Manual (see Figure 51). Bicycle facilities would<br />
occupy those portions of the garage closest to the<br />
station entrance, with bus bays next, followed by<br />
Kiss & Ride/shuttle facilities <strong>and</strong>, finally, Park &<br />
Ride. Note that the pick-up <strong>and</strong> drop-off function of<br />
a Kiss & Ride only works in a parking garage when<br />
<strong>Naylor</strong> <strong>Road</strong> <strong>Metro</strong> <strong>Station</strong> <strong>Area</strong> <strong>Access</strong> <strong>and</strong> <strong>Capacity</strong> Study | 60
there is no other more convenient location.<br />
Careful consideration on locating a future<br />
all-in-one parking garage would be needed to<br />
ensure that the Kiss & Ride would function as<br />
intended. Finally, the facility should be sited so<br />
as not to impede pedestrian access, the highest<br />
modal priority, in any way.<br />
Figure 52: College Park-U of MD <strong>Station</strong> Bike & Ride<br />
An example of this concept exists within the<br />
<strong>Metro</strong>rail system in the Park & Ride garage<br />
at College Park-U of MD <strong>Station</strong>, which<br />
ac<strong>com</strong>modates multiple modes of access. While<br />
the garage’s upper levels are designated for<br />
daily parking only, the bottom level is reserved<br />
for Kiss & Ride. <strong>Metro</strong> upgraded this garage<br />
in May 2012 to include <strong>Metro</strong>rail’s first Bike &<br />
Ride facility, a protected bicycle storage area<br />
that charges small fees by the hour (Figure<br />
52). Both Bethesda <strong>and</strong> Friendship Heights<br />
stations, as well as other transit stations<br />
nationwide (Figure 53), incorporate bus bays<br />
into structures, but bus operations are more<br />
constrained at Friendship Heights <strong>Station</strong> as a<br />
result of limited space. A parking garage can<br />
limit bus operational changes <strong>and</strong> growth if not<br />
planned <strong>and</strong> designed with care. Additionally,<br />
the design of an all-in-one garage should be<br />
mindful of passenger <strong>com</strong>fort <strong>and</strong> incorporate<br />
ample lighting, space, <strong>and</strong> protection from bus<br />
exhaust.<br />
Source: Matt Johnson (Creative Commons)<br />
Figure 53: El Monte <strong>Station</strong> (El Monte, California<br />
Advantages<br />
• Reduces the amount of l<strong>and</strong> devoted to<br />
Source: Oran Viryincy (Creative Commons)<br />
station access modes, particularly parking<br />
• Potentially provides space for a Bike & Ride<br />
facility similar to College Park-U of MD <strong>Station</strong><br />
• Ability to prioritize access according to <strong>Metro</strong>’s hierarchy by placing bus bays, a Kiss &<br />
Ride, <strong>and</strong>/or a potential Bike & Ride on the lower levels for quicker access to the station<br />
entrance<br />
• Possible retail frontage along street-facing sides of the facility (Figure 54)<br />
Disadvantages<br />
• Higher capital costs <strong>com</strong>pared to constructing surface lots<br />
• May require shared access between different modes or uses, a noted <strong>com</strong>plaint of <strong>Naylor</strong><br />
<strong>Road</strong> <strong>Station</strong>’s existing bus loop <strong>and</strong> Kiss & Ride shared access points<br />
• May be difficult to fit bus bays <strong>and</strong> layover space<br />
61 | <strong>Station</strong> Re<strong>com</strong>mendations
Figure 54: Examples of Retail in Parking Garages: Athens, GA (left) <strong>and</strong> Reston Town Center, VA (right)<br />
Source: Batson-Cook (left image only)<br />
Developer-Constructed Parking Garage with Reserved Transit Parking<br />
As part of the joint development process, a developer could construct a parking facility adjacent<br />
to the station that ac<strong>com</strong>modates both <strong>Metro</strong>rail passengers <strong>and</strong> the retail/residential/office<br />
uses included in the development plan. With this strategy, the developer reserves some daily<br />
parking for transit customers only. Remaining parking spaces would be made available for retail<br />
customers, office employees, <strong>and</strong>/or residents of the development connected to the garage. Such<br />
a facility could possibly incorporate other modes in keeping with the all-in-one garage concept.<br />
Wheaton <strong>Station</strong>, which features Kiss & Ride facilities incorporated into a multi-use building<br />
built by a developer, is an example of this approach within the <strong>Metro</strong>rail system (Figure 55).<br />
Figure 55: Wheaton <strong>Station</strong> Kiss & Ride Incorporated into<br />
Mixed-Use Building<br />
There are many design <strong>and</strong> operational issues<br />
to resolve before implementing this strategy,<br />
including access, fee collection, signage,<br />
management, enforcement, maintenance,<br />
security, <strong>and</strong> pricing, among others. The design<br />
of such a facility could keep transit parking <strong>and</strong><br />
other parking pools permanently separated by<br />
hard barriers or walls, with separate entrances<br />
for each pool of users. Barriers could also be<br />
movable, allowing all parking to be pooled<br />
during weekend days or even in off-peak hours.<br />
Pricing <strong>and</strong> enforcement, in particular, are two<br />
of the most important aspects for a multi-user<br />
garage because of the high dem<strong>and</strong> for daily<br />
transit parking at <strong>Naylor</strong> <strong>Road</strong> <strong>Station</strong>. If public<br />
parking costs less per day than transit parking,<br />
<strong>Naylor</strong> <strong>Road</strong> <strong>Metro</strong> <strong>Station</strong> <strong>Area</strong> <strong>Access</strong> <strong>and</strong> <strong>Capacity</strong> Study | 62
<strong>Metro</strong> customers would quickly inundate the public portion of the garage once it opens. <strong>Metro</strong><br />
customers would likely use the public portion of the garage even if it costs more per day than<br />
transit parking, up to a point. <strong>Metro</strong> <strong>and</strong> the garage owner would need to develop effective<br />
pricing <strong>and</strong> enforcement strategies to discourage transit customers from occupying parking<br />
spaces intended for uses related to the adjacent building(s), or vice versa.<br />
Advantages<br />
• Construction costs are absorbed by the developer<br />
• Guaranteed number of parking spaces for <strong>Metro</strong>rail customers<br />
• Reduces the amount of l<strong>and</strong> devoted to parking<br />
• Potentially provides space for other modes in addition to Park & Ride<br />
• Ability to prioritize access according to <strong>Metro</strong>’s hierarchy by placing bus bays, a Kiss &<br />
Ride, <strong>and</strong>/or a potential Bike & Ride on the lower levels for quicker access to the station<br />
entrance<br />
• Possible retail frontage along street-facing sides of the garage<br />
Disadvantages<br />
• Due to high dem<strong>and</strong> for parking at <strong>Naylor</strong> <strong>Road</strong> <strong>Station</strong>, transit parking customers may<br />
spill over into general public parking without tailored pricing <strong>and</strong> enforcement strategies.<br />
Conversely, public parking customers may use transit parking, if available.<br />
• Transit parking spaces are always reserved, even if they go unused at some times of day<br />
• May be difficult to fit bus bays <strong>and</strong> layover space<br />
Developer-Constructed Parking Garage with Shared Parking<br />
Similar to the previous strategy, a shared parking garage can serve multiple users within<br />
the same facility. However, the difference is that parking is not reserved for any specific use.<br />
A shared garage takes advantage of different peak parking times for different l<strong>and</strong> uses to<br />
maximize parking utilization<br />
throughout the day (Table 28).<br />
The most successful shared<br />
parking garages capitalize on<br />
different peak parking times.<br />
For example, peak usage for<br />
Table 28: Peak Parking Periods by L<strong>and</strong> Use<br />
Weekday Peak Evening Peak Weekend Peak<br />
Banks, schools, factories,<br />
medical clinics, offices<br />
Auditoriums, bars, restaurants,<br />
theaters, meeting halls<br />
Religious institutions, parks,<br />
shops, malls<br />
Source: MacArthur BART Transit Village Shared Parking<br />
transit Park & Rides occur on weekdays between morning <strong>and</strong> afternoon peak periods. The<br />
most successful shared parking garage with transit parking would include l<strong>and</strong> uses that are<br />
not as active during this time period. Evening <strong>and</strong> weekend peak parking l<strong>and</strong> uses (e.g. bars,<br />
restaurants, theaters, shops, <strong>and</strong> religious institutions) are more <strong>com</strong>patible with transit parking<br />
than weekday peak l<strong>and</strong> uses, in particular office <strong>and</strong> residential.<br />
The Rosslyn-Ballston Orange Line Corridor in Arlington County is a noted example of shared<br />
parking within the region. No transit parking is provided at any of these five <strong>Metro</strong>rail stations,<br />
but all have publicly-available parking nearby that is used by some <strong>Metro</strong>rail passengers (Park &<br />
Ride mode shares at these stations ranged from 3.7 percent at Rosslyn to 7.6 percent at Ballston<br />
<strong>and</strong> 7.8 percent at Virginia Square in the 2007 <strong>Metro</strong>rail Passenger Survey) Though not privately<br />
owned, Arlington County constructed a shared garage south of Ballston-MU <strong>Station</strong> for use by<br />
63 | <strong>Station</strong> Re<strong>com</strong>mendations
office workers, shoppers, <strong>and</strong> <strong>com</strong>muters alike. Market rate fees are charged on an hourly basis<br />
<strong>and</strong> range from $1 for the first three hours to $10 for more than eight hours. For a <strong>Metro</strong>rail<br />
<strong>com</strong>muter who parks all day, these fees are higher than what he or she would pay at a <strong>Metro</strong>operated<br />
Park & Ride facility. Weekday-only monthly passes are available for $105.<br />
Advantages<br />
• Construction costs are absorbed by the developer<br />
• Reduces amount of overall parking by sharing spaces through l<strong>and</strong> uses with different<br />
peaking patterns (e.g. transit parking in the morning <strong>and</strong> early afternoon, retail in the<br />
evening)<br />
• Reduces the amount of l<strong>and</strong> devoted to parking<br />
• Potentially provides space for a Bike & Ride facility similar to College Park-U of MD <strong>Station</strong><br />
• Ability to prioritize access according to <strong>Metro</strong>’s hierarchy by placing bus bays, a Kiss &<br />
Ride, <strong>and</strong>/or a potential Bike & Ride on the lower levels for quicker access to the station<br />
entrance<br />
• Possible retail frontage along street-facing sides of the garage<br />
Disadvantages<br />
• No set number of transit parking spaces<br />
• Difficult to share transit parking with residential <strong>and</strong> office l<strong>and</strong> uses<br />
• May be difficult to fit bus bays <strong>and</strong> layover space<br />
Satellite Parking Lot(s) with Bus/Shuttle Service<br />
Satellite lots provide off-site parking located relatively closely to a <strong>Metro</strong>rail station. Satellite<br />
lots are useful for stations that lack available l<strong>and</strong> for parking or cannot exp<strong>and</strong> existing parking<br />
facilities. Ideally, satellite parking should be located along an existing bus route that connects to<br />
the station so that individuals do not only rely on carpools or vanpools. If there are no bus routes<br />
nearby, satellite lots can be constructed with feeder bus or shuttle service directly to the station.<br />
Parking at satellite lots is usually free of charge, but some require permits <strong>and</strong> fees. Feeder<br />
transit services to the <strong>Metro</strong>rail station <strong>and</strong> back almost always require a fare if provided on a<br />
regular revenue route, but could be offered as a free service if provided through a special shuttle.<br />
This strategy includes two types of <strong>com</strong>mon satellite lots that serve transit stations: publiclyowned<br />
or shared-use lots. Publicly-owned satellite lots are owned <strong>and</strong> maintained by the<br />
local government, most likely the county in which the parking lot is located. In the context of<br />
<strong>Naylor</strong> <strong>Road</strong> <strong>Station</strong>, Prince George’s County is likely the only feasible public owner/operator<br />
of future satellite lots. With a shared-use lot, a local government or transit agency will lease a<br />
private parking lot for use by transit customers during specific periods of time. Churches are<br />
often favored for shared-use agreements because their parking is underutilized throughout<br />
most of the week. Large shopping centers with plentiful parking are also good c<strong>and</strong>idates for<br />
satellite lots because peak retail usage times (afternoon <strong>and</strong> evening) generally do not overlap<br />
with periods of peak transit parking occupancy (morning <strong>and</strong> midday). Figure 56 <strong>and</strong> Table<br />
29 identify potential shared-use satellite lots along the southern Green Line. Note that some of<br />
these potential shared-use lot locations are zoned M-X-T, increasing the likelihood that they will<br />
be redeveloped by 2040. Additional locations farther from Green Line stations would need to be<br />
identified if these proposed parcels are selected for use as satellite lots <strong>and</strong> later redevelop.<br />
<strong>Naylor</strong> <strong>Road</strong> <strong>Metro</strong> <strong>Station</strong> <strong>Area</strong> <strong>Access</strong> <strong>and</strong> <strong>Capacity</strong> Study | 64
Figure 56: Potential Shared-Use Satellite Parking Lots<br />
<strong>Naylor</strong> <strong>Road</strong> <strong>Station</strong><br />
Pennsylvania <strong>Station</strong> Shops<br />
Sam’s Plaza<br />
Suitl<strong>and</strong> <strong>Station</strong><br />
Spirit of Faith Christian Center<br />
Southern Avenue <strong>Station</strong><br />
Iverson Mall<br />
Marlow Heights Shopping Center<br />
Victory Christian Ministries<br />
Potential Shared-Use Satellite<br />
Lot Located in C-S-C Zone<br />
Potential Shared-Use Satellite<br />
Lot Located in M-X-T Zone<br />
Green Line<br />
<strong>Station</strong> Entrance<br />
N<br />
0 0.5 miles<br />
Source: Google Earth (aerial)<br />
65 | <strong>Station</strong> Re<strong>com</strong>mendations
Page intentionally left blank<br />
<strong>Naylor</strong> <strong>Road</strong> <strong>Metro</strong> <strong>Station</strong> <strong>Area</strong> <strong>Access</strong> <strong>and</strong> <strong>Capacity</strong> Study | 66
Multiple examples of satellite lots are found throughout the metropolitan Washington region.<br />
The Prince George’s County-owned Clinton Park & Ride Lot serves the southern Green Line<br />
with 100 parking spaces <strong>and</strong> direct bus service to Branch Avenue <strong>and</strong> <strong>Naylor</strong> <strong>Road</strong> stations.<br />
Prince George’s County includes several examples of shared-use satellite lots as well: Capital<br />
Plaza in L<strong>and</strong>over, Eastover Shopping Center in Oxon Hill, <strong>and</strong> Penn-Mar Shopping Center<br />
in Forestville. The <strong>Metro</strong>rail <strong>Station</strong> <strong>Access</strong> Alternatives Study found that several transit agencies<br />
nationwide have implemented successful shared-use satellite lots with dedicated feeder<br />
services, including Metra (Chicago, Illinois), Orange County Transit Authority (suburban Los<br />
Angeles, California), <strong>and</strong> Sound Transit (Seattle, Washington). The study concluded that such<br />
configurations were most successful at stations with overwhelming dem<strong>and</strong> for parking <strong>and</strong><br />
high quality feeder services.<br />
Advantages<br />
• Exp<strong>and</strong>s developable station area if on-site parking is shifted to satellite lots<br />
• Increased utilization of existing underused parking near the station<br />
• Disperses traffic if multiple satellite lots are used<br />
• Can increase bus ridership<br />
Disadvantages<br />
• Limited availability of l<strong>and</strong> for new satellite lots near <strong>Metro</strong>rail stations<br />
• Requires an additional transfer to reach final destination<br />
• Additional expense for local governments to construct <strong>and</strong>/or maintain facility<br />
• Potential additional expense for transit agency if new or improved bus/shuttle service is<br />
required<br />
• Parking is limited to certain time periods for lots with shared-use agreements<br />
• Local <strong>com</strong>munities may oppose additional parking<br />
• Contractual hurdles to over<strong>com</strong>e in setting up shared-use agreements.<br />
Table 29: Potential Shared-Use Satellite Parking Lots<br />
Nearest<br />
<strong>Station</strong> Location<br />
Approximate<br />
Parking Spaces<br />
Adjacent<br />
Bus Routes<br />
Zoning<br />
Southern Avenue Spirit of Faith Christian Center<br />
2261 Oxon Run Drive<br />
Temple Hills, MD 20748<br />
+/- 300 spaces - Commercial Shopping Center<br />
(C-S-C)<br />
<strong>Naylor</strong> <strong>Road</strong><br />
Suitl<strong>and</strong><br />
Sam’s Plaza<br />
3401-37 Branch Avenue<br />
Temple Hills, MD 20748<br />
Iverson Mall<br />
3701 Branch Avenue<br />
Temple Hills, MD 20748<br />
Marlow Heights Shopping Center<br />
3901 Branch Avenue<br />
Temple Hills, MD 20748<br />
Victory Christian Ministries<br />
3911 Saint Barnabas <strong>Road</strong><br />
Suitl<strong>and</strong>, MD 20746<br />
Pennsylvania <strong>Station</strong> Shops<br />
5550 Silver Hill <strong>Road</strong><br />
District Heights, MD 20747<br />
+/- 50 spaces <strong>Metro</strong>bus: C14, H11,<br />
H12, H13<br />
+/- 3,000 surface<br />
+/- 300 covered<br />
<strong>Metro</strong>bus: C12, P12<br />
TheBus: 32<br />
+/- 1,000 surface <strong>Metro</strong>bus: C12, C14,<br />
D12, H11, H12, H13<br />
+/- 300 spaces <strong>Metro</strong>bus: C12, D12,<br />
H13<br />
+/- 50 spaces <strong>Metro</strong>bus: K11, K12,<br />
K13, P12<br />
Mixed-Use Transportation Oriented<br />
(M-X-T)<br />
Mixed-Use Transportation Oriented<br />
(M-X-T)<br />
Mixed-Use Transportation Oriented<br />
(M-X-T)<br />
Mixed-Use Transportation Oriented<br />
(M-X-T)<br />
Commercial Shopping Center<br />
(C-S-C)<br />
67 | <strong>Station</strong> Re<strong>com</strong>mendations
Add Parking to Other Southern Green Line <strong>Station</strong>s<br />
If daily parking at <strong>Naylor</strong> <strong>Road</strong> <strong>Station</strong> were to be removed it could be offset by adding an equal<br />
number of parking spaces to other southern Green Line <strong>Station</strong>s. The parking facilities of <strong>Naylor</strong><br />
<strong>Road</strong> <strong>Station</strong> (368 spaces) would in theory constitute a modest increase at the other Green Line<br />
<strong>Station</strong>s with much larger existing parking facilities: Southern Avenue (1,980 spaces), Suitl<strong>and</strong><br />
(1,890 spaces), <strong>and</strong> Branch Avenue (3,072). While this strategy maintains the same overall<br />
number of parking spaces along the southern Green Line, implementing additional parking at<br />
other stations would pose challenges.<br />
The Southern Avenue <strong>Station</strong> footprint is large enough to ac<strong>com</strong>modate additional Park & Ride<br />
capacity. About half of the station area is already consumed by a large parking garage. The other<br />
half contains surface lots that could be converted into additional structured parking. However,<br />
the station lacks quick <strong>and</strong> convenient access to limited-access highways like Suitl<strong>and</strong> Parkway<br />
<strong>and</strong> I-495, making it a less-desirable transfer destination for Park & Ride passengers. The<br />
Suitl<strong>and</strong> <strong>Station</strong> footprint is already mostly occupied by structured parking <strong>and</strong> opportunities to<br />
add more daily parking would be limited <strong>and</strong> likely more expensive than other southern Green<br />
Line <strong>Station</strong>s. The Branch Avenue <strong>Station</strong> footprint has the most usable space of all these options<br />
as a result of surface parking. However, the station has long been considered a prime c<strong>and</strong>idate<br />
for joint development (see <strong>Metro</strong>’s 2010 Branch Avenue <strong>Station</strong> <strong>Access</strong> <strong>and</strong> Joint Development Study).<br />
Additional Park & Ride capacity could be incorporated into the parking replacement at the<br />
Branch Avenue station as part of a future Branch Avenue TOD redevelopment.<br />
Advantages<br />
• Exp<strong>and</strong>s developable area at <strong>Naylor</strong> <strong>Road</strong> <strong>Station</strong> if on-site parking is removed<br />
• Maintains current amount of southern Green Line parking<br />
Disadvantages<br />
• Capital costs of constructing new structured parking<br />
• Limited options for additional parking on southern Green Line<br />
• Local <strong>com</strong>munities may oppose additional parking<br />
• Ac<strong>com</strong>modating additional traffic near other stations<br />
• Absorbing additional passenger volume within other stations at entrances, mezzanines, <strong>and</strong><br />
on platforms<br />
Real-Time Parking Information<br />
Real-time parking information notifies motorists of parking availability. Such information is<br />
updated on a continual basis as parking supply fluctuates throughout the day. Basic real-time<br />
parking information systems can be as simple as electronic signs at Park & Ride entrances<br />
that warn motorists of a full garage. These simple systems reduce time wasted searching for a<br />
parking space, but are less effective <strong>com</strong>pared to more sophisticated systems because they only<br />
interact with the transit customer once a driving trip has already begun. More <strong>com</strong>plex systems<br />
provide up-to-date digital information that is viewable on <strong>com</strong>puters <strong>and</strong> other mobile devices.<br />
Such systems are more effective because they can reduce driving trips. Motorists may view<br />
real-time parking information before beginning their trip <strong>and</strong> decide that an alternative mode<br />
of access is faster because parking at the nearest station is already full. <strong>Metro</strong> is currently testing<br />
a real-time parking information system for Fort Totten <strong>and</strong> Rockville <strong>Station</strong> metered parking<br />
<strong>Naylor</strong> <strong>Road</strong> <strong>Metro</strong> <strong>Station</strong> <strong>Area</strong> <strong>Access</strong> <strong>and</strong> <strong>Capacity</strong> Study | 68
(Kiss & Ride) <strong>and</strong> at one of Vienna <strong>Station</strong>’s <strong>com</strong>muter surface lots. This pilot project, which<br />
began in July 2012, provides hourly parking occupancy data (both available <strong>and</strong> in-use spaces)<br />
as well as historical occupancy averages online. In addition, Vienna <strong>Station</strong>’s participant surface<br />
lot features a real-time electronic “lot full” entrance sign.<br />
Advantages<br />
• Reduces time spent searching for a space<br />
• Encourages alternative modes of access<br />
• Promotes more efficient use of systemwide parking resources<br />
• Low capital costs <strong>com</strong>pared to building new parking facilities<br />
• Creates a foundation for dynamic pricing<br />
Disadvantages<br />
• Testing <strong>and</strong> roll-out period for more advanced information systems<br />
• System maintenance<br />
Preferred Carpool Parking <strong>and</strong> Discounts<br />
Carpooling allows for greater use of limited parking facilities by serving more transit customers<br />
with the same number of parking spaces. The <strong>Metro</strong>rail <strong>Station</strong> <strong>Access</strong> Alternatives Study observed<br />
that Bay <strong>Area</strong> Rapid Transit (San Francisco, California) <strong>and</strong> Tri-Met (Portl<strong>and</strong>, Oregon) have<br />
incentivized carpooling through preferred, designated parking spots <strong>and</strong> even discounts on<br />
parking fees. Montgomery County operates a similar program in the Silver Spring District.<br />
At these garages within Silver Spring, priority carpool spaces are available until 9:30 AM <strong>and</strong><br />
carpoolers can register for reduced monthly parking fees, which decrease as carpool sizes<br />
increase. For example, monthly parking fees start at $113 per month for a single-occupant<br />
vehicle, but are as little as $10 per month for a five-person carpool. Some restrictions apply, <strong>and</strong><br />
Montgomery County requires all members of the carpool to register to reduce fraud.<br />
Advantages<br />
• Increased utilization of limited parking capacity<br />
• Can increase rail ridership<br />
Disadvantages<br />
• Potential for carpool parking pass fraud<br />
• Required management <strong>and</strong> enforcement of carpool discount program<br />
• Most successful along corridors with high-occupancy vehicle (HOV) interstate lanes<br />
Enhanced Bus Connectivity<br />
Bus ridership is already very high at <strong>Naylor</strong> <strong>Road</strong> <strong>Station</strong>, <strong>and</strong> it is estimated to continue to grow<br />
into the future. Capitalizing on this growing dem<strong>and</strong> with improved bus service would improve<br />
the convenience for existing passengers <strong>and</strong> help attract new riders. Enhancing bus connectivity<br />
can be achieved by increasing bus frequency, realigning routes to better serve passengers in a<br />
timelier manner, <strong>and</strong>/or adding new routes. Implementing lower-cost neighborhood circulator<br />
service may attract additional riders that would have otherwise driven to <strong>Naylor</strong> <strong>Road</strong> <strong>Station</strong>.<br />
Hillcrest Heights south of the station would benefit the most from neighborhood circulator, as<br />
other nearby neighborhoods are well served by existing transit.<br />
69 | <strong>Station</strong> Re<strong>com</strong>mendations
Advantages<br />
• Increases convenience for existing bus passengers<br />
• Encourages Park & Ride customers to take the bus<br />
• Attracts new bus riders<br />
• Can increase rail ridership<br />
Disadvantages<br />
• Increases capital <strong>and</strong> operating costs of new <strong>and</strong> enhanced bus services<br />
• Potential service cuts during poor economic conditions<br />
Options<br />
Options are groups of strategies designed to achieve one of the following out<strong>com</strong>es: shift,<br />
replace, or exp<strong>and</strong> parking. This study recognizes that there are multiple approaches to<br />
achieving these out<strong>com</strong>es, <strong>and</strong> presents nine total options (Table 30). The goal for each option<br />
is to balance Park & Ride access dem<strong>and</strong> with <strong>Naylor</strong> <strong>Road</strong> <strong>Station</strong>’s future as a TOD regional<br />
center. Assumptions previously outlined apply to all options, including that existing station<br />
area pedestrian <strong>and</strong> bicycle re<strong>com</strong>mendations will be addressed in the final TOD site plan.<br />
Note that enhanced bus connectivity is a strategy in every option. Regardless of which option is<br />
pursued for <strong>Naylor</strong> <strong>Road</strong> <strong>Station</strong>, bus connectivity should be enhanced to meet estimated future<br />
dem<strong>and</strong>. Enhanced bus services would further energize the station area with opportunities<br />
for further activity outside the peak periods, something that the peak-only nature of a Park &<br />
Ride facility would not provide. As shown in Figure 57, bus transfers to <strong>Metro</strong>rail are not as<br />
heavily concentrated in the morning peak as Park & Ride passengers, nor as concentrated in the<br />
afternoon peak as passengers who arrive by walking.<br />
Table 30: Summary of Options<br />
Strategies<br />
All-in-one access facility (bicycle, bus, Kiss & Ride,<br />
<strong>and</strong>/or Park & Ride within the same garage)<br />
Developer-constructed garage with reserved transit<br />
parking in a mixed-use building<br />
Developer-constructed parking garage with shared<br />
transit parking in a mixed-use building<br />
Publicly-owned satellite parking facility with feeder<br />
transit service to Green Line stations<br />
Satellite parking through shared-use agreements with<br />
feeder transit service to Green Line stations<br />
Additional parking to other Green Line stations<br />
Out<strong>com</strong>es<br />
Shift Parking Replace Parking Exp<strong>and</strong> Parking<br />
Options<br />
A1 A2 A3 B1 B2 B3 C1 C2 C3<br />
Real-time parking information<br />
Preferred carpool parking <strong>and</strong>/or discounts<br />
Enhanced bus connectivity<br />
<strong>Naylor</strong> <strong>Road</strong> <strong>Metro</strong> <strong>Station</strong> <strong>Area</strong> <strong>Access</strong> <strong>and</strong> <strong>Capacity</strong> Study | 70
Out<strong>com</strong>e A: Shift Parking<br />
Option A1: Exp<strong>and</strong>ed Parking<br />
at Other Southern Green Line<br />
<strong>Station</strong>s<br />
Option A1 proposes removing<br />
the existing Park & Ride lot to<br />
ac<strong>com</strong>modate planned joint<br />
development. To offset the loss<br />
of 368 parking spaces, this option<br />
proposes enhanced bus connectivity<br />
<strong>and</strong> replacing lost parking by adding<br />
an equivalent number of daily<br />
parking spaces to other southern<br />
Figure 57: Daily Distribution of Trips (Systemwide)<br />
100%<br />
18%<br />
80%<br />
50%<br />
20%<br />
71%<br />
60%<br />
40%<br />
20%<br />
Green Line stations. As previously noted, implementing additional parking at other stations may<br />
be undesirable.<br />
0%<br />
17%<br />
10%<br />
Park & Ride<br />
21%<br />
21%<br />
3% 8%<br />
Source: 2007 <strong>Metro</strong>rail Passenger Survey<br />
Bus (<strong>Metro</strong>bus <strong>and</strong><br />
TheBus only)<br />
47%<br />
15%<br />
Walk<br />
AM Peak<br />
AM Off-Peak<br />
PM Peak<br />
PM Off-Peak<br />
Option A2: Publicly-Owned Satellite Parking<br />
Similar to Option A1, Option A2 proposes removing the existing Park & Ride lot to<br />
ac<strong>com</strong>modate joint development <strong>and</strong> partially offsetting the loss of 368 parking spaces with<br />
enhanced bus connectivity. However, instead of adding Park & Ride capacity to other southern<br />
Green Line stations as in Option A1, Option A2 proposes constructing publicly-owned satellite<br />
parking with feeder transit service to the closest Green Line stations. Locating undeveloped l<strong>and</strong><br />
that is close for additional satellite parking may be difficult.<br />
Option A3: Shared-Use Satellite Parking<br />
Option A3 is almost identical to Option A2. However, Option A3 proposes additional satellite<br />
parking under shared-use agreements for existing parking lots. This report previously identified<br />
several locations for potential shared-use satellite lots, including Spirit of Faith Christian Center,<br />
Sam’s Plaza, Iverson Mall, Marlow Heights Shopping Center, Victory Christian Ministries, <strong>and</strong><br />
Penn <strong>Station</strong> Shops. Note that some of these lots are located closer to Green Line stations other<br />
than <strong>Naylor</strong> <strong>Road</strong> <strong>Station</strong>. Some of these lots are also along existing bus routes.<br />
Out<strong>com</strong>e B: Replace Parking<br />
Option B1: <strong>Metro</strong>-Owned All-In-One Garage<br />
Option B1 proposes removing the existing Park & Ride surface lot <strong>and</strong> replacing an<br />
equivalent number of daily parking spaces with a <strong>Metro</strong>-owned <strong>and</strong> operated garage that also<br />
ac<strong>com</strong>modates bicycle parking, buses, <strong>and</strong>/or Kiss & Ride. Unifying several station area facilities<br />
into one structure would greatly exp<strong>and</strong> developable l<strong>and</strong>. The total number of daily parking<br />
spaces would remain below unconstrained future dem<strong>and</strong> for parking at <strong>Naylor</strong> <strong>Road</strong> <strong>Station</strong>.<br />
Option B1 proposes maximizing the use of limited parking with preferred carpool spaces <strong>and</strong>/<br />
or carpool discounts. Real-time parking information <strong>and</strong> enhanced bus service to <strong>Naylor</strong> <strong>Road</strong><br />
<strong>Station</strong> would <strong>com</strong>plement efforts to encourage <strong>Metro</strong>rail customers to arrive via alternative<br />
modes of transportation.<br />
71 | <strong>Station</strong> Re<strong>com</strong>mendations
Option B2: Developer-Owned All-In-One Garage with Reserved Transit Parking<br />
Option B2 includes the same strategies in Option B1, except that the all-in-one garage would<br />
be constructed <strong>and</strong> operated by a developer as part of a mixed-use development. Option<br />
B2 proposes that this garage reserve an equivalent number of parking spaces for <strong>Metro</strong>rail<br />
customers as was available before redevelopment (368 spaces). Other parking in the garage<br />
would be reserved for other uses or available for public use for a fee. Pricing <strong>and</strong> enforcement<br />
for public parking would be important aspects for this garage because of the high dem<strong>and</strong><br />
for daily transit parking at <strong>Naylor</strong> <strong>Road</strong> <strong>Station</strong>. <strong>Metro</strong> <strong>and</strong> the garage owner would need to<br />
develop effective pricing <strong>and</strong> enforcement strategies to discourage transit customers from<br />
occupying parking spaces intended for uses related to the adjacent building(s).<br />
Option B3: Developer-Owned All-In-One Garage with Shared Transit Parking<br />
Option B3, like Option B2, proposes an all-in-one garage constructed <strong>and</strong> operated by a<br />
developer as part of a mixed-use building. However, Option B3 proposes shared transit parking<br />
for the entire garage rather than reserved transit parking. Transit parking is not reserved<br />
under a shared arrangement, but <strong>Metro</strong>rail customers could park in any space. Motorists who<br />
parks at the station would pay market rate, which could be more expensive than <strong>Metro</strong>’s daily<br />
parking rate. A shared parking arrangement for use by <strong>Metro</strong>rail would work best with evening<br />
<strong>and</strong> weekend peak parking l<strong>and</strong> uses (e.g. bars, restaurants, theaters, shops, <strong>and</strong> religious<br />
institutions). Aside from the operations of the all-in-one garage, Option B3 also proposes the<br />
same strategies as Option B1 <strong>and</strong> B2.<br />
Out<strong>com</strong>e C: Exp<strong>and</strong> Parking<br />
Option C1: Combined Options A1 <strong>and</strong> B1<br />
Option C1 proposes exp<strong>and</strong>ing parking by implementing almost all strategies from Options<br />
A1 <strong>and</strong> B1. More specifically, Option C1 proposes removing the existing <strong>Naylor</strong> <strong>Road</strong> Park &<br />
Ride <strong>and</strong> replacing it with a <strong>Metro</strong>-operated all-in-one parking garage with real-time parking<br />
information <strong>and</strong> preferred carpool spaces <strong>and</strong> discounts. This option also proposes additional<br />
parking to other southern Green Line stations.<br />
Option C2: Combined Options A2 <strong>and</strong> B1<br />
Option C2 is similar to Option C1, except that it proposes publicly-owned satellite parking<br />
with feeder transit service instead of additional southern Green Line station parking. Option<br />
C2 would thus exp<strong>and</strong> parking with off-site satellite lots in addition to an on-site <strong>Metro</strong>-owned<br />
all-in-one garage to replace existing Park & Ride capacity. Similar to Option C1, Option C2<br />
proposes real-time parking information <strong>and</strong> preferred carpool spaces <strong>and</strong> discounts for the new<br />
garage.<br />
Option C3: Combined Options A3 <strong>and</strong> B1<br />
Similar to Option C2, Option C3 proposes shared-use satellite lots with feeder transit service. An<br />
on-site <strong>Metro</strong>-owned all-in-one parking garage would replace existing Park & Ride capacity at<br />
<strong>Naylor</strong> <strong>Road</strong> <strong>Station</strong> to exp<strong>and</strong> developable l<strong>and</strong>. Similar to Option C1, Option C3 proposes realtime<br />
parking information <strong>and</strong> preferred carpool spaces <strong>and</strong> discounts for the new garage.<br />
<strong>Naylor</strong> <strong>Road</strong> <strong>Metro</strong> <strong>Station</strong> <strong>Area</strong> <strong>Access</strong> <strong>and</strong> <strong>Capacity</strong> Study | 72
Location Considerations for <strong>Access</strong> Facilities<br />
Construction of new, permanent station area access facilities will be located on l<strong>and</strong> currently<br />
occupied by existing facilities. As a result, the <strong>Naylor</strong> <strong>Road</strong> <strong>Station</strong> area will likely require<br />
temporary relocation of these facilities to maintain access during implementation of the station<br />
area site plan. The potential locations of both permanent <strong>and</strong> temporary access facilities are<br />
governed by <strong>Metro</strong>’s <strong>Station</strong> Site <strong>and</strong> <strong>Access</strong> Planning Manual, which sets guidelines for maximum<br />
allowable walking distances between station facilities <strong>and</strong> entrance (Figure 58).<br />
The distances highlighted in Figure 58 are in accordance to <strong>Metro</strong>’s station access hierarchy.<br />
Maximum walking distances to the station entrance are shortest for access modes prioritized<br />
by this hierarchy. Bus bay facilities can be no farther than 500 feet from the station entrance<br />
<strong>and</strong> the farthest Kiss & Ride space must be within 600 feet. Park & Ride spaces, which have the<br />
lowest priority, can be located as far as 1,500 feet from the station entrance. These distances <strong>and</strong><br />
other constraints in the <strong>Naylor</strong> <strong>Road</strong> <strong>Area</strong> provide a spatial framework for possible locations of<br />
station access facilities, as shown in Figure 59. Most of the l<strong>and</strong> within the maximum allowable<br />
walking distances from the station entrance for new temporary <strong>and</strong> permanent access facilities is<br />
unavailable due to constraints such as existing residential areas, federal l<strong>and</strong>, <strong>and</strong> parkl<strong>and</strong>. All<br />
potentially available l<strong>and</strong> is located south of the Green Line tracks <strong>and</strong> corresponds closely with<br />
the new M-X-T zoning devised in the Branch Avenue Corridor Sector Plan.<br />
Four potential locations for station-access facilities remain once constraints are taken into<br />
consideration, as shown in Figure 60. Location 1 is split into three separate sub-locations to<br />
reflect the maximum allowable walking distances for facility types (see Table 31). Bus bay <strong>and</strong><br />
Kiss & Ride facilities must be located within the existing station area footprint due to shorter<br />
allowable walking distances for these modes. However, <strong>Metro</strong> could locate a Park & Ride facility<br />
in any of the four potential locations.<br />
Chapter 2: Mode of <strong>Access</strong><br />
Figure FIGURE 58: 2-2: Allowable ALLOWABLE Walking WALKING Distances DISTANCES between <strong>Station</strong> OF Facilities STATION <strong>and</strong> FACILITIES Entrance FROM STATION ENTRANCE<br />
Source: <strong>Station</strong> Site <strong>and</strong> <strong>Access</strong> Planning Manual<br />
NOTE: Distances shown reflect the maximum horizontal distance allowed as measured along the actual pedestrian path. Shorter walking distances are<br />
preferred. Estimated walking times may vary <strong>and</strong> are based on average pedestrian speeds of 4.5 feet per second.<br />
2.1.1 Walkway Widths: The minimum unobstructed walkway<br />
width along bus platforms are provided in Table 2-1.<br />
Additional guidance on required widths for walkways is<br />
provided in Appendix D <strong>and</strong> Table 2-2, which<br />
summarizes site design st<strong>and</strong>ards for several types of<br />
facilities. The Designer should increase the minimum<br />
73 | <strong>Station</strong> unobstructed Re<strong>com</strong>mendations<br />
walkway width along the bus platform<br />
when the platform is <strong>com</strong>bined with other pedestrian<br />
traffic. Refer to Appendix D to calculate the additional<br />
walkway width. Detailed guidelines for station facilities<br />
TABLE2-1: MINIMUM UNOBSTRUCTED WALKWAY<br />
WIDTH ALONG BUS PLATFORM<br />
Number of Bays in Array Minimum Unobstructed<br />
Walkway Width (Feet)<br />
1 6<br />
2 6<br />
3 8<br />
4 8<br />
5 10
Opportunities <strong>and</strong> constraints of each location—for example the existing structures <strong>and</strong> station<br />
operations, utilities, topography, l<strong>and</strong> ownership, <strong>com</strong>munity concerns, access facility design<br />
requirements, costs, <strong>and</strong> final station area site plan <strong>and</strong> implementation timeline for joint<br />
development, among others—should be considered during the site selection <strong>and</strong> design phase<br />
for temporary <strong>and</strong> permanent access facilities. Though this study does not re<strong>com</strong>mend specific<br />
facility locations, schematics, or designs, Table 31 highlights where <strong>Metro</strong> could potentially<br />
construct facilities as well as some general considerations for each site. The most <strong>com</strong>mon<br />
constraints for Locations 2, 3, <strong>and</strong> 4 include costs to purchase additional l<strong>and</strong>, impacts to existing<br />
businesses, <strong>and</strong> forcing customers to cross busy roadways. Location 1 is closer to the station<br />
entrance <strong>and</strong> <strong>Metro</strong> already owns much of this l<strong>and</strong>. However, Location 1 will be the focal<br />
point for joint development <strong>and</strong> the actual availability of l<strong>and</strong> may be constrained once a final<br />
site plan is defined. Note that each location is large <strong>and</strong> would allow for many different facility<br />
configurations. Narrowing down the specific facility setting within any of the four general<br />
locations is reserved for more detailed planning <strong>and</strong> design at a later date.<br />
Figure 59: Constraints for Potential <strong>Station</strong> <strong>Access</strong> Facility Locations<br />
<strong>Naylor</strong> Rd<br />
Suitl<strong>and</strong> Pkwy<br />
Southern Ave<br />
Maximum Allowable Distances<br />
Bus Bays (500’)<br />
Kiss & Ride (600’)<br />
Park & Ride (1,500’)<br />
Unavailable L<strong>and</strong><br />
<strong>Station</strong> Entrance<br />
Oxon Run Dr<br />
<strong>Naylor</strong> Rd<br />
Branch Ave<br />
N<br />
0 500’<br />
Source: Google Earth (aerial)<br />
<strong>Naylor</strong> <strong>Road</strong> <strong>Metro</strong> <strong>Station</strong> <strong>Area</strong> <strong>Access</strong> <strong>and</strong> <strong>Capacity</strong> Study | 74
Table 31: Opportunities <strong>and</strong> Constraints of Potential <strong>Station</strong>-<strong>Access</strong> Facility Locations<br />
Figure<br />
60 Map<br />
Based on Maximum Allowable<br />
Walking Distance to <strong>Station</strong> Entrance<br />
ID Bus Bays Kiss & Ride Park & Ride Opportunities Constraints<br />
1A – Proximity to station entrance<br />
– <strong>Metro</strong> owns most of the l<strong>and</strong><br />
– Impacts existing station access facilities<br />
– Impacts existing business<br />
– L<strong>and</strong> purchase may be required<br />
1B – Proximity to station entrance<br />
– <strong>Metro</strong> owns most of the l<strong>and</strong><br />
1C – Does not impact operations of<br />
existing access facilities<br />
2 – Does not impact operations of<br />
existing access facilities<br />
– Vehicular traffic reduced at <strong>Naylor</strong><br />
<strong>Road</strong> roundabouts<br />
3 – Does not impact operations of<br />
existing access facilities<br />
4 – Does not impact operations of existing<br />
access facilities<br />
– Customers have a history of parking at<br />
this location<br />
– Impacts existing station access facilities<br />
– Impacts existing business<br />
– L<strong>and</strong> purchase may be required<br />
– Impacts existing businesses<br />
– L<strong>and</strong> purchase required<br />
– Customers must cross Branch Avenue<br />
– Impacts existing businesses<br />
– L<strong>and</strong> purchase required<br />
– Most likely redeveloped first<br />
– Customers must cross <strong>Naylor</strong> <strong>Road</strong><br />
– Impacts existing business<br />
– L<strong>and</strong> purchase required<br />
– Relatively narrow with steep topography<br />
– Adjacent to existing residential area<br />
– Non-st<strong>and</strong>ard size parking garage<br />
– Constrained vehicular access<br />
– Customers must cross <strong>Naylor</strong> <strong>Road</strong><br />
– Impacts existing business<br />
– L<strong>and</strong> purchase required<br />
– Adjacent to existing residential area<br />
Figure 60: Potential <strong>Station</strong> <strong>Access</strong> Facility Locations<br />
Potential <strong>Station</strong>-<strong>Access</strong><br />
Facility Locations<br />
<strong>Station</strong> Entrance<br />
Suitl<strong>and</strong> Pkwy<br />
N<br />
0 500’<br />
<strong>Naylor</strong> Rd<br />
Oxon Run Dr<br />
4<br />
1A 2<br />
1B<br />
1C<br />
3<br />
Branch Ave<br />
75 | <strong>Station</strong> Re<strong>com</strong>mendations
Appendices<br />
Appendix 1: References<br />
Alameda County Congestion Management Agency, MacArthur BART Transit Village Shared<br />
Parking, 2007<br />
District of Columbia, District of Columbia Bicycle Master Plan, 2005<br />
FHWA, Manual on Uniform Traffic Control Devices, 2009<br />
<strong>Metro</strong>, Branch Avenue <strong>Station</strong> <strong>Access</strong> <strong>and</strong> Joint Development Study, 2010<br />
<strong>Metro</strong>, Glenmont <strong>Station</strong> <strong>Access</strong> Improvement Study, 2012<br />
<strong>Metro</strong>, Guidelines: Design <strong>and</strong> Placement of Transit Stops, 2009<br />
<strong>Metro</strong>, <strong>Metro</strong>rail Bicycle <strong>and</strong> Pedestrian <strong>Access</strong> Improvement Study, 2010<br />
<strong>Metro</strong>, <strong>Metro</strong>rail Passenger Survey, 2007<br />
<strong>Metro</strong>, Pedestrian <strong>and</strong> Bicycle Element of 2012-2017 Capital Improvement Program, 2011<br />
<strong>Metro</strong>, Shuttle Services at <strong>Metro</strong> Facilities, 2011<br />
<strong>Metro</strong>, <strong>Station</strong> Site <strong>and</strong> <strong>Access</strong> Planning Manual, 2008<br />
<strong>Metro</strong>, <strong>Station</strong> <strong>Access</strong> & <strong>Capacity</strong> Study, 2008<br />
M-NCPPC, Preliminary Branch Avenue Corridor Sector Plan <strong>and</strong> Sectional Map Amendment, 2008<br />
M-NCPPC, Countywide Master Plan of Transportation, 2009<br />
M-NCPPC, <strong>Metro</strong> Green Line Corridor Action Plan (ongoing)<br />
M-NCPPC, <strong>Naylor</strong> <strong>Road</strong> <strong>Metro</strong> <strong>Station</strong> <strong>Area</strong> <strong>Access</strong>ibility Study, 2011<br />
MWCOG, <strong>Metro</strong>rail <strong>Station</strong> <strong>Access</strong> Alternatives Study, 2012<br />
MWCOG, Regional Bus Study, 2008<br />
NFPA, NFPA 130: St<strong>and</strong>ard for Fixed Guideway Transit <strong>and</strong> Passenger Rail Systems, 2007<br />
Prince George’s County, Countywide Master Plan of Transportation, 2009<br />
Prince George’s County, Prince George’s County Approved General Plan, 2002<br />
SHA, MD 5 (Branch Avenue) <strong>and</strong> MD 637 (<strong>Naylor</strong> <strong>Road</strong>) Streetscape Improvements (ongoing)<br />
TCRP, TCRP Report 100: Transit <strong>Capacity</strong> <strong>and</strong> Quality of Service Manual, 2003<br />
77 | Appendices
Appendix 2: Nationwide Examples of Multimodal Bus <strong>Station</strong>s<br />
Alewife <strong>Station</strong> (Cambridge, MA)<br />
Alewife <strong>Station</strong>, a MBTA (Massachusetts Bay Transportation Authority) intermodal<br />
transportation hub, is located in Cambridge, Massachusetts. It is the northern terminus of the<br />
MBTA’s Red Line <strong>and</strong> a bus terminal for several local routes <strong>and</strong> one intercity route. This station<br />
features a large five-story Park & Ride facility with 2,733 available parking spaces. The station<br />
connects to local bike paths <strong>and</strong> a secure bike parking area with approximately 174 bicycle<br />
spaces. The mezzanine is located at the main entrance of the station <strong>and</strong> leads up to another level<br />
that features to a bus loop <strong>and</strong> passenger drop-off area.<br />
Cumberl<strong>and</strong> <strong>Station</strong> (Chicago, IL)<br />
Cumberl<strong>and</strong> <strong>Station</strong>, located in Chicago, Illinois, is located on the CTA (Chicago Transit<br />
Authority) Blue Line. The station features two enclosed elevated walkways that enable<br />
pedestrians to access the station from various locations on either side of the highway. The<br />
north walkway leads passengers to a stairway to the ground, while the walkway heading south<br />
leads to a central pavilion, bus terminal, Park & Ride garage, as well as different entrances <strong>and</strong><br />
exits. The parking garage has 1,633 spaces available for use, in addition to indoor <strong>and</strong> sheltered<br />
bicycle parking. Cumberl<strong>and</strong> <strong>Station</strong> provides connections to CTA buses, Pace buses (suburban<br />
network), <strong>and</strong> Greyhound buses.<br />
Figure A-1: Alewife <strong>Station</strong> (Cambridge, MA)<br />
Source: Eric Kilby (Creative Commons)<br />
Source: kbrookes (Creative Commons)<br />
Figure A-2: Cumberl<strong>and</strong> Statioon (Chicago, IL)<br />
Source: Graham Garfield (CTA Collection)<br />
Source: CTA Collection<br />
<strong>Naylor</strong> <strong>Road</strong> <strong>Metro</strong> <strong>Station</strong> <strong>Area</strong> <strong>Access</strong> <strong>and</strong> <strong>Capacity</strong> Study | 78
South Hills Village <strong>Station</strong> (Upper St. Clair, PA)<br />
The South Hills Village <strong>Station</strong> is located in Upper St. Clair, Pennsylvania, situated at the end of<br />
the Pittsburgh Light Rail system’s Red Line. The station also provides a connection to bus route<br />
36 to downtown Pittsburgh. This station features a large parking garage with 2,200 available<br />
spaces as well as bicycle parking. The garage provides direct access to the station through a<br />
sheltered pedestrian foyer. The station itself is located at the center-back (south side) of the first<br />
floor of the garage.<br />
North Springs <strong>Station</strong> (S<strong>and</strong>y Springs, GA)<br />
North Springs <strong>Station</strong> is a part of the <strong>Metro</strong>politan Atlanta Rapid Transit Authority (MARTA)<br />
heavy rail system <strong>and</strong> the northern terminus of the Red Line. This station features a direct exit<br />
<strong>and</strong> entrance to Georgia State Route 400, which allows direct access for motorists north of the<br />
station without having to use surface streets. North Springs <strong>Station</strong> features 14 bike racks in<br />
addition to a large parking garage that features 2,325 daily <strong>and</strong> long-term parking spaces. The<br />
lower level of North Springs <strong>Station</strong> houses the mezzanine as well as a bus-to-rail transfer area,<br />
which serves five connecting bus routes.<br />
Figure A-3: South Hills Village <strong>Station</strong> (Upper St. Clair, PA)<br />
Source: Matt Johnson (Creative Commons)<br />
Source: Google Earth<br />
Figure A-4: North Springs <strong>Station</strong> (S<strong>and</strong>y Springs, GA)<br />
Source: Matt Johnson (Creative Commons)<br />
79 | Appendices
Appendix 3: 2040 Ridership <strong>and</strong> Mode Share<br />
The study team estimated 2040 ridership <strong>and</strong> mode share using the MWCOG travel dem<strong>and</strong><br />
model, which has been updated for the Purple Line project to meet FTA requirements, <strong>and</strong> data<br />
from the 2007 <strong>Metro</strong>rail Passenger Survey. The most recent <strong>Naylor</strong> <strong>Road</strong> <strong>Station</strong> weekday entry<br />
data from May 2012 (3,160 average entries per weekday) served as a base for this mode share<br />
estimate.<br />
The study team first calculated mode share values from the 2007 <strong>Metro</strong>rail Passenger Survey,<br />
which represents the most recent record of ridership by mode. Table A-1 summarizes mode<br />
share values from the 2007 <strong>Metro</strong>rail Passenger Survey. These 2007 mode shares in Table A-1<br />
were applied to the 2012 ridership data to estimate a 2012 entry profile for <strong>Naylor</strong> <strong>Road</strong> <strong>Station</strong>,<br />
shown in Table A-2.<br />
The study team ran the travel dem<strong>and</strong> model using the information from Table A-2, which<br />
resulted in estimated peak <strong>and</strong> off-peak 2040 entries. Peak <strong>and</strong> off-peak period growth factors<br />
for each mode were calculated by <strong>com</strong>paring observed 2012 <strong>and</strong> estimated 2040 entries, as<br />
shown in Table A-3. The model defines the peak period as the <strong>com</strong>bined morning <strong>and</strong> afternoon<br />
peak periods <strong>and</strong> the off-peak<br />
Table A-1: Weekday <strong>Naylor</strong> <strong>Road</strong> <strong>Station</strong> Mode Share from the 2007 <strong>Metro</strong>rail<br />
Passenger Survey (all day)<br />
Category Park & Ride** Kiss & Ride Bus Walk/Bike Total<br />
<strong>Access</strong> <strong>and</strong> Egress 23% 12% 46% 19% 100%<br />
Average*<br />
* <strong>Access</strong> <strong>and</strong> egress are averaged because survey results from the 2007 <strong>Metro</strong>rail Passenger Survey varied<br />
considerably for <strong>Naylor</strong> <strong>Road</strong> <strong>Station</strong>. These varied results are likely due to the small number of <strong>com</strong>pleted<br />
surveys for the station.<br />
** Includes passengers who drove <strong>and</strong> passengers who rode with someone who parked<br />
Table A-2: Estimated 2012 Weekday Mode Share of <strong>Naylor</strong> <strong>Road</strong> <strong>Station</strong> (all day)<br />
Category Park & Ride* Kiss & Ride Bus Walk/Bike Total<br />
Entries 727 379 1,454 600 3,160<br />
Mode Share 23% 12% 46% 19% 100%<br />
* Includes passengers who drove <strong>and</strong> passengers who rode with someone who parked<br />
Table A-3: Model Results<br />
Time of Day Park & Ride* Kiss & Ride Bus Walk/Bike Total<br />
2012 Base<br />
Peak 663 274 1,151 476 2,222<br />
Off-Peak 63 105 302 125 938<br />
Daily 727 379 1,454 600 3,160<br />
Daily Mode Share 23% 12% 46% 19% 100%<br />
2040 Estimate<br />
Peak 646 141 1,556 661 3,004<br />
Off-Peak 169 26 327 491 1,013<br />
Daily 815 167 1,883 1,152 4,017<br />
Daily Mode Share 20% 4% 47% 29% 100%<br />
Growth Factors<br />
Peak -3% -49% 35% 39% 35%<br />
Off-Peak 167% -75% 8% 294% 8%<br />
Daily 12% -56% 30% 92% 27%<br />
* Includes passengers who drove <strong>and</strong> passengers who rode with someone who parked<br />
period as all hours of revenue<br />
service outside of the peak<br />
period.<br />
The travel dem<strong>and</strong> model<br />
outputs Park & Ride, Kiss<br />
& Ride, <strong>and</strong> “walk” mode<br />
shares, but the “walk” mode<br />
share is a sum of walk <strong>and</strong><br />
bus trips. To separate walk<br />
<strong>and</strong> bus trips into two distinct<br />
categories, the study assumed<br />
that bus trips would grow<br />
at the same rate as total<br />
station ridership growth.<br />
The remaining trips from the<br />
model’s “walk” category were<br />
assigned to a distinct walk<br />
category.<br />
Table A-3 summarizes the<br />
2040 entries <strong>and</strong> 2012-to-2040<br />
growth factors for <strong>Naylor</strong><br />
<strong>Road</strong> <strong>Station</strong>. The final row<br />
of Table A-3 highlights the<br />
resulting 2040 daily mode<br />
share estimate.<br />
<strong>Naylor</strong> <strong>Road</strong> <strong>Metro</strong> <strong>Station</strong> <strong>Area</strong> <strong>Access</strong> <strong>and</strong> <strong>Capacity</strong> Study | 80
Appendix 4: Bus Bay Requirements<br />
Determining the number of bus bays required to ac<strong>com</strong>modate future service began with a<br />
calculation of existing utilization rates for each bus bay. Table A-4 shows the calculation of bus<br />
bay requirements by route, <strong>and</strong> Table A-5 shows the rate of utilization by bus bay. Existing peak<br />
hour headways <strong>and</strong> recovery times were derived from data provided by <strong>Metro</strong> <strong>and</strong> TheBus. All<br />
routes include a minimum dwell time of one minute, <strong>and</strong> any scheduled dwell time over one<br />
minute was entered as recovery time.<br />
To estimate at the number of buses that will serve <strong>Naylor</strong> <strong>Road</strong> <strong>Station</strong> during the peak hour in<br />
2040—<strong>and</strong> thus the required number of bus bays—the analysis used the passenger load metric<br />
(see Table A-6), which is equal to the occupancy of the bus at the station. Because the passenger<br />
load includes riders passing through a point as well as those exiting or entering at a point, it<br />
provides a more <strong>com</strong>plete picture of dem<strong>and</strong> for bus service.<br />
The analysis assumed<br />
that the passenger<br />
loads for all routes<br />
that serve at <strong>Naylor</strong><br />
<strong>Road</strong> <strong>Station</strong> are<br />
approximately 35<br />
passengers per<br />
bus. These per-bus<br />
passenger loads<br />
were multiplied by<br />
the number of buses<br />
that serve the station<br />
during the peak<br />
hour (Table A-4), <strong>and</strong><br />
then multiplied by<br />
the percent increase<br />
in peak-period bus<br />
passengers estimated<br />
from the travel dem<strong>and</strong> model. The<br />
result, shown in Table A-6, is a routeby-route<br />
estimate of average peak hour<br />
passenger loads at <strong>Naylor</strong> <strong>Road</strong> <strong>Station</strong><br />
by 2040.<br />
Table A-7 summarizes the estimate of<br />
required <strong>Naylor</strong> <strong>Road</strong> <strong>Station</strong> bus bays<br />
per route by 2040. The number of buses<br />
per peak hour by 2040 is calculated<br />
by dividing the 2040 average peak<br />
hour passenger load by the assumed<br />
capacity of a typical bus, in this case<br />
Table A-4: Existing Bus Bays Required<br />
(A) Peak<br />
Hour<br />
Headway<br />
(minutes)<br />
(B) Buses per<br />
Peak Hour<br />
(C) Average<br />
Recovery<br />
Time<br />
(minutes)<br />
(D) Average<br />
Total Time at<br />
Bay per Bus<br />
(minutes)<br />
(E) Tolerance<br />
Time<br />
(minutes)<br />
(F) Bays<br />
Required<br />
Route<br />
<strong>Metro</strong>bus<br />
M2 20 3.0 3 4 4 0.4<br />
F14 30 2.0 5 6 4 0.3<br />
H11/12/13 15 4.0 6 7 4 0.7<br />
C12/C14 25 2.4 4 5 4 0.4<br />
36 15 4.0 9 10 4 0.9<br />
39 15 4.0 0 1 4 0.3<br />
34 15 4.0 5 6 4 0.7<br />
TheBus<br />
32 30 2.0 8 9 4 0.4<br />
Total 25.0 6.0<br />
D. Average Total Time at Bay per Bus = One-minute dwell time + C<br />
E. Tolerance Time = Accounts for the variation of arrival times (two minutes for through buses <strong>and</strong><br />
four minutes for terminating buses)<br />
F. Bays Required = ((D + E) * B) / 60<br />
Table A-5: Existing Bus Bay Utilization<br />
Bus<br />
Bay<br />
(G) Buses<br />
per Peak<br />
Hour<br />
(H) Total<br />
Time at Bay<br />
(minutes)<br />
(I) Bay<br />
Utilization<br />
Route<br />
Provider<br />
M2 <strong>Metro</strong>bus A 3 24 40%<br />
F14 <strong>Metro</strong>bus B 2 20 33%<br />
Drop off only - C - - -<br />
H11/12/13 <strong>Metro</strong>bus D 4 44 73%<br />
C12/C14 <strong>Metro</strong>bus E 2.4 22 36%<br />
36, 39 <strong>Metro</strong>bus F 8 76 127%<br />
34 <strong>Metro</strong>bus G 4 40 67%<br />
32 TheBus H 2 26 43%<br />
G. Buses per Peak Hour = ∑ B per bay<br />
H. Total Time at Bay = ∑ (B * (D + E)) per bay<br />
I. Bay Utilization = H / 60<br />
81 | Appendices
Table A-6: Average Peak Hour Bus Passenger Loads at <strong>Naylor</strong> <strong>Road</strong> <strong>Station</strong><br />
(Year 2040)<br />
(J) Average<br />
Peak Hour<br />
Passenger Load<br />
per Bus<br />
(K) 2012<br />
Average Peak<br />
Hour Passenger<br />
Load<br />
(L) 2012-<br />
2040 Percent<br />
Increase in Bus<br />
Passengers<br />
(M) 2040<br />
Average Peak<br />
Hour Passenger<br />
Load<br />
Route<br />
<strong>Metro</strong>bus<br />
M2 35 105 35% 142<br />
F14 35 70 35% 95<br />
H11/12/13 35 140 35% 189<br />
C12/C14 35 84 35% 113<br />
36 35 140 35% 189<br />
39 35 140 35% 189<br />
34 35 140 35% 189<br />
TheBus<br />
32 35 70 35% 95<br />
J. Assumed average peak hour passenger load per bus at <strong>Naylor</strong> <strong>Road</strong> <strong>Station</strong><br />
K. 2012 Average Peak Hour Passenger Load = B * J<br />
L. Percent increase in bus passengers taken from Table A-3 in Appendix 3<br />
M. 2040 Average Peak Hour Passenger Load = K * (1+L)<br />
Table A-7: Bus Bays Required (Year 2040)<br />
(N) Buses<br />
per Peak<br />
Hour<br />
(O) Peak<br />
Hour<br />
Headway<br />
(minutes)<br />
(P) Average<br />
Recovery<br />
Time<br />
(minutes)<br />
(Q) Average<br />
Total Time at<br />
Bay per Bus<br />
(minutes)<br />
(R) Bays<br />
Required<br />
Route<br />
<strong>Metro</strong>bus<br />
M2 4 15 3 4 0.5<br />
F14 3 20 5 6 0.5<br />
H11/12/13 5 12 6 7 0.9<br />
C12/C14 3 20 4 5 0.5<br />
36 5 12 9 10 1.2<br />
39 5 12 0 1 0.4<br />
34 5 12 5 6 0.8<br />
TheBus<br />
32 3 20 8 9 0.7<br />
Total 33 7.0<br />
N. Buses per Peak Hour in 2040 = M / 40 (Passenger capacity per bus) [results<br />
were rounded up to the nearest whole number]<br />
O. Peak Hour Headway = 60 / N<br />
Q. Average Total Time at Bay per Bus = One-minute dwell time + P<br />
R. Bays Required by 2040 = ((Q + E) * N) / 60<br />
40 passengers. While some routes<br />
may use articulated buses, using<br />
a 40-passenger-per-bus capacity<br />
provides a more conservative<br />
estimate. To estimate the number<br />
of bays required, the same<br />
methodology employed in Table<br />
A-4 is used in Table A-7. The same<br />
average recovery time from Table A-4<br />
is assumed in Table A-7. However, in<br />
practice several variables are factored<br />
into how much time is allotted per<br />
bus at a terminal stop (e.g. restroom<br />
or meal breaks, scheduling needs,<br />
etc.).<br />
Table A-8 reveals the final<br />
calculations of the analysis to<br />
estimate the bus bay utilization in<br />
2040. Calculations in Table A-8 are<br />
similar to those in Table A-5. Table<br />
A-8 proposes new bus bay route<br />
assignments for seven bays (six<br />
active bays <strong>and</strong> one drop-off bay)<br />
as calculated in Table A-7. Bus bay<br />
utilization in Table A-8 may be above<br />
100 percent, but actual utilization at<br />
these bays will likely be much lower<br />
provided that drivers use designated<br />
layover spaces.<br />
Table A-8: Bus Bay Utilization (Year 2040)<br />
Bus<br />
Bay<br />
(S) Buses<br />
per Peak<br />
Hour<br />
(T) Total<br />
Time at Bay<br />
(minutes)<br />
(U) Bay<br />
Utilization<br />
Route<br />
Provider<br />
M2/C12/C14 <strong>Metro</strong>bus A 7 59 98%<br />
F14/TB32 <strong>Metro</strong>bus, TheBus B 6 69 115%<br />
H11/12/13 <strong>Metro</strong>bus C 5 55 92%<br />
36 <strong>Metro</strong>bus D 5 70 117%<br />
39 <strong>Metro</strong>bus E 5 25 42%<br />
34 <strong>Metro</strong>bus F 5 50 83%<br />
Spare/Drop off - G - - -<br />
S. Buses per Peak Hour = ∑ N per bay<br />
T. Total Time at Bay = ∑ (N * (Q + E)) per bay<br />
U. Bay Utilization = T / 60<br />
<strong>Naylor</strong> <strong>Road</strong> <strong>Metro</strong> <strong>Station</strong> <strong>Area</strong> <strong>Access</strong> <strong>and</strong> <strong>Capacity</strong> Study | 82
Appendix 5: <strong>Station</strong> <strong>Capacity</strong><br />
The 2012 <strong>and</strong> 2040 station capacity is evaluated using st<strong>and</strong>ard inputs for passenger flows<br />
through a variety of station facilities (e.g. faregates, escalators, etc.) <strong>and</strong> other input data, as<br />
summarized in<br />
Table A-9. The<br />
station capacity<br />
analysis plans for<br />
the morning <strong>and</strong><br />
afternoon peak<br />
15-minute period in<br />
years 2012 <strong>and</strong> 2050,<br />
as shown in Tables<br />
A-10 <strong>and</strong> A-11.<br />
Table A-12<br />
summarizes the<br />
station capacity<br />
needs calculated<br />
in Tables A-10 <strong>and</strong><br />
A-11. Circulation<br />
elements at the<br />
existing mezzanine<br />
meet the minimum<br />
requirements for<br />
2012 <strong>and</strong> estimated<br />
2040 passenger<br />
loads.<br />
Table A-9: <strong>Capacity</strong> Analysis Inputs<br />
Category Value Units Source<br />
A 15-minute peak hour factors:<br />
AM Exit 0.260 <strong>Metro</strong>rail <strong>Station</strong> <strong>Access</strong> & <strong>Capacity</strong> Study<br />
AM Entry 0.348 <strong>Metro</strong>rail <strong>Station</strong> <strong>Access</strong> & <strong>Capacity</strong> Study<br />
PM Exit 0.260 <strong>Metro</strong>rail <strong>Station</strong> <strong>Access</strong> & <strong>Capacity</strong> Study<br />
PM Entry 0.364 <strong>Metro</strong>rail <strong>Station</strong> <strong>Access</strong> & <strong>Capacity</strong> Study<br />
B Peaking factor for exits only 1.28 Foggy Bottom-GWU <strong>Station</strong> Second Entrance<br />
Dem<strong>and</strong> Analysis<br />
C Escalator flow rate 90 p/min Transit <strong>Capacity</strong> <strong>and</strong> Quality of Service Manual<br />
D Peak analysis period 15 min -<br />
E Faregate flow rate 35 p/min Transit <strong>Capacity</strong> <strong>and</strong> Quality of Service Manual<br />
F Farecard vendor usage 4 % Observations<br />
G Farecard vendor flow rate 1.67 p/min Observations<br />
Table A-10: Summary of 2012 <strong>Capacity</strong> Analysis<br />
Morning Peak Afternoon Peak<br />
Category Exits Entries Total Exits Entries Total Source<br />
H Passengers, hourly peak 69 645 714 560 110 670 Faregate data<br />
I Passengers, 15-min. peak 18 224 242 146 40 186 H * A<br />
Required Facilities<br />
J Platform escalators 1 1 2 1 1 2 (B * I) / (C * D)<br />
K Platform elevators* 2 2 <strong>Metro</strong> practice<br />
L Faregate aisles 1 1 2 1 1 2 (B * I) / (D * E)<br />
M Farecard vendors 1 1 1 1 (F * I) / (D * G)<br />
* Current practice by <strong>Metro</strong> is to provide two platform elevators per mezzanine.<br />
Table A-11: Summary of 2040 <strong>Capacity</strong> Analysis<br />
Morning Peak Afternoon Peak<br />
Category Exits Entries Total Exits Entries Total Source<br />
H Passengers, hourly peak 93 871 964 756 149 905 Model results<br />
I Passengers, 15-min. peak 24 303 327 197 54 251 H * A<br />
Required Facilities<br />
J Platform escalators 1 1 2 1 1 2 (B * I) / (C * D)<br />
K Platform elevators* 2 2 <strong>Metro</strong> practice<br />
L Faregate aisles 1 1 2 1 1 2 (B * I) / (D * E)<br />
M Farecard vendors 1 1 1 1 (F * I) / (D * G)<br />
* Current practice by <strong>Metro</strong> is to provide two platform elevators per mezzanine.<br />
Table A-12: <strong>Station</strong> <strong>Capacity</strong> Analysis Results<br />
Circulation<br />
Elements Required<br />
Element<br />
Existing 2012 2040<br />
Platform Escalators 2 2 2<br />
Platform Elevators* 1 2 2<br />
Faregate Aisles 4 2 2<br />
Farecard Vendors 7 1 1<br />
* Current practice by <strong>Metro</strong> is to provide two platform elevators<br />
per mezzanine.<br />
83 | Appendices
Appendix 6: 2040 Shuttle Dem<strong>and</strong><br />
This study’s intended methodology to estimate shuttle trips to 2040 was originally used in<br />
<strong>Metro</strong>’s Shuttle Services at <strong>Metro</strong> Facilities study. The analysis <strong>com</strong>prises the following steps:<br />
1. Observe existing shuttles <strong>and</strong> record operating characteristics.<br />
2. Define a shuttle market area around <strong>Naylor</strong> <strong>Road</strong> <strong>Station</strong> based on location of existing<br />
shuttles as well as existing <strong>and</strong> planned transportation network.<br />
3. Obtain 2010 <strong>and</strong> 2040 household <strong>and</strong> employment estimates from MWCOG Round 8<br />
Cooperative Forecasts.<br />
4. Grow shuttle trips according to market area conditions.<br />
However, <strong>Naylor</strong> <strong>Road</strong> <strong>Station</strong> is presently not served by any shuttles, so it is not feasible<br />
to estimate future shuttles by pivoting off of an existing count. To substitute this existing<br />
methodology but still retain the same principles, this study <strong>com</strong>pared existing (2010) <strong>and</strong> future<br />
(2040) l<strong>and</strong> use data (employment <strong>and</strong> households) within traffic analysis zones 3 (TAZ) no<br />
farther than 1.5 miles from the station entrance (the range where shuttles are most likely to exist,<br />
as observed in the Shuttle Services at <strong>Metro</strong> Facilities study). Table A-13 shows household <strong>and</strong><br />
employment density near <strong>Naylor</strong> <strong>Road</strong> station. The three shaded rows in Table A-13 highlight<br />
the TAZs where shuttle trips are more likely to be provided due to proximity to the station <strong>and</strong><br />
large growth in household or employment density. While not guaranteed, planning for up to<br />
three shuttle trips per hour during peak periods—one per high growth TAZ—is a reasonable<br />
assumption given the available data.<br />
3. A Traffic Analysis<br />
Zone is a special<br />
area delineated<br />
by state <strong>and</strong>/<br />
or local<br />
transportation<br />
officials for<br />
tabulating<br />
traffic-related<br />
data. A TAZ<br />
usually consists<br />
of one or more<br />
census blocks,<br />
block groups,<br />
or census tracts<br />
(U.S. Census<br />
Bureau)<br />
Table A-13: Household <strong>and</strong> Employment Density<br />
Household<br />
Density<br />
2010 2040 Difference<br />
Employment<br />
Density<br />
Household<br />
Density<br />
Employment<br />
Density<br />
Household<br />
Density<br />
Employment<br />
Density<br />
Percent<br />
Difference<br />
Household<br />
Density<br />
Employment<br />
Density<br />
TAZ* Jurisdiction<br />
285 DC 1,768 789 2,134 1,419 366 630 21% 80%<br />
286 DC 6,675 330 6,999 475 323 145 5% 44%<br />
301 DC 5,087 1,235 5,989 1,310 902 75 18% 6%<br />
302 DC 4,947 298 5,145 307 198 9 4% 3%<br />
303 DC 983 820 1,028 838 45 18 5% 2%<br />
304 DC 3,845 1,618 5,520 3,222 1,675 1,604 44% 99%<br />
751 MD 1,433 7,571 1,393 8,905 -40 1,335 3% 18%<br />
753 MD 2,003 115 1,979 115 -24 0 -1% 0%<br />
757 MD 3,409 2,150 3,404 2,387 -6 236 0% 11%<br />
769 MD 2,953 2,922 2,987 3,418 34 496 1% 17%<br />
770 MD 5,061 229 5,020 1,453 -41 1,224 -1% 534%<br />
<strong>Naylor</strong> <strong>Road</strong> <strong>Metro</strong> <strong>Station</strong> <strong>Area</strong> <strong>Access</strong> <strong>and</strong> <strong>Capacity</strong> Study | 84
Appendix 7: 2040 Kiss & Ride Dem<strong>and</strong><br />
The <strong>Naylor</strong> <strong>Road</strong> <strong>Station</strong> Kiss & Ride would likely be redesigned as part of a station area<br />
redevelopment. To estimate a conservative, maximum number of temporary parking spaces<br />
needed for a future Kiss & Ride facility, this study utilized <strong>Naylor</strong> <strong>Road</strong> <strong>Station</strong>’s 12 percent<br />
Kiss & Ride mode share from the 2007 <strong>Metro</strong>rail Passenger Survey. Based on station observations,<br />
which showed a parking utilization rate of approximately 17 vehicles per hour, 30 spaces<br />
(A-spaces <strong>and</strong> metered spaces) will be sufficient to ac<strong>com</strong>modate a 12-percent share of 2040<br />
<strong>Naylor</strong> <strong>Road</strong> <strong>Station</strong> passengers. Additional space would be required for curbside pick-up/<br />
drop-off, taxi, ADA, car-sharing, <strong>and</strong> motorcycle.<br />
Table A-14: 2040 Kiss & Ride Parking Needs<br />
Category<br />
Value Source<br />
A Estimated daily entries at <strong>Naylor</strong> <strong>Road</strong> <strong>Station</strong> in 2040 4,017 Travel dem<strong>and</strong> model<br />
B Existing Kiss & Ride mode share 12% 2007 <strong>Metro</strong>rail Passenger Survey<br />
C Kiss & Ride turnover (vehicles per hour per space) 17 <strong>Station</strong> observations<br />
Kiss & Ride temporary parking spaces (A-spaces <strong>and</strong> 30 A * B / C<br />
metered spaces) needed in 2040*<br />
* Rounded value<br />
85 | Appendices
Appendix 8: Emergency Egress<br />
To meet NFPA 130 evacuation criteria, all passengers (i.e. station occupant load) on the station<br />
platform must clear the platform in four minutes <strong>and</strong> reach a point of safety in six minutes (note<br />
that the six-minute period includes the time to clear the platform). The station occupant load<br />
consists of the entraining load (i.e. all passengers entering the station to board a train) <strong>and</strong> the<br />
train load (i.e. passengers already on a train) during the peak period.<br />
The entraining load <strong>and</strong> the train load per platform are the sums of the entraining loads or train<br />
loads per track. A surge factor is applied to the entraining <strong>and</strong> the train loads in both directions,<br />
<strong>and</strong> a factor of two is applied to the peak direction to account for one missed headway, per<br />
NFPA 130 requirements. Thus, the station occupant load for <strong>Naylor</strong> <strong>Road</strong> <strong>Station</strong> in 2012 is:<br />
• 2012 AM Peak <strong>Station</strong> Occupant Load = [2 * surge * (NB entraining load + NB train load] +<br />
[surge * (SB entraining load + SB train load)]<br />
= [2 * 1.3 * (59 + 238)] + [1.3 * (9 + 37)] = 831<br />
• 2012 PM Peak <strong>Station</strong> Occupant Load = [2 * surge * (SB entraining load + SB train load)] +<br />
[surge * (NB entraining load + NB train load)]<br />
= [2 * 1.3 * (12 + 434)] + [1.3 * (1 + 50)] = 1,225<br />
Note: <strong>Naylor</strong> <strong>Road</strong> <strong>Station</strong> entraining <strong>and</strong> train loads for 2012 <strong>and</strong> 2040 are calculated in Tables A-18,<br />
A-20, A-22, <strong>and</strong> A-24. Values in this example are rounded.<br />
In the high level planning analysis used for this study, passengers disperse according to the<br />
available capacity of the exit points. One escalator is assumed out of service, <strong>and</strong> the remaining<br />
escalator is assumed to be stopped <strong>and</strong> usable as a stairway.<br />
Time to Clear Platform<br />
The vertical circulation facilities (e.g. stopped escalator <strong>and</strong> emergency stairways, not elevator)<br />
may be a limiting factor in how quickly a station platform is cleared. Calculating the exiting<br />
capacity for <strong>Naylor</strong> <strong>Road</strong> <strong>Station</strong> is relatively simplified because passengers would exit via one<br />
of two possible choices, <strong>and</strong> both lead to the same mezzanine:<br />
1. West stairway <strong>and</strong> escalator (assumed stopped, but usable as stairway)<br />
2. East stairway (escalator assumed to be <strong>com</strong>pletely out of service)<br />
For <strong>Naylor</strong> <strong>Road</strong> <strong>Station</strong>, the west stairway <strong>and</strong> escalator account for 64 percent of the egress<br />
capacity <strong>and</strong> station occupant load, while the east stairway accounts for the remaining 36<br />
percent. Using this method, along with calculating passenger walk times, it would take<br />
approximately 3.6 minutes to clear the platform in the morning peak <strong>and</strong> 5.2 minutes to clear the<br />
platform in the afternoon peak in year 2012. Passengers would clear the platform more slowly in<br />
the afternoon peak period because of the higher station occupant load <strong>com</strong>pared to the morning<br />
peak.<br />
<strong>Naylor</strong> <strong>Road</strong> <strong>Metro</strong> <strong>Station</strong> <strong>Area</strong> <strong>Access</strong> <strong>and</strong> <strong>Capacity</strong> Study | 86
Time to Reach a Point of Safety<br />
Calculating the time to reach a point of safety (defined as the street level <strong>com</strong>pletely outside of<br />
all station structures) employs the same principle. After clearing the platform, the capacity of<br />
faregates (assumed to be open in an emergency) <strong>and</strong> the width of the mezzanine exit may be<br />
limiting factors in how quickly the station occupant load reaches a point of safety. In addition<br />
to the time spent walking along the exit path, the analysis accounts for the wait time at each<br />
potential choke point along the way. The analysis found that wait times at faregates <strong>and</strong><br />
mezzanine exit would be non-existent, as the person-per-minute throughput capacity at each<br />
potential chokepoint increases as the passengers get closer toward the exit. In other words, the<br />
platform-to-mezzanine stairways <strong>and</strong> escalator are the only bottleneck in the station. Passenger<br />
queues would form on the platform in an emergency situation because of the limited throughput<br />
capacity of the stairways <strong>and</strong> escalator. These vertical circulation facilities would act as a funnel,<br />
allowing only some of the passengers through. The <strong>com</strong>paratively larger throughput capacity<br />
of the faregates <strong>and</strong> the mezzanine exit ensures that the limited number of passengers that have<br />
already descended to the mezzanine can proceed without waiting in additional queues.<br />
Table A-15 details the analysis inputs used to calculate times to clear the station platform <strong>and</strong> to<br />
reach a point of safety.<br />
Table A-16 summarizes the vertical, faregate, <strong>and</strong> mezzanine exit capacity, as well as the walking<br />
time for the longest practical route to reach a point of safety under 2012 <strong>and</strong> 2040 ridership.<br />
Tables A-17 <strong>and</strong> A-24 provide a detailed breakdown of the NFPA 130 morning <strong>and</strong> afternoon<br />
peak analyses.<br />
Table A-15: NFPA 130 Analysis Input Data<br />
Category Value Units Source<br />
<strong>Metro</strong>rail crush capacity 220 Passengers/car <strong>Metro</strong> Manual of Design Criteria for Maintaining <strong>and</strong> Continued Operation<br />
of Facilities<br />
Escalator width 48 Inches <strong>Metro</strong> Manual of Design Criteria for Maintaining <strong>and</strong> Continued Operation<br />
of Facilities<br />
Stair width 60 Inches <strong>Metro</strong> Manual of Design Criteria for Maintaining <strong>and</strong> Continued Operation<br />
of Facilities<br />
Surge factor 1.3 <strong>Metro</strong> Ballston-MU <strong>Station</strong> Exiting<br />
Walking speed 124 Feet/minute NFPA 130: St<strong>and</strong>ard for Fixed Guideway Transit <strong>and</strong> Passenger Rail Systems<br />
Vertical walking speed (down) 48 Feet/minute NFPA 130: St<strong>and</strong>ard for Fixed Guideway Transit <strong>and</strong> Passenger Rail Systems<br />
<strong>Capacity</strong> for stairs <strong>and</strong> stopped 1.41 Persons/inch/minute NFPA 130: St<strong>and</strong>ard for Fixed Guideway Transit <strong>and</strong> Passenger Rail Systems<br />
escalators (down)<br />
<strong>Capacity</strong> for faregates 50 Persons/minute NFPA 130: St<strong>and</strong>ard for Fixed Guideway Transit <strong>and</strong> Passenger Rail Systems<br />
<strong>Capacity</strong> for ADA or emergency<br />
faregates<br />
75 Persons/minute NFPA 130: St<strong>and</strong>ard for Fixed Guideway Transit <strong>and</strong> Passenger Rail Systems<br />
87 | Appendices
Table A-16: NFPA 130 Preliminary Analysis<br />
2012 Ridership 2040 Ridership<br />
Platform-to-Mezzanine <strong>Capacity</strong><br />
# width (in.) p/in/min p/min # width (in.) p/in/min p/min<br />
Stairs 2 60 1.41 169.2 Stairs 2 60 1.41 169.2<br />
Escalators 1 48 1.41 67.7 Escalators 1 48 1.41 67.7<br />
Total 236.9 Total 220.1<br />
Faregate <strong>Capacity</strong><br />
# p/min p/min # p/min p/min<br />
Faregates 4 50 200.0 Faregates 4 50 200.0<br />
ADA gate 1 75 75.0 ADA gate 1 75 75.0<br />
Serv. gate 2 75 150.0 Serv. gate 2 75 150.0<br />
Total 425.0 Total 425.0<br />
Mezzanine Exit <strong>Capacity</strong><br />
# width (in.) p/in/min p/min # width (in.) p/in/min p/min<br />
West Exit 1 131 2.08 272.5 West Exit 1 131 2.08 272.5<br />
East Exit 1 131 2.08 272.5 East Exit 1 131 2.08 272.5<br />
Total 545.0 Total 545.0<br />
Walking Time for Longest Route (Excluding Wait Times)<br />
ft. ft./min minutes ft. ft./min minutes<br />
Platform 255 124 2.1 Platform 255 124 2.1<br />
Vertical 30 48 0.6 Vertical 30 48 0.6<br />
Mezzanine 135 124 1.1 Mezzanine 135 124 1.1<br />
Total* 3.8 Total* 3.8<br />
* Total walking time for longest route rounded up to the nearest tenth<br />
<strong>Naylor</strong> <strong>Road</strong> <strong>Metro</strong> <strong>Station</strong> <strong>Area</strong> <strong>Access</strong> <strong>and</strong> <strong>Capacity</strong> Study | 88
Table A-17: NFPA 130 Complete Analysis Inputs (2012 Morning Peak)<br />
Category<br />
Value Units<br />
A AM peak 15-minute factor for station 0.661<br />
B AM arriving half hour train load from Suitl<strong>and</strong> (NB, peak direction) 1,176 passengers<br />
C AM arriving half hour train load from Southern Ave (SB, off-peak direction) 139 passengers<br />
D AM peak systemwide 15-minute factor 0.660<br />
Source: <strong>Station</strong> <strong>Access</strong> & <strong>Capacity</strong> Study<br />
Table A-18: NFPA 130 Complete Analysis (2012 Morning Peak)*<br />
Category<br />
2012 Formula or Source<br />
a Peak Half-Hour Period (entries) 323 <strong>Metro</strong> faregate data (2012)<br />
b Peak 15-Minute Period (entries) 214 A * a<br />
c Headway for peak direction (minutes) 4.6 <strong>Metro</strong><br />
d Headway for off-peak direction (minutes) 6 <strong>Metro</strong><br />
e Peak Direction (NB) Entraining Load (entries)… 59 (c / 15) * b * [B / (B + C)]<br />
f … with surge <strong>and</strong> missed headway factors applied 152 1.3 * 2 * e<br />
g Off-peak Direction (SB) Entraining Load (entries) 9 (d / 15) * b * [C / (B + C)]<br />
h … with surge factor applied 12 1.3 * g<br />
i Peak Direction (NB) Train Load (passengers per train)… 238 (c / 15) * B * D<br />
j … with surge <strong>and</strong> missed headway factors applied 619 1.3 * 2 * i<br />
k Off-peak Direction (SB) Train Load (passengers per train)… 37 (d / 15) * C * D<br />
l … with surge factor applied 48 1.3 * k<br />
m Total Occupant Load (passengers on platform) 831 f + h + j + l<br />
Time to Clear Platform (minutes) 3.6<br />
Wait Time at Platform Exit (minutes) 1.5<br />
Walk Time to Platform Exit (minutes) 2.1<br />
Platform Clearance Time (minutes) 3.6<br />
Walking Time Down to Mezzanine Level (minutes) 0.6<br />
Wait Time at Faregates (minutes) 0.0<br />
Walking Time to Faregates (minutes) 0.6<br />
Faregate Clearance Time (minutes) 0.6<br />
Wait Time at Mezzanine Exit (minutes) 0.0<br />
Walking Time to Mezzanine Exit (minutes) 0.3<br />
Mezzanine Exit Clearance Time (minutes) 0.0<br />
Time to Reach Point of Safety (minutes) 4.4<br />
* Rounded values<br />
89 | Appendices
Table A-19: NFPA 130 Complete Analysis Inputs (2040 Morning Peak)<br />
Category<br />
Value Units<br />
A AM peak 15-minute factor for station 0.661<br />
B AM arriving half hour train load from Suitl<strong>and</strong> (NB, peak direction) 1,475 passengers<br />
C AM arriving half hour train load from Southern Ave (SB, off-peak direction) 230 passengers<br />
D AM peak systemwide 15-minute factor 0.660<br />
Source: <strong>Station</strong> <strong>Access</strong> & <strong>Capacity</strong> Study<br />
Table A-20: NFPA 130 Complete Analysis (2040 Morning Peak)*<br />
Category<br />
2040 Formula or Source<br />
a Peak Half-Hour Period (entries) 437 Model results (2040)<br />
b Peak 15-Minute Period (entries) 289 A * a<br />
c Headway for peak direction (minutes) 2.5 <strong>Metro</strong><br />
d Headway for off-peak direction (minutes) 2.5 <strong>Metro</strong><br />
e Peak Direction (NB) Entraining Load (entries)… 42 (c / 15) * b * [B / (B + C)]<br />
f … with surge <strong>and</strong> missed headway factors applied 108 1.3 * 2 * e<br />
g Off-peak Direction (SB) Entraining Load (entries)… 6 (d / 15) * b * [C / (B + C)]<br />
h … with surge factor applied 8 1.3 * g<br />
i Peak Direction (NB) Train Load (passengers per train)… 162 (c / 15) * B * D<br />
j … with surge <strong>and</strong> missed headway factors applied 422 1.3 * 2 * i<br />
k Off-peak Direction (SB) Train Load (passengers per train)… 25 (d / 15) * C * D<br />
l … with surge factor applied 33 1.3 * k<br />
m Total Occupant Load (passengers on platform) 571 f + h + j + l<br />
Time to Clear Platform (minutes) 2.5<br />
Wait Time at Platform Exit (minutes) 0.4<br />
Walk Time to Platform Exit (minutes) 2.1<br />
Platform Clearance Time (minutes) 2.5<br />
Walking Time Down to Mezzanine Level (minutes) 0.6<br />
Wait Time at Faregates (minutes) 0.0<br />
Walking Time to Faregates (minutes) 0.6<br />
Faregate Clearance Time (minutes) 0.6<br />
Wait Time at Mezzanine Exit (minutes) 0.0<br />
Walking Time to Mezzanine Exit (minutes) 0.3<br />
Mezzanine Exit Clearance Time (minutes) 0.0<br />
Time to Reach Point of Safety (minutes) 4.4<br />
* Rounded values<br />
<strong>Naylor</strong> <strong>Road</strong> <strong>Metro</strong> <strong>Station</strong> <strong>Area</strong> <strong>Access</strong> <strong>and</strong> <strong>Capacity</strong> Study | 90
Table A-21: NFPA 130 Complete Analysis Inputs (2012 Afternoon Peak)<br />
Category<br />
Value Units<br />
A PM peak 15-minute factor for station 0.684<br />
B PM arriving half hour train load from Suitl<strong>and</strong> (NB, off-peak direction) 183 passengers<br />
C PM arriving half hour train load from Southern Ave (SB, peak direction) 2,081 passengers<br />
D PM peak systemwide 15-minute factor 0.680<br />
Source: <strong>Station</strong> <strong>Access</strong> & <strong>Capacity</strong> Study<br />
Table A-22: NFPA 130 Complete Analysis (2012 Afternoon Peak)*<br />
Category<br />
2012 Formula or Source<br />
a Peak Half-Hour Period (entries) 61 <strong>Metro</strong> faregate data (2012)<br />
b Peak 15-Minute Period (entries) 42 A * a<br />
c Headway for peak direction (minutes) 4.6 <strong>Metro</strong><br />
d Headway for off-peak direction (minutes) 6 <strong>Metro</strong><br />
e Peak Direction (SB) Entraining Load (entries)… 12 (c / 15) * b * [C / (B + C)]<br />
f … with surge <strong>and</strong> missed headway factors applied 31 1.3 * 2 * e<br />
g Off-peak Direction (NB) Entraining Load (entries)… 1 (d / 15) * b * [B / (B + C)]<br />
h … with surge factor applied 2 1.3 * g<br />
i Peak Direction (SB) Train Load (passengers per train)… 434 (c / 15) * C * D<br />
j … with surge <strong>and</strong> missed headway factors applied 1,128 1.3 * 2 * i<br />
k Off-peak Direction (NB) Train Load (passengers per train)… 50 (d / 15) * B * D<br />
l … with surge factor applied 65 1.3 * k<br />
m Total Occupant Load (passengers on platform) 1,225 f + h + j + l<br />
Time to Clear Platform (minutes) 5.2<br />
Wait Time at Platform Exit (minutes) 3.1<br />
Walk Time to Platform Exit (minutes) 2.1<br />
Platform Clearance Time (minutes) 5.2<br />
Walking Time Down to Mezzanine Level (minutes) 0.6<br />
Wait Time at Faregates (minutes) 0.0<br />
Walking Time to Faregates (minutes) 0.6<br />
Faregate Clearance Time (minutes) 0.6<br />
Wait Time at Mezzanine Exit (minutes) 0.0<br />
Walking Time to Mezzanine Exit (minutes) 0.3<br />
Mezzanine Exit Clearance Time (minutes) 0.0<br />
Time to Reach Point of Safety (minutes) 6.7<br />
* Rounded values<br />
91 | Appendices
Table A-23: NFPA 130 Complete Analysis Inputs (2040 Afternoon Peak)<br />
Category<br />
Value Units<br />
A PM peak 15-minute factor for station 0.684<br />
B PM arriving half hour train load from Suitl<strong>and</strong> (NB, off-peak direction) 287 passengers<br />
C PM arriving half hour train load from Southern Ave (SB, peak direction) 2,483 passengers<br />
D PM peak systemwide 15-minute factor 0.680<br />
Source: <strong>Station</strong> <strong>Access</strong> & <strong>Capacity</strong> Study<br />
Table A-24: NFPA 130 Complete Analysis (2040 Afternoon Peak)*<br />
Category<br />
2040 Formula or Source<br />
a Peak Half-Hour Period (entries) 83 Model results (2040)<br />
b Peak 15-Minute Period (entries) 57 A * a<br />
c Headway for peak direction (minutes) 2.5 <strong>Metro</strong><br />
d Headway for off-peak direction (minutes) 2.5 <strong>Metro</strong><br />
e Peak Direction (SB) Entraining Load (entries)… 9 (c / 15) * b * [C / (B + C)]<br />
f … with surge <strong>and</strong> missed headway factors applied 22 1.3 * 2 * e<br />
g Off-peak Direction (NB) Entraining Load (entries)… 1 (d / 15) * b * [B / (B + C)]<br />
h … with surge factor applied 1 1.3 * g<br />
i Peak Direction (SB) Train Load (passengers per train)… 281 (c / 15) * C * D<br />
j … with surge <strong>and</strong> missed headway factors applied 732 1.3 * 2 * i<br />
k Off-peak Direction (NB) Train Load (passengers per train)… 33 (d / 15) * B * D<br />
l … with surge factor applied 42 1.3 * k<br />
m Total Occupant Load (passengers on platform) 797 f + h + j + l<br />
Time to Clear Platform (minutes) 3.4<br />
Wait Time at Platform Exit (minutes) 1.3<br />
Walk Time to Platform Exit (minutes) 2.1<br />
Platform Clearance Time (minutes) 3.4<br />
Walking Time Down to Mezzanine Level (minutes) 0.6<br />
Wait Time at Faregates (minutes) 0.0<br />
Walking Time to Faregates (minutes) 0.6<br />
Faregate Clearance Time (minutes) 0.6<br />
Wait Time at Mezzanine Exit (minutes) 0.0<br />
Walking Time to Mezzanine Exit (minutes) 0.3<br />
Mezzanine Exit Clearance Time (minutes) 0.0<br />
Time to Reach Point of Safety (minutes) 4.9<br />
* Rounded values<br />
<strong>Naylor</strong> <strong>Road</strong> <strong>Metro</strong> <strong>Station</strong> <strong>Area</strong> <strong>Access</strong> <strong>and</strong> <strong>Capacity</strong> Study | 92
Appendix 9: Crash Rate Comparison<br />
Crash rates are typically reported as the number of crashes 100 million vehicle miles traveled.<br />
Tables A 25 <strong>and</strong> A-26 calculate the 2008 crash rates for Branch Avenue <strong>and</strong> <strong>Naylor</strong> <strong>Road</strong>,<br />
respectively. This study used year 2008 because it was the most recent year where both crash<br />
<strong>and</strong> annual average daily traffic (AADT) data were available for <strong>com</strong>parison. Branch Avenue’s<br />
total crash rate per 100 million vehicle miles traveled (VMT) is more than two times <strong>Naylor</strong><br />
<strong>Road</strong>’s rate.<br />
Table A-25: Branch Avenue Crash Rate (2008)<br />
Category Value Units Source<br />
A Total crashes near the station 35 Crashes SHA<br />
B AADT near the station 57,101 Vehicles SHA<br />
C <strong>Road</strong>way segment length 0.4 Miles Google Earth<br />
<strong>Road</strong>way segment crash rate 420 Crashes / 100 million VMT (A * 10^8) / (B * 365 * C)<br />
Table A-26: <strong>Naylor</strong> <strong>Road</strong> Crash Rate (2008)<br />
Category Value Units Source<br />
A Total crashes near the station 6 Crashes SHA<br />
B AADT near the station 20,420 Vehicles SHA<br />
C <strong>Road</strong>way segment length 0.4 Miles Google Earth<br />
<strong>Road</strong>way segment crash rate 201 Crashes / 100 million VMT (A * 10^8) / (B * 365 * C)<br />
93 | Appendices
Please consider the environment before printing.