
Create successful ePaper yourself
Turn your PDF publications into a flip-book with our unique Google optimized e-Paper software.
Cash flows – Operating cash flow returns, but<br />
investing lags<br />
• At $137 billion for 2010, operating cash flows increased<br />
to their highest level, a 65% rise over 2009 and only the<br />
second time they have exceeded $100 billion.<br />
• Investing cash flows increased by 7% but were still<br />
well below the $126 billion invested in 2007. In 2010<br />
for every dollar earned in revenue only 18 cents were<br />
invested, significantly lower than the 40 cents invested<br />
per dollar of revenue in 2007 and the 2003-2009<br />
average of 26 cents per dollar. In 2010 Investing cash<br />
flows were only 58% of operating cash flows,<br />
compared to an average of 94% for 2003-2009.<br />
• With recently announced capital projects, we expect<br />
investing cash flows to increase again in the coming<br />
years. However, companies struggle to meet their<br />
capex targets as complexities often delay project<br />
timetables.<br />
• Financing cash flow was a net outflow for the first time<br />
since 2005, with a net of $35 billion being repaid to<br />
lenders or returned to shareholders.<br />
Balance sheet – Assets approach $1 trillion<br />
• Property, plant and equipment continued the upward<br />
trend experienced every year since 2002, as capital<br />
expenditures and acquisitions exceeded depreciation<br />
and disposals.<br />
majority of which were Australian and Canadian<br />
mid-tier miners. Amazingly there were no South<br />
African or UK based miners acquired. Notable names<br />
include:<br />
o Australia: Lihir Gold, WMC Resources, and Zinifex<br />
o Canada: Falconbridge, Glamis Gold, Inco,<br />
Noranda and Placer Dome<br />
o United States: Phelps Dodge<br />
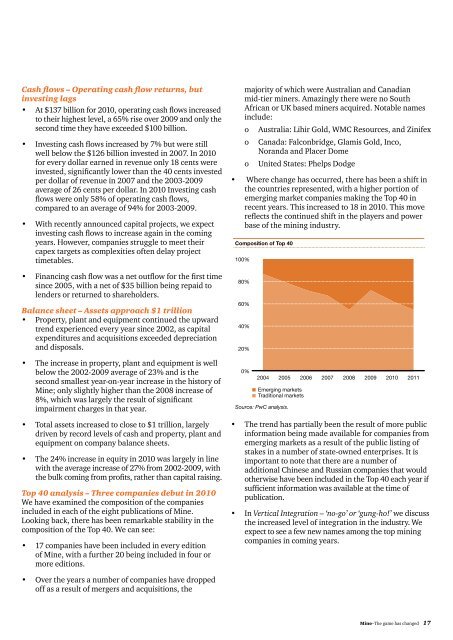
• Where change <strong>has</strong> occurred, there <strong>has</strong> been a shift in<br />
the countries represented, with a higher portion of<br />
emerging market companies making the Top 40 in<br />
recent years. This increased to 18 in 2010. This move<br />
reflects the continued shift in the players and power<br />
base of the mining industry.<br />
Composition of Top 40<br />
100%<br />
80%<br />
60%<br />
40%<br />
20%<br />
• <strong>The</strong> increase in property, plant and equipment is well<br />
below the 2002-2009 average of 23% and is the<br />
second smallest year-on-year increase in the history of<br />
<strong>Mine</strong>; only slightly higher than the 2008 increase of<br />
8%, which was largely the result of significant<br />
impairment charges in that year.<br />
0%<br />
2004<br />
2005<br />
Emerging markets<br />
Traditional markets<br />
Source: PwC analysis.<br />
2006<br />
2007<br />
2008<br />
2009<br />
2010<br />
<strong>2011</strong><br />
• Total assets increased to close to $1 trillion, largely<br />
driven by record levels of cash and property, plant and<br />
equipment on company balance sheets.<br />
• <strong>The</strong> 24% increase in equity in 2010 was largely in line<br />
with the average increase of 27% from 2002-2009, with<br />
the bulk coming from profits, rather than capital raising.<br />
Top 40 analysis – Three companies debut in 2010<br />
We have examined the composition of the companies<br />
included in each of the eight publications of <strong>Mine</strong>.<br />
Looking back, there <strong>has</strong> been remarkable stability in the<br />
composition of the Top 40. We can see:<br />
• 17 companies have been included in every edition<br />
of <strong>Mine</strong>, with a further 20 being included in four or<br />
more editions.<br />
• <strong>The</strong> trend <strong>has</strong> partially been the result of more public<br />
information being made available for companies from<br />
emerging markets as a result of the public listing of<br />
stakes in a number of state-owned enterprises. It is<br />
important to note that there are a number of<br />
additional Chinese and Russian companies that would<br />
otherwise have been included in the Top 40 each year if<br />
sufficient information was available at the time of<br />
publication.<br />
• In Vertical Integration – ‘no-go’ or ‘gung-ho!’ we discuss<br />
the increased level of integration in the industry. We<br />
expect to see a few new names among the top mining<br />
companies in coming years.<br />
• Over the years a number of companies have dropped<br />
off as a result of mergers and acquisitions, the<br />
<strong>Mine</strong>–<strong>The</strong> <strong>game</strong> <strong>has</strong> <strong>changed</strong> 17