
You also want an ePaper? Increase the reach of your titles
YUMPU automatically turns print PDFs into web optimized ePapers that Google loves.
Income statement<br />
2010<br />
$ billion<br />
2009<br />
$ billion<br />
Change<br />
%<br />
Revenue 435 330 32<br />
Operating expenses (246) (220) 12<br />
Adjusted EBITDA* 189 110 72<br />
Impairment charges (1) (12) (92)<br />
Depreciation & amortisation (33) (27) 22<br />
PBIT 155 71 118<br />
Net interest expense (7) (5) 40<br />
Income tax expense (38) (23) 65<br />
Net profit 110 43 156<br />
* EBITDA adjusted to exclude impairment charges.<br />
Key ratios<br />
2010<br />
%<br />
2009<br />
%<br />
Adjusted EBITDA margin 43 33<br />
Net profit margin 25 13<br />
Return on capital employed 18 9<br />
Return on equity 22 11<br />
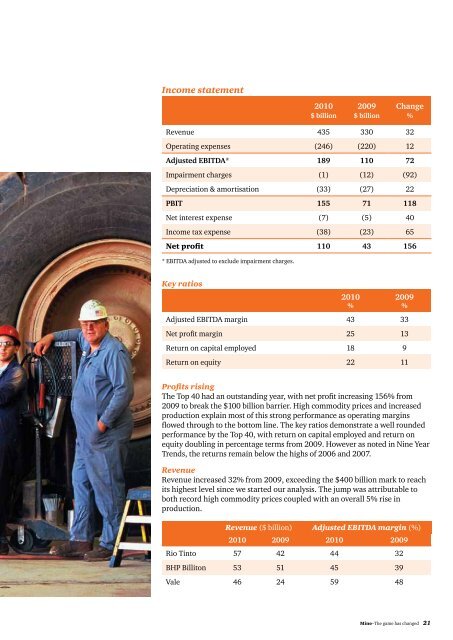
Profits rising<br />
<strong>The</strong> Top 40 had an outstanding year, with net profit increasing 156% from<br />
2009 to break the $100 billion barrier. High commodity prices and increased<br />
production explain most of this strong performance as operating margins<br />
flowed through to the bottom line. <strong>The</strong> key ratios demonstrate a well rounded<br />
performance by the Top 40, with return on capital employed and return on<br />
equity doubling in percentage terms from 2009. However as noted in Nine Year<br />
Trends, the returns remain below the highs of 2006 and 2007.<br />
Revenue<br />
Revenue increased 32% from 2009, exceeding the $400 billion mark to reach<br />
its highest level since we started our analysis. <strong>The</strong> jump was attributable to<br />
both record high commodity prices coupled with an overall 5% rise in<br />
production.<br />
Revenue ($ billion) Adjusted EBITDA margin (%)<br />
2010 2009 2010 2009<br />
Rio Tinto 57 42 44 32<br />
BHP Billiton 53 51 45 39<br />
Vale 46 24 59 48<br />
<strong>Mine</strong>–<strong>The</strong> <strong>game</strong> <strong>has</strong> <strong>changed</strong> 21