The Ecological Footprint of Campo Grande - Global Footprint Network
The Ecological Footprint of Campo Grande - Global Footprint Network
The Ecological Footprint of Campo Grande - Global Footprint Network

You also want an ePaper? Increase the reach of your titles
YUMPU automatically turns print PDFs into web optimized ePapers that Google loves.
Executive summary<br />
<strong>Campo</strong> <strong>Grande</strong>’s <strong>Ecological</strong> <strong>Footprint</strong><br />
<strong>The</strong> average <strong>Ecological</strong> <strong>Footprint</strong> <strong>of</strong> an inhabitant <strong>of</strong> the city <strong>of</strong><br />
<strong>Campo</strong> <strong>Grande</strong> is 3.14 global hectares. That means that if everyone<br />
in the world were to consume in the same way as <strong>Campo</strong> <strong>Grande</strong><br />
dwellers, almost two planets would be needed to keep up their style<br />
<strong>of</strong> living.<br />
To adequately supply the 787,204 inhabitants <strong>of</strong> <strong>Campo</strong> <strong>Grande</strong><br />
with renewable natural resources, an area corresponding to<br />
2,471,821 global hectares would be needed.<br />
<strong>The</strong> city’s <strong>Ecological</strong> <strong>Footprint</strong> is 8% bigger than the Brazilian<br />
one, 10% higher than the footprint for the state <strong>of</strong> Mato Grosso<br />
do Sul and 14% larger than the world average. In turn, the state<br />
<strong>of</strong> Mato Grosso do Sul’s footprint is 3% larger than the Brazilian<br />
average which is 2.9 global hectares per person.<br />
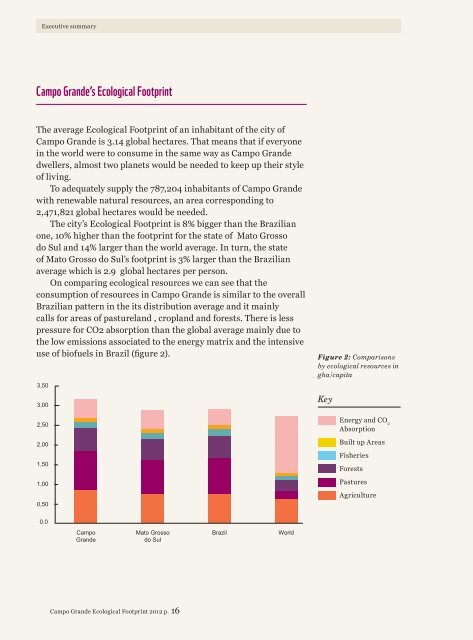
On comparing ecological resources we can see that the<br />
consumption <strong>of</strong> resources in <strong>Campo</strong> <strong>Grande</strong> is similar to the overall<br />
Brazilian pattern in the its distribution average and it mainly<br />
calls for areas <strong>of</strong> pastureland , cropland and forests. <strong>The</strong>re is less<br />
pressure for CO2 absorption than the global average mainly due to<br />
the low emissions associated to the energy matrix and the intensive<br />
use <strong>of</strong> bi<strong>of</strong>uels in Brazil (figure 2).<br />
3,50<br />
3,00<br />
Figure 2: Comparisons<br />
by ecological resources in<br />
gha/capita<br />
Key<br />
2,50<br />
2,00<br />
1,50<br />
1,00<br />
0,50<br />
Energy and CO 2<br />
Absorption<br />
Built up Areas<br />
Fisheries<br />
Forests<br />
Pastures<br />
Agriculture<br />
0.0<br />
<strong>Campo</strong><br />
<strong>Grande</strong><br />
Mato Grosso<br />
do Sul<br />
Brazil<br />
World<br />
<strong>Campo</strong> <strong>Grande</strong> <strong>Ecological</strong> <strong>Footprint</strong> 2012 p. 16