The Ecological Footprint of Campo Grande - Global Footprint Network
The Ecological Footprint of Campo Grande - Global Footprint Network
The Ecological Footprint of Campo Grande - Global Footprint Network

Create successful ePaper yourself
Turn your PDF publications into a flip-book with our unique Google optimized e-Paper software.
THIS REPORT HAS<br />
BEEN PRODUCED<br />
WITH THE<br />
COLLABORATION OF<br />
REPORT<br />
BR<br />
2012<br />
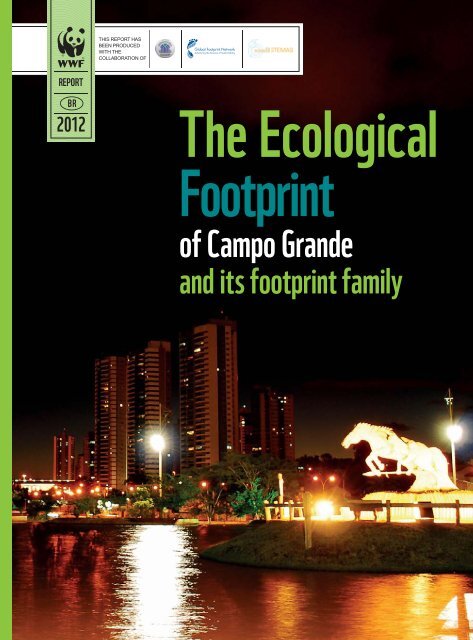
<strong>The</strong> <strong>Ecological</strong><br />
<strong>Footprint</strong><br />
<strong>of</strong> <strong>Campo</strong> <strong>Grande</strong><br />
and its footprint family
Mission<br />
WWF-Brazil is a Brazilian nongovernmental<br />
organisation dedicated to<br />
Nature Conservation. Its objectives are to<br />
harmonise human activity with biodiversity<br />
conservation and foster the rational use<br />
<strong>of</strong> natural resources to the benefit <strong>of</strong> the<br />
citizens <strong>of</strong> today and future generations.<br />
WWF-Brazil, based in Brasilia, was created<br />
in 1996 and unfolds projects throughout<br />
Brazil. It is part <strong>of</strong> the WWF <strong>Network</strong>,<br />
the world’s largest independent Nature<br />
Conservation organisation, active in more<br />
than 100 countries and supported by 5<br />
million members and volunteers.
THIS REPORT HAS<br />
BEEN PRODUCED<br />
WITH THE<br />
COLLABORATION OF<br />
REPORT<br />
BR<br />
2012<br />
<strong>The</strong> <strong>Ecological</strong><br />
<strong>Footprint</strong><br />
<strong>of</strong> <strong>Campo</strong> <strong>Grande</strong><br />
and its footprint family<br />
Brasilia, March 2012
Overall Coordination<br />
Michael Becker – WWF-Brasil<br />
Terezinha da Silva Martins – WWF-Brasil<br />
Fabrício de <strong>Campo</strong>s – ecosSISTEMAS<br />
Jennifer Mitchell – <strong>Global</strong> <strong>Footprint</strong> <strong>Network</strong><br />
Technical Coordination<br />
Fabrício de <strong>Campo</strong>s – ecosSISTEMAS<br />
David Moore – <strong>Global</strong> <strong>Footprint</strong> <strong>Network</strong><br />
Technical Collaboration<br />
Pr<strong>of</strong>. Celso Correia de Souza PhD – Economic and Social Science Studies and<br />
Research Nucleus at the Anhanguera University (NEPES/Uniderp)<br />
Pr<strong>of</strong>. José Francisco dos Reis Neto MSc –Economic and Social Science Studies<br />
and Research Nucleus at the Anhanguera University (NEPES/Uniderp)<br />
KatsunoriIha – <strong>Global</strong> <strong>Footprint</strong> <strong>Network</strong><br />
Collaboration<br />
Marcos Antônio M Cristaldo – Head <strong>of</strong> the Environment and Urban<br />
Development Department <strong>of</strong> the <strong>Campo</strong> <strong>Grande</strong> Municipal Government<br />
Editing<br />
Geralda Magela – WWF-Brasil<br />
Revision<br />
Radígia de Oliveira<br />
P376p <strong>The</strong> <strong>Ecological</strong> <strong>Footprint</strong> <strong>of</strong> <strong>Campo</strong> <strong>Grande</strong> and its footprint family, Overall<br />
coordination: Michael Becker and Terezinha da Silva Martins; Fabrício de <strong>Campo</strong>s;<br />
Jennifer Mitchell. WWF-Brasil, Brasília, 2012.<br />
132p.;il; 17x23 cm. ISBN 978-85-86440-44-1<br />
1. Sustainable development: environmental policy; natural science 2. Biological<br />
Diversity; conservation 3. Economic Structure: development 4. <strong>Ecological</strong> <strong>Footprint</strong>;<br />
environmental education 5. Middle-west region – <strong>Campo</strong> <strong>Grande</strong>: Brazil<br />
I. WWF-Brasil II. ecosSISTEMAS III. <strong>Global</strong> <strong>Footprint</strong> <strong>Network</strong> IV. Título<br />
CDU 502.31 (817.1)
CONTENTS<br />
INTRODUCTION<br />
Partners Messages 06<br />
Participating Institutions 08<br />
Introduction 09<br />
EXECUTIVE SUMMARY 12<br />
<strong>The</strong> <strong>Ecological</strong> <strong>Footprint</strong> as a Sustainbility Indicator 20<br />
What is the <strong>Ecological</strong> <strong>Footprint</strong>? 24<br />
What is Biocapacity? 26<br />
<strong>The</strong> <strong>Ecological</strong> Overload is Growing 27<br />
<strong>The</strong> <strong>Footprint</strong> Family and the Environmental Pressures<br />
they Represent 32<br />
THE ECOLOGICAL FOOTPRINT 44<br />
CONCLUSIONS 74<br />
Bibliographic References and recommended reading 80<br />
ATTACHMENTS 84<br />
<strong>Ecological</strong> <strong>Footprint</strong>: frequent questions 86<br />
GLOSSARY 90<br />
<strong>Campo</strong> <strong>Grande</strong> <strong>Ecological</strong> <strong>Footprint</strong> p. 5
Partners’messages<br />
PARTNERS’MESSAGES<br />
WWF Brasil<br />
Situated on the edge <strong>of</strong> the Pantanal, one <strong>of</strong> Brazil’s most important<br />
biomes, <strong>Campo</strong> <strong>Grande</strong> is a planned city. However like most<br />
Brazilian cities it too faces the dilemma <strong>of</strong> how to keep growing but<br />
on a more sustainable footing, while at the same time providing<br />
better living conditions for its inhabitants without putting even<br />
more pressure on already scarce natural resources. By taking<br />
up the challenge <strong>of</strong> this pioneering work to measure its own<br />
ecological footprint alongside WWF-Brasil, the city has now<br />
acquired a precious tool that will help it to overcome that challenge.<br />
Calculating the <strong>Ecological</strong> <strong>Footprint</strong> is just the first step <strong>of</strong> the<br />
work and serves as the starting point. It reveals where the greatest<br />
pressures on renewable natural resources lie, making it possible<br />
to determine the direction <strong>of</strong> possible actions to be undertaken in<br />
the sphere <strong>of</strong> public policies and on the part <strong>of</strong> companies and the<br />
citizens <strong>of</strong> <strong>Campo</strong> <strong>Grande</strong> in a bid to reduce those pressures.<br />
ecosSISTEMAS<br />
<strong>The</strong> Planet Earth has a limited capacity to provide human society<br />
with all the resources it needs for the survival and prosperity <strong>of</strong> the<br />
species. Because <strong>of</strong> its ignorance <strong>of</strong> ecological limitations, humanity<br />
has been making use <strong>of</strong> a kind <strong>of</strong> planetary ‘overdraft’ and the<br />
interest on it is gradually consuming the maintenance capacity <strong>of</strong> the<br />
ecosystems that support life on Earth. <strong>The</strong> <strong>Campo</strong> <strong>Grande</strong> <strong>Ecological</strong><br />
<strong>Footprint</strong> study has clearly revealed the size <strong>of</strong> that interest payment,<br />
in other words the effective availability <strong>of</strong> natural resources in the<br />
<strong>Campo</strong> <strong>Grande</strong> region, and the actual demand being made on them<br />
to meet the populations needs. What is more important, this work<br />
indicates ways in which public administration can develop the<br />
municipality within the limits <strong>of</strong> nature; an ability that is more than<br />
necessary for any public administration being conducted in the 21st<br />
century. <strong>The</strong> moment could not be more propitious.<br />
<strong>Campo</strong> <strong>Grande</strong> <strong>Ecological</strong> <strong>Footprint</strong> 2012 p. 6
<strong>Global</strong> <strong>Footprint</strong> <strong>Network</strong><br />
<strong>Ecological</strong> assets are rapidly becoming a decisive factor <strong>of</strong><br />
competitiveness in global affairs; those cities and countries that<br />
have a good knowledge <strong>of</strong> their ecological assets, manage them well,<br />
protect them and make use <strong>of</strong> them in a rational way are going to<br />
find themselves in much more favourable positions. As populations<br />
and wealth increase around the world, the interactions between<br />
the demands <strong>Campo</strong> <strong>Grande</strong> residents make on the biosphere<br />
and the extraordinary ecological assets that are to be found in<br />
the surrounding region are going to determine the city’s future<br />
viability. <strong>The</strong> act <strong>of</strong> making available to the city’s citizens and<br />
administrators a detailed register <strong>of</strong> those resources and the way<br />
they are being used will enable them to take advantage, not only <strong>of</strong><br />
their knowledge <strong>of</strong> limitations but <strong>of</strong> the opportunities the coming<br />
years will have to <strong>of</strong>fer.<br />
NEPES – Economic and Social Science Studies and<br />
Research Nucleus at the Anhanguera University - Uniderp<br />
<strong>The</strong> Anhanguera University –Uniderp, located in the state <strong>of</strong><br />
Mato Grosso do Sul, is a national reference in terms <strong>of</strong> higher<br />
education, whether it be standard classroom or distance learning<br />
contexts. It fosters an inseparable combination <strong>of</strong> teaching,<br />
research and learning and adopts a contextualised vision <strong>of</strong> the<br />
human being and <strong>of</strong> the world. In harmony with models <strong>of</strong> society<br />
and <strong>of</strong> education in constant transformation, it strives to provide<br />
a plural, global, critical and reflective formation for its students.<br />
Based on what it considers to be the essential elements for<br />
organizing knowledge and information, the university stimulates<br />
its students to appropriate and to produce scientific knowledge, to<br />
exercise their citizenship and to value the principles <strong>of</strong> tolerance<br />
and sociability. Currently it has 250 distance learning centres in<br />
Brazil and three units in Mato Grosso do Sul <strong>of</strong>fering courses in<br />
traditional classroom settings.<br />
<strong>Campo</strong> <strong>Grande</strong> <strong>Ecological</strong> <strong>Footprint</strong> p. 7
Participating Institutions<br />
Participating Institutions<br />
List <strong>of</strong> all those that took part in the Mobilisation for the <strong>Campo</strong><br />
<strong>Grande</strong> <strong>Ecological</strong> <strong>Footprint</strong><br />
Águas Guariroba – [Water Supply Concession Holder for the State <strong>of</strong> Mato<br />
Grosso do Sul)<br />
Ananhanguera – [University for the Development <strong>of</strong> the State and the Pantanal<br />
Region](UNIDERP)<br />
Associação de Proprietários de RPPNs de MS (REPAMS)<br />
[Association <strong>of</strong> Private Nature Reserve Proprietors]<br />
Blink – Rádio FM<br />
Central de Comercialização de Economia Solidária de MS (CCES)<br />
[Economy <strong>of</strong> Solidarity Trading Centre]<br />
Conselho Estadual de Saúde (SESAU) [State Health Council]<br />
Conselho Municipal de Meio Ambiente (CMMA) [State Environmnet Council]<br />
Delegacia de Crimes Ambientais (DECAT) [Environmental Crimes Precinct]<br />
Espaço Imaginário –[Imaginary Space]<br />
Fórum Estadual de Economia Solidário (FEES/MS) [Economy <strong>of</strong> Solidarity<br />
State Forum]<br />
Fundação Nacional de Saúde (FUNASA) [National Health Foundation]<br />
Instituto Brasileiro de Meio Ambiente (IBAMA) [Brazilian Environment<br />
Institute]<br />
Instituição Grupo Cidadão [Citizens Group]<br />
Instituto de Permacultura Cerrado/ Pantanal (IPCP) [Pantanal Cerrado<br />
Permaculture Institute]<br />
Secretaria de Desenvolvimento Socioeconômico (SEDESC) [Department <strong>of</strong><br />
Socio-economic Development]<br />
Secretaria de Meio Ambiente e Desenvolvimento Urbano (SEMADUR)<br />
[Environment amd Urban Development Department]<br />
Secretaria Municipal de Educação (SEMED) [Municipal<br />
EducationDepartment]<br />
Sociedade INCRA/MDA [INCRA/MDA partnership]<br />
Universidade Católica Dom Bosco (UCDB) [Dom Bosco Catholic University]<br />
Universidade Federal de Mato Grosso do Sul (UFMS) [Federal University <strong>of</strong><br />
Mato Grosso do Sul]<br />
Technical Consultant for the Mobilisation Workshops<br />
Josenildo Sousa e Silva – UNIR de Rondônia<br />
<strong>Campo</strong> <strong>Grande</strong> <strong>Ecological</strong> <strong>Footprint</strong> 2012 p. 8
INTRODUCTION<br />
WWF-Brasil<br />
With the greatest satisfaction we can now present the results <strong>of</strong> the<br />
research undertaken to establish the <strong>Ecological</strong> <strong>Footprint</strong> <strong>of</strong> the city <strong>of</strong><br />
<strong>Campo</strong> <strong>Grande</strong>, the first Brazilian city to carry out such a calculation.<br />
<strong>The</strong> <strong>Ecological</strong> <strong>Footprint</strong> <strong>of</strong> a country, state, city or even <strong>of</strong><br />
a person corresponds to the amount <strong>of</strong> productive land and sea<br />
needed to produce and sustain a given style <strong>of</strong> living. It is a way <strong>of</strong><br />
translating into hectares the territorial expanse that a person or a<br />
population or a city, state or country uses, on average, to sustain<br />
their ways <strong>of</strong> eating, dwelling, moving around, taking their leisure<br />
and consuming, among others. Today most countries already have<br />
the calculation <strong>of</strong> their ecological footprints available but it can also<br />
be done on an individual basis. 1 Currently the methodology is being<br />
applied in various cities around the world but in Brazil, <strong>Campo</strong><br />
<strong>Grande</strong> was the first municipality to adopt the calculation.<br />
<strong>The</strong> partnership established between WWF-Brasil and the<br />
Municipal Authority <strong>of</strong> the capital <strong>of</strong> the state <strong>of</strong> Mato Grosso do<br />
Sul, the support given by the <strong>Global</strong> <strong>Footprint</strong> <strong>Network</strong> (GFN), the<br />
ecoSISTEMAS organization and the University <strong>of</strong> Anhanguera’s<br />
Economic and Social Science Studies and Research Nucleus (NEPES)<br />
have all helped to make it possible to conduct this pioneering study in<br />
Brazil, namely, the calculation <strong>of</strong> the <strong>Ecological</strong> <strong>Footprint</strong> <strong>of</strong> a city.<br />
<strong>The</strong> choice <strong>of</strong> the capital city <strong>of</strong> the state <strong>of</strong> Mato Grosso to be the<br />
first Brazilian city to apply this methodology was based on certain<br />
factors. <strong>Campo</strong> <strong>Grande</strong> is the capital city <strong>of</strong> a Brazilian state that<br />
encompasses most <strong>of</strong> the Pantanal, a region <strong>of</strong> the greatest importance<br />
because <strong>of</strong> its fantastic environmental richness but at the same time<br />
highly threatened by the degradation in course stemming from<br />
exaggerated consumption patterns. While it is true that <strong>Campo</strong> <strong>Grande</strong><br />
is in the environs <strong>of</strong> the Pantanal formation and not actually in it, the<br />
consumer habits <strong>of</strong> the city’s residents have effects on the Pantanal just<br />
as such choices have on the environment in other parts <strong>of</strong> Brazil.<br />
1 For a list <strong>of</strong> countries cf: http://www.footprintnetwork.org/en/index.php/GFN/page/<br />
footprint_for_nations/<br />
<strong>Campo</strong> <strong>Grande</strong> <strong>Ecological</strong> <strong>Footprint</strong> p. 9
Introduction<br />
<strong>The</strong> capital <strong>of</strong> the state <strong>of</strong> Mato Grosso do Sul <strong>of</strong>fered ideal conditions<br />
for carrying out the survey and studies because it has a pr<strong>of</strong>ile similar to<br />
that <strong>of</strong> other Brazilian cities where it has been possible to exercise some<br />
influence on the direction <strong>of</strong> urban planning. This means that the experience<br />
could very easily serve as a model for other city authorities who might be<br />
interested in developing the same methodology for their cities thereby<br />
expanding the work and scaling it up to the regional or even national level.<br />
However, the most important factor <strong>of</strong> all was the willingness <strong>of</strong> the<br />
municipal authority <strong>of</strong> <strong>Campo</strong> <strong>Grande</strong> to enter into this partnership arrangement<br />
without which the work could never have been carried out. <strong>The</strong> support <strong>of</strong> the<br />
Economic and Social Science Studies and Research Nucleus <strong>of</strong> the Anhanguera<br />
University and its contribution in supplying data extracted from the Family<br />
Budget Survey was absolutely fundamental to the success <strong>of</strong> this action.<br />
It must be stressed that the aim <strong>of</strong> the footprint calculation is not to paint a<br />
negative portrait <strong>of</strong> the city. <strong>The</strong> idea is to <strong>of</strong>fer the city a tool for better public<br />
administration, mobilise the general public in regard its consumer habits and<br />
encourage it to choose more sustainable products while at the same time opening<br />
up a dialogue with businessmen to encourage them to improve their production<br />
chains. Also there can be no doubt that any reduction in the consumption <strong>of</strong><br />
natural resources can only be achieved slowly over the long term.<br />
We would like the <strong>Ecological</strong> <strong>Footprint</strong> study to inspire consistent<br />
long term planning that manages to go beyond the normal limits <strong>of</strong> public<br />
administration and achieve continuity, irrespective <strong>of</strong> who is in power in local<br />
government at one time or another.<br />
In that sense the work carried out with the various social actors is<br />
fundamental to ensure the success <strong>of</strong> the <strong>Ecological</strong> <strong>Footprint</strong> as a management<br />
tool because it depends on the performance <strong>of</strong> the pubic authorities, <strong>of</strong> the<br />
corporate world and <strong>of</strong> civil society and they should come together for the joint<br />
formulation <strong>of</strong> strategies designed to mitigate the <strong>Ecological</strong> <strong>Footprint</strong>.<br />
Furthermore, we believe that this is the kind <strong>of</strong> work cannot be finalized<br />
from one day to another. It is long-term work and there are many essential stages<br />
involved. But it must start now. That is why the numbers that compose this X-ray,<br />
particularly those associated to the most critical aspects, must be analysed in<br />
order to institute an action plan agreed to by all the partners and destined, the<br />
next time the footprint is measured, to bring in more encouraging results so that<br />
<strong>Campo</strong> <strong>Grande</strong> will begin to be seen as an increasingly sustainable city.<br />
Michael Becker<br />
Cerrado Pantanal Programme Coordinator for WWF-Brasil<br />
Maria Cecília Wey de Brito<br />
Chief Executive Officer - WWF-Brasil<br />
<strong>Campo</strong> <strong>Grande</strong> <strong>Ecological</strong> <strong>Footprint</strong> 2012 p. 10
<strong>The</strong> <strong>Campo</strong> <strong>Grande</strong> Municipal Authority<br />
To us, the fact that <strong>Campo</strong> <strong>Grande</strong> is the first Brazilian city to have its<br />
<strong>Ecological</strong> <strong>Footprint</strong> calculated is a great honour. This methodology, which is<br />
designed to calculate the amount <strong>of</strong> natural resources we use because <strong>of</strong> our<br />
style <strong>of</strong> life and habits, has been applied for the first time in a city and <strong>Campo</strong><br />
<strong>Grande</strong> has taken the lead and committed itself to sustainability.<br />
We believe that by making this diagnosis we are creating an opportunity<br />
to measure the impacts caused by the pressure <strong>of</strong> human consumption<br />
on natural resources and so be able to plan, in due course, environmental<br />
actions that will improve the quality <strong>of</strong> life <strong>of</strong> <strong>Campo</strong> <strong>Grande</strong> citizens.<br />
This concern with sustainability is reflected in the actions that are being<br />
unfolded in the capital <strong>of</strong> Mato Grosso do Sul. Among them we can point<br />
to the production <strong>of</strong> organic food products and their inclusion in the school<br />
meals programme.<br />
We have also set in motion a policy directed at air pollution with a<br />
system to control the pollution caused by the urban vehicle fleet as well<br />
as monitoring the quality <strong>of</strong> surface waters and the recuperation <strong>of</strong> our<br />
springs and the management and expansion <strong>of</strong> our areas <strong>of</strong> vegetation.<br />
<strong>The</strong>re are incentives for practices directed at sustainability in the<br />
construction industry and above all, the management <strong>of</strong> all kinds <strong>of</strong> waste<br />
and residues generated in the municipality; all those actions are already<br />
being unfolded.<br />
<strong>The</strong> <strong>Ecological</strong> <strong>Footprint</strong> provides indicators that are highly useful<br />
in planning such actions. Because it is linked to human consumption<br />
this methodology is capable <strong>of</strong> delineating the limits for economic and<br />
demographic growth as a function <strong>of</strong> the effectively available ecological<br />
resources.<br />
For all those reasons the footprint calculation <strong>of</strong>fers us a valuable public<br />
administration tool that will make it possible for the municipal authority<br />
to orientate its actions and projects directed at reducing the footprint more<br />
efficiently.<br />
By using the footprint as a sustainability indicator we can be sure that,<br />
irrespective <strong>of</strong> who is in control <strong>of</strong> the municipal government, we will have a<br />
municipality that is heading in the right direction.<br />
Marcos Cristaldo<br />
Head <strong>of</strong> the Environment and Urban Development Department<br />
Nelson Trad Filho<br />
Mayor <strong>of</strong> the Municipality <strong>of</strong> <strong>Campo</strong> <strong>Grande</strong><br />
<strong>Campo</strong> <strong>Grande</strong> <strong>Ecological</strong> <strong>Footprint</strong> p. 11
EXECUTIVE SUMMARY ~<br />
<strong>The</strong> <strong>Ecological</strong> <strong>Footprint</strong> methodology is used to<br />
measure the ‘tracks’ or footprints that we leave<br />
on the Planet associated to our consumer habits.<br />
<strong>The</strong> calculation has already been made for some<br />
countries and is now being expanded to a more local<br />
level, namely, the cities. Some cities in the world are<br />
already testing the methodology but in Brazil this is<br />
the first time it is being applied to a city and <strong>Campo</strong><br />
<strong>Grande</strong> is a pioneer in this work.
© WWF-Brasil/ Sérgio Amaral
Executive summary<br />
<strong>The</strong> aim <strong>of</strong> the work is not just to calculate the municipality’s<br />
<strong>Ecological</strong> <strong>Footprint</strong>, but also to constitute the footprint as a<br />
valuable urban environmental management tool. <strong>The</strong> calculation is<br />
certainly a fundamental part <strong>of</strong> the process but for the indicator to<br />
have any meaning, the population must be mobilised to ensure that<br />
it understands its significance and make it possible, based on the<br />
discussions <strong>of</strong> the results, to develop mitigation strategies alongside<br />
the public and private sectors. In that way the calculation will not be<br />
restricted to the sphere <strong>of</strong> a mere environmental balance sheet, but<br />
will become a tool capable <strong>of</strong> stimulating the general public to review<br />
its consumer habits and choose more sustainable products, as well as<br />
stimulating companies to improve their production chains.<br />
<strong>Ecological</strong><br />
<strong>Footprint</strong><br />
Figure 1: Strategic<br />
Lines <strong>of</strong> <strong>Campo</strong> <strong>Grande</strong>’s<br />
<strong>Ecological</strong> <strong>Footprint</strong><br />
Calculation<br />
Mobilisation<br />
Mitigation<br />
<strong>The</strong> <strong>Ecological</strong> <strong>Footprint</strong> <strong>of</strong> a country, state or city or even <strong>of</strong><br />
a person corresponds to the amount <strong>of</strong> productive land and sea<br />
needed to produce and sustain a given style <strong>of</strong> living. It is a way<br />
<strong>of</strong> translating into hectares the territorial expanse that a person<br />
or a population or a city, state or country uses on average, to<br />
sustain their forms <strong>of</strong> eating, dwelling, mobility, dressing moving<br />
around, taking their leisure and consuming goods in general<br />
It is important to state that what is being considered for this<br />
particular calculation is the impact <strong>of</strong> consumption on renewable<br />
natural resources.<br />
Within the set <strong>of</strong> footprints that make up the footprint family<br />
the <strong>Ecological</strong> <strong>Footprint</strong> has some features that are different<br />
<strong>Campo</strong> <strong>Grande</strong> <strong>Ecological</strong> <strong>Footprint</strong> 2012 p. 14
from the ‘Water <strong>Footprint</strong>’ or the ‘Carbon <strong>Footprint</strong>’ – especially<br />
in regard to the outreach <strong>of</strong> its analysis. While the <strong>Ecological</strong><br />
<strong>Footprint</strong> evaluates in a broad way, the impacts <strong>of</strong> consumption<br />
on the Biosphere, the Water <strong>Footprint</strong> portrays its impacts on<br />
water resources and on a given production chain. That kind <strong>of</strong><br />
approach also typifies the Carbon <strong>Footprint</strong>, which analyses<br />
greenhouse gas emissions associated to a given activity or<br />
production process.<br />
<strong>The</strong> <strong>Ecological</strong> <strong>Footprint</strong> is an environmental accounting<br />
methodology that evaluates the pressure that human populations’<br />
consumption puts on natural resources. It is expressed in<br />
global hectares (gha) and that makes it possible to compare<br />
different consumption patterns and check whether they lie<br />
within the ecological capacity <strong>of</strong> the planet. One global hectare<br />
is defined as one hectare with the global average productivity <strong>of</strong><br />
productive lands and seas in a given year. In turn, biocapacity<br />
is the ecosystems’ capacity to produce the renewable natural<br />
resources needed for human consumption and to absorb the the<br />
residues and waste generated by the population’s activities. <strong>The</strong><br />
overriding objective <strong>of</strong> the <strong>Ecological</strong> <strong>Footprint</strong> is to check whether<br />
consumption and biocapacity are in equilibrium.<br />
That being so, the <strong>Ecological</strong> <strong>Footprint</strong> compares the<br />
biocapacity described for the various ecological resources<br />
(agriculture, pastures, forests, fisheries, built up areas, energy and<br />
areas needed to absorb Carbon Dioxide, for different categories <strong>of</strong><br />
consumption (food, housing, mobility and transport, goods and<br />
services, government and infrastructure). <strong>The</strong> day-to-day decisions<br />
that are made in the different consumer categories generate an<br />
impact on biocapacity.<br />
Currently the world average for the <strong>Ecological</strong> <strong>Footprint</strong> is 2.7<br />
global hectares per person while the available biocapacity for each<br />
human being is only 1.8 global hectares. <strong>The</strong>refore there is a capacity<br />
deficit <strong>of</strong> 0.9 global hectares. In other words humanity is currently<br />
consuming one and a half planets, exceeding the planet’s capacity to<br />
regenerate by 50%. In the mid-eighties humanity began consuming<br />
more than the planet naturally has to <strong>of</strong>fer and has been consuming<br />
above the necessary one-planet level ever since. Predictions for the<br />
year 2050 suggest that, if we carry on like this, we will need two<br />
planets to maintain our consumer patterns.<br />
<strong>The</strong> <strong>Ecological</strong> <strong>Footprint</strong> for Brazil as a whole is 2.9 global hectares<br />
per inhabitant, which means that average resource consumption in<br />
Brazil is fairly close to the world <strong>Ecological</strong> <strong>Footprint</strong>.<br />
<strong>Campo</strong> <strong>Grande</strong> <strong>Ecological</strong> <strong>Footprint</strong> p. 15
Executive summary<br />
<strong>Campo</strong> <strong>Grande</strong>’s <strong>Ecological</strong> <strong>Footprint</strong><br />
<strong>The</strong> average <strong>Ecological</strong> <strong>Footprint</strong> <strong>of</strong> an inhabitant <strong>of</strong> the city <strong>of</strong><br />
<strong>Campo</strong> <strong>Grande</strong> is 3.14 global hectares. That means that if everyone<br />
in the world were to consume in the same way as <strong>Campo</strong> <strong>Grande</strong><br />
dwellers, almost two planets would be needed to keep up their style<br />
<strong>of</strong> living.<br />
To adequately supply the 787,204 inhabitants <strong>of</strong> <strong>Campo</strong> <strong>Grande</strong><br />
with renewable natural resources, an area corresponding to<br />
2,471,821 global hectares would be needed.<br />
<strong>The</strong> city’s <strong>Ecological</strong> <strong>Footprint</strong> is 8% bigger than the Brazilian<br />
one, 10% higher than the footprint for the state <strong>of</strong> Mato Grosso<br />
do Sul and 14% larger than the world average. In turn, the state<br />
<strong>of</strong> Mato Grosso do Sul’s footprint is 3% larger than the Brazilian<br />
average which is 2.9 global hectares per person.<br />
On comparing ecological resources we can see that the<br />
consumption <strong>of</strong> resources in <strong>Campo</strong> <strong>Grande</strong> is similar to the overall<br />
Brazilian pattern in the its distribution average and it mainly<br />
calls for areas <strong>of</strong> pastureland , cropland and forests. <strong>The</strong>re is less<br />
pressure for CO2 absorption than the global average mainly due to<br />
the low emissions associated to the energy matrix and the intensive<br />
use <strong>of</strong> bi<strong>of</strong>uels in Brazil (figure 2).<br />
3,50<br />
3,00<br />
Figure 2: Comparisons<br />
by ecological resources in<br />
gha/capita<br />
Key<br />
2,50<br />
2,00<br />
1,50<br />
1,00<br />
0,50<br />
Energy and CO 2<br />
Absorption<br />
Built up Areas<br />
Fisheries<br />
Forests<br />
Pastures<br />
Agriculture<br />
0.0<br />
<strong>Campo</strong><br />
<strong>Grande</strong><br />
Mato Grosso<br />
do Sul<br />
Brazil<br />
World<br />
<strong>Campo</strong> <strong>Grande</strong> <strong>Ecological</strong> <strong>Footprint</strong> 2012 p. 16
Figure 3: <strong>Campo</strong><br />
<strong>Grande</strong>’s <strong>Footprint</strong> by<br />
<strong>Ecological</strong> Resources<br />
Key<br />
Energy and CO 2<br />
Absorption<br />
Built up Areas<br />
Fisheries<br />
Forests<br />
Pastures<br />
Agriculture<br />
<strong>The</strong> ecological resources used by agriculture (grain and<br />
vegetable production and other plant-based food products),<br />
pastures (meat, leather, wool and fats production and other<br />
animal-based products) and forests (wood, fibres, paper, forest<br />
essences and land use conversion) represent 75% <strong>of</strong> the city’s<br />
<strong>Ecological</strong> <strong>Footprint</strong> (figure 3).<br />
This high level <strong>of</strong> resource consumption on the part <strong>of</strong><br />
agriculture and pastures can be more readily perceived when<br />
<strong>Campo</strong> <strong>Grande</strong>’s <strong>Ecological</strong> <strong>Footprint</strong> is broken down into the<br />
various consumption categories.<br />
Most <strong>of</strong> <strong>Campo</strong> <strong>Grande</strong> population’s <strong>Ecological</strong> <strong>Footprint</strong> is<br />
associated to nutrition and services, especially restaurants, which<br />
reflects on the eating habits <strong>of</strong> the citizens. A city dweller in <strong>Campo</strong><br />
<strong>Grande</strong> spends 13% more on meat than Brazilians in general and<br />
actually shows up as one <strong>of</strong> the worlds greatest meat consumers: almost<br />
90 kg per person per annum, more than twice the global average. 2<br />
Comparatively, <strong>Campo</strong> <strong>Grande</strong>’s <strong>Ecological</strong> <strong>Footprint</strong><br />
differs from the Brazilian figures according to the category <strong>of</strong><br />
consumption analysed: Food (6% more), Housing (53% more),<br />
Services (42% more), Mobility and Transport (10% more), Goods<br />
(13% less). (Figure 4).<br />
2 http://earthtrends.wri.org<br />
<strong>Campo</strong> <strong>Grande</strong> <strong>Ecological</strong> <strong>Footprint</strong> p. 17
Executive summary<br />
9%<br />
Figure 4: <strong>Campo</strong><br />
<strong>Grande</strong>’s <strong>Footprint</strong> by<br />
Consumption Categories<br />
18%<br />
Key<br />
15%<br />
6% 7%<br />
45%<br />
Nevertheless, an analysis <strong>of</strong> <strong>Ecological</strong> <strong>Footprint</strong>-related data<br />
only makes any sense when we consider the cultural and socioeconomic<br />
contexts and seek in that way to find sustainable ways<br />
<strong>of</strong> using renewable natural resources. Aggregating value to beef<br />
production by allying it the conservation <strong>of</strong> the Pantanal is one<br />
way <strong>of</strong> reducing the overall impacts the activity generates and <strong>of</strong><br />
bringing in benefits to the beef producer and that is an example<br />
being set by the Brazilian Organic Livestock Association (ABPO).<br />
<strong>The</strong> choice <strong>of</strong> the capital <strong>of</strong> the state <strong>of</strong> Mato Grosso do Sul<br />
to be the first Brazilian city to undertake the application <strong>of</strong> this<br />
methodology was based on two aspects: <strong>Campo</strong> <strong>Grande</strong> is the<br />
capital <strong>of</strong> the Brazilian state in which lies the greater part <strong>of</strong> the<br />
Pantanal, a region <strong>of</strong> enormous environmental wealth but at the<br />
same time highly threatened with degradation caused by certain<br />
unsustainable consumption patterns. While it is true that <strong>Campo</strong><br />
<strong>Grande</strong> is on the edge <strong>of</strong> the Pantanal and not inside the region, the<br />
impacts caused by the patterns <strong>of</strong> city dwellers’ consumer choices<br />
as well as those <strong>of</strong> consumers in other parts <strong>of</strong> Brazil and the world<br />
at large have strong effects on the Pantanal floodplain.<br />
<strong>Campo</strong> <strong>Grande</strong> <strong>of</strong>fered ideal conditions for undertaking the<br />
research because it has a similar pr<strong>of</strong>ile to many other Brazilian<br />
cities where there still exists some possibility <strong>of</strong> determining the<br />
direction urban development takes. It means that the pioneer<br />
experience here may provide a model that can be applied by other<br />
municipal authorities that are also interested in carrying in applying<br />
this methodology and so it will be possible to scale up the work to<br />
the regional or even national sphere.<br />
Food<br />
Housing<br />
Mobility and<br />
Transport<br />
Goods<br />
Services<br />
Government and<br />
Infrastructure<br />
<strong>Campo</strong> <strong>Grande</strong> <strong>Ecological</strong> <strong>Footprint</strong> 2012 p. 18
It must be borne in mind that over 80% <strong>of</strong> the Brazilian population<br />
lives in urban settings (IBGE, 2010). Metropolitan agglomerations and<br />
the 49 Brazilian cities with over 350 thousand inhabitants are home<br />
to more than half the country’s urban population and responsible<br />
for approximately 65% <strong>of</strong> the Brazilian GNP. Furthermore, the<br />
consumption patterns <strong>of</strong> the Brazilian population have been changing.<br />
According to a report produced by the Data Popular organisation<br />
entitled ‘Differences and Similarities among the Brazilian Regions’,<br />
spending on eating out and beverages in the Northeast macro-region<br />
has increased by 525.6% over the last eight years 3 .<br />
<strong>The</strong> <strong>Ecological</strong> <strong>Footprint</strong> is an important tool for urban<br />
environmental management and can help to orientate economic flows<br />
in developing centres and lead managers to establish sustainable<br />
strategies for determining the way they make use <strong>of</strong> natural resources.<br />
Furthermore the <strong>Ecological</strong> <strong>Footprint</strong> takes into account the<br />
limitations <strong>of</strong> existing natural assets and that means that it is not<br />
sufficient merely to improve efficiency in resource use, especially<br />
if the ricochet effect on economies is taken into account 4 . What is<br />
needed is to think in terms <strong>of</strong> qualitative growth <strong>of</strong> the economies<br />
and their interactions with the environment, remembering that the<br />
extraction <strong>of</strong> renewable environmental resources also influences<br />
land use and settlement in the territories around us.<br />
In 2050 the planet’s population will hit the nine billion mark and<br />
the <strong>Ecological</strong> <strong>Footprint</strong> <strong>of</strong>fers us an excellent chance to question<br />
our consumer patterns and habits especially in the urban context. It<br />
will be necessary to establish agreements among different regions<br />
and countries to guarantee supplies <strong>of</strong> ecological resources to urban<br />
centres. Production chains will have to be re-thought in terms <strong>of</strong> the<br />
real needs <strong>of</strong> the inhabitants and consumer habits will have to change.<br />
<strong>Ecological</strong> <strong>Footprint</strong> calculations make societies stop to think<br />
about the adaptations needed to ensure access to the ecological<br />
resources that sustain life on earth but that are limited and finite.<br />
<strong>The</strong> pioneering experience in <strong>Campo</strong> <strong>Grande</strong> is a considerable<br />
contribution towards that process. It is hoped that other Brazilian<br />
cities will follow this example and include the <strong>Ecological</strong> <strong>Footprint</strong> as<br />
an environmental indicator in their management strategies and urban<br />
planning in the bid to establish a network <strong>of</strong> sustainable cities.<br />
3 Taken from the March 9 2010 issue <strong>of</strong> Valor Econômico.<br />
4 <strong>The</strong> ricochet effect postulates that any savings <strong>of</strong> natural resources achieved through the<br />
introduction <strong>of</strong> new technologies is rapidly neutralised by the overall increase in resource use.<br />
<strong>Campo</strong> <strong>Grande</strong> <strong>Ecological</strong> <strong>Footprint</strong> p. 19
<strong>The</strong> <strong>Ecological</strong> <strong>Footprint</strong> as a sustainability indicator<br />
THE ECOLOGICAL FOOTPRINT AS<br />
A SUSTAINABILITY INDICATOR<br />
We must reflect in order to measure; not measure in order to reflect.<br />
Gaston Bachelard<br />
WWF’s 2010 biennial report basically revealed that globally<br />
there has been a 30% loss <strong>of</strong> biodiversity: “humanity is no longer<br />
living <strong>of</strong>f the interest <strong>of</strong> its natural capital, it is using up the capital<br />
itself” and “at this level <strong>of</strong> ecological deficit, the final exhaustion <strong>of</strong><br />
ecological assets and the massive collapse <strong>of</strong> the ecosystems seem<br />
to be increasingly probable”, the report declares.<br />
Currently humanity is consuming renewable resources a faster<br />
rate than the rate ecosystems are capable <strong>of</strong> regenerating them,<br />
and it continues to liberate more carbon dioxide (CO2) then the<br />
ecosystems are capable <strong>of</strong> absorbing.<br />
<strong>The</strong> Meadows et al. report (1972), entitled <strong>The</strong> Limits to Growth 5<br />
already announced back then a time limit for the expansion <strong>of</strong> the<br />
current model for world development: “If present day tendencies<br />
in population growth, industrialization, pollution, food production<br />
and the exhaustion <strong>of</strong> natural resources are not changed, the limits<br />
to growth on this planet will be arrived at some time in the coming<br />
100 years. <strong>The</strong> most likely result will be a sudden uncontrollable<br />
decline in the population and in industrial capacity”.<br />
Beside portraying that scenario however, the Meadows report also<br />
set out the key formula for achieving sustainable development: “It is<br />
possible to change those growth tendencies and establish a situation<br />
<strong>of</strong> economic stability that will be sustainable over the long term”.<br />
Later, in 1983, the Brundtland Commission Report 6 ‘Our Common<br />
Future’ produced by the United Nations World Commission on<br />
Environment and Development (WCED) was to reinforce the human<br />
side <strong>of</strong> the sustainable development concept. In addition to warning<br />
about the set <strong>of</strong> problems involving the environment the Brundtland<br />
Report underscores the connection between “the deterioration <strong>of</strong> the<br />
human condition” and extreme poverty and inequality in the world.<br />
5 Meadows, Donella, J. Randers and D. Meadows (1972). Limits to Growth.New York: Universe Books.<br />
6 WCED (1987): Our Common Future. World Commission on Environment and Development, Oxford.<br />
<strong>Campo</strong> <strong>Grande</strong> <strong>Ecological</strong> <strong>Footprint</strong> 2012 p. 20
In 1992, the evolution <strong>of</strong> sustainable development thinking was<br />
boosted by the contributions <strong>of</strong> 1,600 scientists from 72 countries<br />
– among them 102 Nobel Prize winners –, who began to call more<br />
attention to the intrinsic connection <strong>of</strong> the ‘enviroment- social –<br />
economic’ triad to the concept <strong>of</strong> sustainable development.<br />
<strong>The</strong> United Nations Conference on Environment and<br />
Development – Rio 92, was held in Rio de Janeiro and elaborated<br />
the document ‘World Scientists Warning to Humanity’ which<br />
shocked public opinion with the following statement: “Human<br />
beings and the Natural world are on a collision course. Human<br />
activities inflict harsh and <strong>of</strong>ten irreversible damage on the<br />
environment and on critical resources. Fundamental changes<br />
are urgent if we are to avoid the collision our present course will<br />
bring about”. According to the scientists it is necessary to create<br />
sustainable development indicators capable <strong>of</strong> orientating decision<br />
making processes and contributing to the sustainability <strong>of</strong> systems<br />
integrated to the environment.<br />
New Indicators for Sustainability<br />
Creating sustainability indicators means elaborating a statistical base<br />
in order to measure the effects <strong>of</strong> social, environmental policies and<br />
economic development policies. Education and family values, the<br />
people’s culture, respect for nature and sustainable exploitation <strong>of</strong> its<br />
resources are some <strong>of</strong> the many key aspects <strong>of</strong> development that the<br />
classical development indicators like the GNP totally fail to capture.<br />
In the view <strong>of</strong> many economists 7 , in addition to financial<br />
resources, an indicator needs to include natural wealth and<br />
assets, and the social and intellectual capital <strong>of</strong> the peoples. <strong>The</strong><br />
GNP for example does not monitor the planet’s environmental<br />
degradation or even the living conditions <strong>of</strong> its populations. In<br />
that light, indicators that take into account peoples’ well being are<br />
more efficient and helpful to making decisions on the progress <strong>of</strong> a<br />
sustainable society.<br />
Chapter 40 <strong>of</strong> the Agenda 21 also stresses that the indicators<br />
usually used to measure economic development do not give any<br />
accurate indications about sustainability because the evaluation<br />
methods employed are imperfect or inadequately applied. In<br />
essence, the indicators <strong>of</strong> sustainable development should be able<br />
7 Redefining Wealth and Progress (1990): New Ways to Measure Economic, Social, and<br />
Environmental Change: <strong>The</strong> Caracas Report on Alternative Development Indicators. Knowledge<br />
Systems Inc.<br />
<strong>Campo</strong> <strong>Grande</strong> <strong>Ecological</strong> <strong>Footprint</strong> p. 21
<strong>The</strong> <strong>Ecological</strong> <strong>Footprint</strong> as a sustainability indicator<br />
to provide decision makers with a solid basis that attempts to<br />
integrate the aspects, <strong>of</strong> economic development, environmental<br />
sustainability and social equilibrium. <strong>The</strong> indicators to be<br />
developed must go beyond merely reflecting growth and be capable<br />
<strong>of</strong> indicating efficiency, sufficiency, equality, and the quality <strong>of</strong> life 8 .<br />
In analysing sustainable development, the definition or<br />
measurement <strong>of</strong> a country’s wealth needs to take into account<br />
the environmental, social and economic aspects. In the process<br />
<strong>of</strong> transformation, governments, companies, organisations and<br />
individuals must search for indicators they can use to guide their<br />
decisions, and elaborate policies and strategies in view <strong>of</strong> the<br />
scarcity <strong>of</strong> natural resources and the unsustainable nature <strong>of</strong> the<br />
current development model.<br />
<strong>The</strong> Human Development Index (HDI) elaborated by the UN<br />
Environment and Development Programme is a well-known<br />
indicator for measuring social development. <strong>The</strong> HDI is obtained<br />
by combining three basic indicators: life expectancy, income<br />
and schooling level. Even so it fails to take into account the<br />
collateral effects <strong>of</strong> progress such as uncontrolled urban growth,<br />
unemployment, increase in the crime rate, new health demands,<br />
pollution, the erosion <strong>of</strong> the family unit, and inequality. Nevertheless<br />
it is still an important indicator that comes close to, and tries to<br />
capture the social aspect <strong>of</strong> sustainability. <strong>The</strong> social aspect <strong>of</strong><br />
sustainable development calls for engagement and confrontation<br />
actions directed at natural resource users in an effort to form a new<br />
kind <strong>of</strong> citizen with an understanding <strong>of</strong> current environmental<br />
problems that is so essential to the full exercise <strong>of</strong> citizenship.<br />
<strong>The</strong> <strong>Ecological</strong> <strong>Footprint</strong> is the other sustainability indicator<br />
that has a strong environmental dimension underlying its<br />
concept. It calls for changes in societies’ consumer and production<br />
habits and such changes can only be achieved if there is strong<br />
engagement <strong>of</strong> civil society, local governments and the private<br />
sector. To redress negative indexes obtained in <strong>Ecological</strong> <strong>Footprint</strong><br />
measurements, stimulating responsible consumption and total<br />
re-cycling, and the implementation <strong>of</strong> social technologies with low<br />
impacts are among some <strong>of</strong> the actions that need to be taken.<br />
If there is to be change then it is essential that all sectors <strong>of</strong><br />
society should feel themselves responsible for making it happen.<br />
8 Meadows, D. (1998): Indicators and Information Systems for Sustainable development.<br />
A report <strong>of</strong> the Balton Group.<strong>The</strong> sustainability Institute, Hartland Four Corners.<br />
<strong>Campo</strong> <strong>Grande</strong> <strong>Ecological</strong> <strong>Footprint</strong> 2012 p. 22
THE DEFINITION OF<br />
A COUNTRY AND ITS<br />
PEOPLES’ WEALTH<br />
MUST CONSIDER THE<br />
TRIAD ENVIRONMENT<br />
– SOCIETY - ECONOMY<br />
© WWF-Brasil/ Allison Ishy © WWF-Brasil/ Allison Ishy © WWF-Brasil/ Sérgio Amaral<br />
<strong>Campo</strong> <strong>Grande</strong> <strong>Ecological</strong> <strong>Footprint</strong> p. 23
<strong>Ecological</strong> Footstep<br />
O WHAT IS THE ECOLOGICAL<br />
FOOTSTEP?<br />
Developed in 1993 by a team headed by Mathis Wackernagel and William<br />
Rees at the University <strong>of</strong> British Columbia, the accounting method<br />
known as the <strong>Ecological</strong> <strong>Footprint</strong> is coordinated nowadays by the <strong>Global</strong><br />
<strong>Footprint</strong> <strong>Network</strong>, founded in 2003, and its 50 partner organisations.<br />
<strong>The</strong> <strong>Ecological</strong> <strong>Footprint</strong> is an accounting methodology that<br />
accompanies humanity’s concurrent demands on the biosphere by<br />
making a comparison between human demands and the plant’s<br />
regenerative capacity. It is achieved by adding up the areas needed to<br />
supply the renewable resources people use with the areas needed to<br />
absorb all the residues (figure 5). <strong>The</strong> balance sheets currently being<br />
used for National <strong>Ecological</strong> <strong>Footprint</strong> accompanies the use <strong>of</strong> resource<br />
materials that include grains, fish for food and other uses, wood<br />
and pastureland for cattle but on the residue side the only one being<br />
measured at the moment is CO 2<br />
emissions.<br />
Because people consume resources from many parts <strong>of</strong> the world, the<br />
<strong>Ecological</strong> <strong>Footprint</strong> being presented here calculates the areas irrespective<br />
<strong>of</strong> where they are located on the Earth’s surface.<br />
To discover whether the human demand for renewable resources and<br />
need for CO 2<br />
absorption is compatible with the planets regenerative capacity,<br />
that is, with its biocapacity, both the <strong>Ecological</strong> <strong>Footprint</strong> (which represents<br />
the demand for renewable resources) and the biocapacity (which represents<br />
the availability <strong>of</strong> renewable resources) are expressed in units known as<br />
global hectares. A global hectare represents the productive capacity <strong>of</strong> one<br />
hectare <strong>of</strong> land considering the world average productivity figures.<br />
In the calculation we take into account many <strong>of</strong> the uses and resources<br />
that can be measured in terms <strong>of</strong> the area needed to maintain biological<br />
productivity. <strong>The</strong>re are some resources and residues, however, that are not<br />
susceptible to being measured in this fashion and they are excluded from the<br />
footprint calculation. Solid residues and water do not enter, as such, in the<br />
<strong>Ecological</strong> <strong>Footprint</strong> calculation.<br />
That fact, however, in no way invalidates the <strong>Ecological</strong> <strong>Footprint</strong><br />
calculation; we just need to remember that the calculation itself<br />
systematically underestimates all the impacts on the environment. It<br />
only detects the use <strong>of</strong> renewable natural resources, but that in itself is<br />
an excellent parameter to measure our progress on the road to a more<br />
sustainable life.<br />
<strong>Campo</strong> <strong>Grande</strong> <strong>Ecological</strong> <strong>Footprint</strong> 2012 p. 24
CARBON<br />
PASTURE<br />
Figure 5: All human<br />
activity makes use <strong>of</strong><br />
biologically productive<br />
land and/or fishery<br />
resources<br />
<strong>The</strong> ecological footprint<br />
is the sum <strong>of</strong> that area<br />
wherever it may lie on the<br />
planet<br />
FOREST AREAS<br />
FISHERIES<br />
ARABLE LAND<br />
BULT UP AREAS<br />
<strong>Footprint</strong> component definitions<br />
SEQUESTERED CARBON<br />
FOOTPRINT<br />
PASTURES FOOTPRINT<br />
FOREST FOOTPRINT<br />
FISHERY FOOTPRINT<br />
ARABLE LAND FOOTPRINT<br />
BUILT UP AREAS FOOTPRINT<br />
Calculated as the quantity <strong>of</strong> forest land needed to absorb CO2 emissions from fossil<br />
fuel use, land use changes, and chemical processes except for the part absorbed by<br />
the oceans. <strong>The</strong>se emissions are the only residual product included in the <strong>Ecological</strong><br />
<strong>Footprint</strong><br />
Calculated as the area used to raise beef and dairy cattle and for production <strong>of</strong> leather<br />
and wool products<br />
Calculation based on a country’s consumption, sawn wood, wood and cellulose<br />
products and firewood<br />
Calculation based on an estimate <strong>of</strong> the primary production needed to sustain<br />
shellfish and fish catches based on catch data covering 1,439 different marine<br />
species and 268 freshwater species<br />
Calculation based on the area used to produce foodstuffs and fibres for human<br />
consumption, feed for cattle, vegetable oils and rubber<br />
Calculation based on the area <strong>of</strong> land covered by human infrastructure including<br />
transport, housing, industrial installations and hydroelectric dam reservoirs<br />
<strong>Campo</strong> <strong>Grande</strong> <strong>Ecological</strong> <strong>Footprint</strong> p. 25
<strong>Ecological</strong> Footstep<br />
WHAT IS BIOCAPACITY?<br />
Biocapacity or biological capacity, is the capacity <strong>of</strong> ecosystems<br />
to produce useful biological materials and to absorb the residues<br />
generated by human beings under current methods <strong>of</strong> management<br />
and extraction technology. Useful biological materials are defined<br />
as whatever materials human economies effectively demanded in a<br />
given year.<br />
Biocapacity embraces:<br />
• Arable land used for the production <strong>of</strong> food, fibres, bio-fuels;<br />
• Pastures for the production <strong>of</strong> animal origin products like beef,<br />
milk leather, wool;<br />
• Continental and marine fisheries;<br />
• Forests, that not only supply wood but also absorb CO 2<br />
.<br />
Biocapacity takes into account the available land and its<br />
productivity measured by the crops or trees growing on each hectare.<br />
Cropland in countries with a dry climate or a cold one, for<br />
example, may be less productive than cropland in countries with<br />
warm or humid climate. If the land and sea <strong>of</strong> a given nation are<br />
highly productive, the country’s biocapacity might be represented<br />
by more global hectares than the actual number <strong>of</strong> hectares <strong>of</strong> its<br />
land area.<br />
Similarly, any increase in productivity <strong>of</strong> crops may be reflected<br />
as in increase in biocapacity. <strong>The</strong> areas <strong>of</strong> land used for the<br />
predominant crops like the cereals have remained relatively stable<br />
since 1961 but the amount produced per hectare has almost doubled.<br />
Biocapacity is a measurement that enables direct comparisons to<br />
be made. Biocapacity is also drawn on by other species that consume<br />
available natural resources for their survival. Thus it is important to<br />
realise that the services provided by the natural ecosystems need to<br />
be shared with the planet’s other living beings.<br />
Both biocapacity and the <strong>Ecological</strong> <strong>Footprint</strong> are expressed in<br />
global hectares (gha) that represent productivity.<br />
<strong>Campo</strong> <strong>Grande</strong> <strong>Ecological</strong> <strong>Footprint</strong> 2012 p. 26
THE ECOLOGICAL OVERLOAD<br />
IS INCREASING<br />
During the 1980s, humanity as a whole passed the point <strong>of</strong><br />
equilibrium where the annual <strong>Ecological</strong> <strong>Footprint</strong> corresponded<br />
to the Earth’s annual biocapacity. In other words, the planet’s<br />
human population began to consume renewable resources faster<br />
than the ecosystems were capable <strong>of</strong> replenishing and emit<br />
more CO2 than the ecosystems were capable <strong>of</strong> absorbing. That<br />
situation is described as ‘ecological overload’ or ‘overshoot’, and it<br />
has persisted ever since. In 2007, humanity’s footprint amounted<br />
to 18 billion gha or 2.7 gha per capita. <strong>The</strong> Earth’s biocapacity<br />
however, only amounted to 11.9 billion gha or 1.8 gha per person<br />
(figure 6 and GFN 2010a). That corresponds to an ecological<br />
overload <strong>of</strong> 50%, which means that the earth would take 1.5 years<br />
to regenerate the renewable resources that people used in 2007<br />
and the same time to absorb all the CO2 for that year. In other<br />
words, people used 1.5 planets in the course <strong>of</strong> their activities (see<br />
chart ‘What does the overload really mean?’).<br />
© WWF-Brasil/ Adriano Gambarini<br />
<strong>Campo</strong> <strong>Grande</strong> <strong>Ecological</strong> <strong>Footprint</strong> p. 27
<strong>Ecological</strong> Footstep<br />
Carbon<br />
Pastures<br />
Forest land<br />
2.0<br />
Arable land<br />
Fisheries<br />
Number <strong>of</strong> Planets<br />
1.5<br />
1.0<br />
0.5<br />
<strong>Global</strong> Biocapacity<br />
Built up Areas<br />
0.0<br />
1961 1971 1981 1991 2001 2007<br />
Year<br />
Figure 6: <strong>Ecological</strong> <strong>Footprint</strong> by Components, 1961–2006<br />
<strong>The</strong> <strong>Footprint</strong> is expressed as a number <strong>of</strong> planets . <strong>The</strong> total biocapacity (white dotted line) is always the equivalent<br />
<strong>of</strong> one Planet Earth although the planet’s productivity varies from year to year. Hydroelectric energy generation is<br />
included under ‘built up areas’ and firewood under ‘forests’ (<strong>Global</strong> <strong>Footprint</strong> <strong>Network</strong>, 2010)<br />
<strong>Campo</strong> <strong>Grande</strong> <strong>Ecological</strong> <strong>Footprint</strong> 2012 p. 28
What does the overload really mean?<br />
How can people be using up 1.5 Earth’s when in fact only one<br />
planet exists? In the same way that we can withdraw more<br />
money from a bank deposit than just the interest it yields, it<br />
is also possible to use up renewable resources at a faster rate<br />
than they are generated. For example, wood can be taken out <strong>of</strong><br />
a forest at a faster rate than it manages to grow back, fish can<br />
be removed from their habitat in greater quantities than their<br />
populations can replace each year and so on. That, however,<br />
cannot be done indefinitely because, eventually, the resources<br />
will be exhausted.<br />
In the same way the CO 2<br />
emissions may exceed the rhythm<br />
at which the forests and other ecosystems can absorb them,<br />
which means that additional lands will be necessary to fully<br />
sequester the emissions.<br />
<strong>The</strong> exhaustion <strong>of</strong> natural resources has already ocurred in<br />
some places. One example is the collapse <strong>of</strong> the cod stocks in<br />
Icelandic fisheries that took place in the 1980s. What usually<br />
happens in such cases is that humanity seeks out other areas<br />
or other species that are still common, to exploit. <strong>The</strong> same<br />
phenomenon can be observed in regard to forest resources.<br />
At current levels <strong>of</strong> consumption, however, sooner or later<br />
those other resources are going to run out as well and also,<br />
some ecosystems will collapse even before their resources have<br />
been completely exhausted.<br />
<strong>The</strong>re is also the question <strong>of</strong> the evident excess <strong>of</strong><br />
greenhouse gases that the vegetation has been incapable <strong>of</strong><br />
absorbing. Increased CO 2<br />
concentrations in the atmosphere<br />
lead to a rise in global temperatures and climate change. <strong>The</strong>y<br />
also cause a process <strong>of</strong> acidification <strong>of</strong> the oceans. All <strong>of</strong> that<br />
represents greater pressures on the biodiversity and on the<br />
ecosystems.<br />
<strong>Campo</strong> <strong>Grande</strong> <strong>Ecological</strong> <strong>Footprint</strong> p. 29
Figure 7: <strong>Ecological</strong> <strong>Footprint</strong><br />
by countries and per capita, 2007<br />
(<strong>Global</strong> <strong>Footprint</strong> <strong>Network</strong>, 2010)<br />
Key<br />
Carbon<br />
Pastures<br />
12<br />
Forests<br />
Fisheries<br />
Arable land<br />
Built up areas<br />
10<br />
Number <strong>of</strong> available global hectares per capita<br />
8<br />
6<br />
4<br />
Brazil<br />
World<br />
2<br />
0<br />
United Arab Emirates<br />
Qatar<br />
Denmark<br />
Belgium<br />
United States <strong>of</strong> America<br />
Estonia<br />
Canada<br />
Australia<br />
Kuweit<br />
Ireland<br />
Netherlands<br />
Finland<br />
Sweden<br />
Czech Republic<br />
Macedonia<br />
Latvia<br />
Norway<br />
Mongolia<br />
Spain<br />
Greece<br />
Singapore<br />
Slovenia<br />
Austria<br />
Saudi Arabia<br />
Uruguay<br />
Germany<br />
Switzerland<br />
France<br />
Italy<br />
Oman<br />
United Kingdom<br />
New Zeeland<br />
Korean Republic<br />
Malaysia<br />
Israel<br />
Japan<br />
Lithuania<br />
Kazakhstan<br />
Portugal<br />
Russian Federation<br />
Poland<br />
Mauritius<br />
Bulgaria<br />
Slovakia<br />
Turkmenistan<br />
Belarus<br />
Croatia<br />
Nepal<br />
Gambia<br />
Chile<br />
Paraguay<br />
Trinidad and Tobago<br />
Lybia<br />
Mexico<br />
Hungary<br />
Brazil<br />
Lebanon<br />
Ukraine<br />
Venezuela<br />
Panama<br />
Bosnia and Herzogovina<br />
Romania<br />
Turkey<br />
World<br />
Costa Rica<br />
Iran<br />
Botswana<br />
Mauritania<br />
Argentina<br />
Bolivia<br />
Serbia<br />
Thailand<br />
Niger<br />
South Africa<br />
China
Namibia<br />
Papua Nova Guiné<br />
Jordan<br />
El Salvador<br />
Mali<br />
Jamaica<br />
Honduras<br />
Albania<br />
Tunisia<br />
Equador<br />
Azerbaijan<br />
Colombia<br />
Cuba<br />
Georgia<br />
Madagscar<br />
Burma<br />
Guatemala<br />
Ghana<br />
Armenia<br />
Uzbekistan<br />
Sudan<br />
Chad<br />
Guinea<br />
Egypt<br />
Algeria<br />
Nicaragua<br />
Peru<br />
Uganda<br />
Arab Republic <strong>of</strong> Syria<br />
Swaziland<br />
Dominican Republic<br />
Nigeria<br />
Somalia<br />
Gabon<br />
Vietnam<br />
Moldavia<br />
Iraq<br />
North Korea<br />
Central African Republic<br />
Burkina Faso<br />
Philipines<br />
Laos, RDP<br />
Liberia<br />
Zimbabwe<br />
Kirghizstan<br />
Benin<br />
Morocco<br />
Sri Lanka<br />
Indonesia<br />
Tanzania<br />
Kenya<br />
Ethiopia<br />
Senegal<br />
Lesotho<br />
Serra Leoa<br />
Cameroon<br />
Cambodia<br />
Ruanda<br />
Ivory Coast<br />
Angola<br />
Tajikistan<br />
Togo<br />
Congo<br />
Guine-Bissau<br />
Yemen<br />
India<br />
Zambia<br />
Burundi<br />
Eritreia<br />
Mozambique<br />
Pakistan<br />
Democ.Rep <strong>of</strong> Congo<br />
Palestine<br />
Malawi<br />
Haiti<br />
Afghanistan<br />
Bangladesh<br />
East-Timor
<strong>The</strong> footprint family and the environmental pressures they represent<br />
THE FOOTPRINT FAMILY AND<br />
THE ENVIRONMENTAL PRESSURES<br />
THEY REPRESENT<br />
<strong>The</strong> three indicators – <strong>Ecological</strong> <strong>Footprint</strong>, Carbon <strong>Footprint</strong> and<br />
Water <strong>Footprint</strong> – make it possible to represent various facets <strong>of</strong><br />
the consequences and impacts on natural capital stemming from<br />
human activities.<br />
Ins<strong>of</strong>ar as it reveals the bio-productive area that people<br />
demand because <strong>of</strong> their resource consumption and CO 2<br />
emissions,<br />
the <strong>Ecological</strong> <strong>Footprint</strong> can be used to obtain an idea <strong>of</strong> their<br />
impact on the biosphere. By quantifying the effect <strong>of</strong> resource<br />
use on the climate, the Carbon <strong>Footprint</strong> describes the impacts<br />
that humanity has on the atmosphere. By monitoring the real and<br />
hidden flows <strong>of</strong> water, the Water <strong>Footprint</strong> can be used to obtain<br />
information about humanity’s impacts on the Hydrosphere.<br />
<strong>The</strong> <strong>Footprint</strong> Family can best be described as a set <strong>of</strong><br />
indicators associated to consumption capable <strong>of</strong> monitoring human<br />
pressures on the planet in terms <strong>of</strong> appropriating ecological assets,<br />
greenhouse gas emissions and fresh water consumption and<br />
pollution. <strong>The</strong>y monitor three key ecosystem compartments: the<br />
biosphere, the atmosphere and the hydrosphere.<br />
<strong>The</strong> three indicators can be considered as complementary<br />
to the discussion on sustainability and as tools capable <strong>of</strong><br />
monitoring different aspects <strong>of</strong> human pressures on various<br />
compartments that provide support for life on Earth.<br />
THREE KEY<br />
ECOSYSTEM<br />
COMPARTMENTS<br />
ARE MONITORED:<br />
THE BIOSPHERE,<br />
THE ATMOSPHERE<br />
AND THE<br />
HYDROSPHERE<br />
<strong>Campo</strong> <strong>Grande</strong> <strong>Ecological</strong> <strong>Footprint</strong> 2012 p. 32
<strong>Ecological</strong> <strong>Footprint</strong> (EF)<br />
Scientific Question<br />
Considering the amount <strong>of</strong> available resources (biocapacity) on the<br />
local and global scales, and the biosphere’s capacity to regenerate<br />
them, what amount <strong>of</strong> resources can human beings consume<br />
directly or indirectly?<br />
Principal message<br />
Foster recognition <strong>of</strong> ecological limitations, safeguard the<br />
ecosystems’ pre-conditions (healthy forests, clean water, clean<br />
air, fertile soils, biological diversity, and others) and guarantee<br />
the functionality <strong>of</strong> ecosystem services thereby permitting the<br />
biosphere to provide long-term support for human life.<br />
Data and sources<br />
<strong>The</strong> <strong>Ecological</strong> <strong>Footprint</strong> makes use <strong>of</strong>:<br />
• Data on local production, imports, exports <strong>of</strong> agricultural, forestry<br />
and fishery products (FAOSTAT, UN, Comtrade, and others);<br />
• Land use and settlement data (FAOSTAT, and others);<br />
• Incorporated CO2 data (local and traded – IEA, and others);<br />
• Data on land productivity (FAOSTAT) and potential productivity<br />
<strong>of</strong> crops (FAO-GAEZ model) – all those data are needed to be able<br />
to express the results in terms <strong>of</strong> global hectares.<br />
Unit <strong>of</strong> measurement<br />
<strong>The</strong> unit <strong>of</strong> measurement for the <strong>Ecological</strong> <strong>Footprint</strong> is the global<br />
hectare (gha) <strong>of</strong> bio-productive land. Gha is not just a measure<br />
<strong>of</strong> area, but a unit <strong>of</strong> ecological production associated to an area.<br />
Results can also be expressed in simple hectares.<br />
Indicator Coverage<br />
Aspects <strong>of</strong> the <strong>Ecological</strong> <strong>Footprint</strong>:<br />
• It is a multi-dimensional indicator that is explicit for a given<br />
time that can be applied to products, cities, regions, nations and<br />
the entire biosphere. In the period 1961–2006, more than 200<br />
countries had their <strong>Ecological</strong> <strong>Footprint</strong>s calculated (cf. Ewing<br />
et al., 2009a);<br />
<strong>Campo</strong> <strong>Grande</strong> <strong>Ecological</strong> <strong>Footprint</strong> p. 33
<strong>The</strong> footprint family and the environmental pressures they represent<br />
• It documents human society’s direct and indirect demands on<br />
the capacity <strong>of</strong> sources (resource production ) and ‘wells’ (that<br />
sequester carbon);<br />
• It informs the dimensions <strong>of</strong> the demands on natural resources<br />
as well as the supply <strong>of</strong> those resources by the biosphere;<br />
• It is the only aggregating ecological benchmark;<br />
• It fosters recognition <strong>of</strong> ecological limitations, the protection <strong>of</strong><br />
ecosystems and the maintenance <strong>of</strong> their services.<br />
Usefulness in policy formulation<br />
With the use <strong>of</strong> the <strong>Ecological</strong> <strong>Footprint</strong> it is possible to:<br />
• Evaluate the planet’s limitations and identify ecosystems that<br />
are under society-induced pressure;<br />
• Monitor society’s progress towards developing minimum<br />
sustainability criteria (demand ≤ supply);<br />
• Monitor the efficiency <strong>of</strong> resource use policies in general and<br />
current levels <strong>of</strong> resource use;<br />
• Analyse the consequences <strong>of</strong> using renewable forms <strong>of</strong> energy<br />
as alternatives;<br />
• Provide the general public with information on the<br />
environmental impacts <strong>of</strong> differing life styles;<br />
• Accompany the pressures on biodiversity;<br />
• Demonstrate the unequal distribution <strong>of</strong> natural resource use<br />
and the need to implement international policies that work<br />
towards establishing an equilibrium on the use made <strong>of</strong> natural<br />
resources by the countries <strong>of</strong> the world;<br />
• Implement international policies directed at reducing natural<br />
resource consumption.<br />
Positive Aspects<br />
<strong>The</strong> <strong>Ecological</strong> <strong>Footprint</strong> makes it possible to compare human<br />
demands on nature with the <strong>of</strong>fer <strong>of</strong> natural resources and in that<br />
light establish clearly defined goals. It establishes an assessment<br />
<strong>Campo</strong> <strong>Grande</strong> <strong>Ecological</strong> <strong>Footprint</strong> 2012 p. 34
<strong>of</strong> the multiple anthropogenic pressures on renewable natural<br />
resources. It is a tool that is easy to understand and communicate<br />
and brings with it a strong conservationist message.<br />
Negative Aspects<br />
<strong>The</strong> <strong>Ecological</strong> <strong>Footprint</strong> is unable to cover all aspects <strong>of</strong><br />
sustainability or address all areas <strong>of</strong> environmental concern<br />
especially those areas where there is no regenerative capacity.<br />
It reveals the pressures that are leading to degradation <strong>of</strong><br />
natural assets (like the impoverishment <strong>of</strong> soils, the reduction <strong>of</strong><br />
biodiversity) but it is incapable <strong>of</strong> predicting future impacts.<br />
Another feature the footprint lacks is the ability to make a better<br />
definition <strong>of</strong> the impact in a specific geographic region.<br />
Water <strong>Footprint</strong><br />
Scientific Question<br />
Considering the natural capital/assets in terms <strong>of</strong> the fresh water<br />
(blue, green and grey) 9 needed for human consumption, the main<br />
question that the water footprint attempts to answer is: what volume<br />
<strong>of</strong> water does an individual, community or business need to produce<br />
or consume goods and services?<br />
Principal Message<br />
<strong>The</strong> primary aim <strong>of</strong> the Water <strong>Footprint</strong> is to demonstrate the<br />
hidden connections between human consumption and the use <strong>of</strong><br />
water and the hidden connections between global trade and water<br />
resource management. In the first situation the footprint is not<br />
limited to the water that an individual community or business<br />
consumes directly but also considers how much water is used in<br />
the production <strong>of</strong> goods and services, the water that is embedded<br />
in economic activities. To that end it defines the concept <strong>of</strong> virtual<br />
water, which is the water that is actually part <strong>of</strong> world trade,<br />
embedded in the products that are negotiated in world trade.<br />
9 Blue Water, is fresh water coming from surface or underground springs. Green water refers to<br />
rain falling directly on the soil without running <strong>of</strong>f or penetrating to replenish water tables. Grey<br />
water refers to the volume <strong>of</strong> fresh water needed to assimilate the pollutant load stemming from<br />
anthropic processes based on quality standards in effect.<br />
<strong>Campo</strong> <strong>Grande</strong> <strong>Ecological</strong> <strong>Footprint</strong> p. 35
<strong>The</strong> footprint family and the environmental pressures they represent<br />
Data and sources<br />
<strong>The</strong> Water <strong>Footprint</strong> is calculated on the basis <strong>of</strong>:<br />
• Demographic data (World Bank);<br />
• Data on the areas <strong>of</strong> arable land in the world (FAO) and on total<br />
renewable water resources and total water extraction (FAO);<br />
• Data on international agricultural trading (PC-TAS) and<br />
industrial products (WTO);<br />
• Local data on various aspects such as climate, farming<br />
patterns, irrigations, soils, the quality <strong>of</strong> percolated water,<br />
pesticide and fertilizer use indexes and others.<br />
Unit <strong>of</strong> Measurement<br />
<strong>The</strong> unit <strong>of</strong> measurement is usually a volume <strong>of</strong> water per time<br />
unit (m 3 /year for example). When production processes are being<br />
evaluated the Water <strong>Footprint</strong> may be expressed as the total volume<br />
<strong>of</strong> water used in production divided by the weight <strong>of</strong> the products<br />
produced and therefore expressed as m 3 /ton or litres/kg). It must<br />
be stressed that water footprint can also be expressed for a given<br />
area as a function <strong>of</strong> a time unit. That is usually the case with the<br />
water footprint calculations for river basins or countries.<br />
Indicator Coverage<br />
<strong>The</strong> Water <strong>Footprint</strong>:<br />
• Is a geographically explicit multi-dimensional indicator.<br />
It can be calculated for products, public organizations,<br />
economic sectors, individuals, cities and nations. In the<br />
period 1997-2001, 140 nations were analysed using this<br />
indicator (cf. Chapagain and Hoekstra, 2004);<br />
• Documents direct and indirect use <strong>of</strong> water resources as a<br />
source (demand for blue water and green water) and as a ‘well’<br />
(grey water for pollution dilution));<br />
• Only measures the demand side in terms <strong>of</strong> fresh water<br />
consumed (according to sources) and polluted (according to<br />
pollution type) by human activities;<br />
• Seeks to analyse the consumption <strong>of</strong> water resources by<br />
economic processes, production, trade and services.<br />
<strong>Campo</strong> <strong>Grande</strong> <strong>Ecological</strong> <strong>Footprint</strong> 2012 p. 36
Usefulness in policy formulation<br />
<strong>The</strong> Water <strong>Footprint</strong>:<br />
• Endows water resource management and governance with a<br />
new global dimension;<br />
• Enables nations to gain a better understanding <strong>of</strong> their<br />
dependence on water resources beyond their own frontiers;<br />
• Offers river basin management authorities more precise<br />
information on scarce water resources that are being allocated<br />
for products being exported with low financial value;<br />
• Suggests to companies ways they can monitor their dependence<br />
on scarce water resources along the length <strong>of</strong> their supply<br />
chains and in their production processes;<br />
• Demonstrates the unequal distribution <strong>of</strong> water resource use and<br />
the need to implant international policies stimulating equilibrium<br />
in water resource use among the different countries.<br />
• Promotes a discussion <strong>of</strong> the need to for international policies<br />
directed at reducing water resource consumption.<br />
Positive Aspects<br />
<strong>The</strong> Water <strong>Footprint</strong> presents a spatial distribution chart <strong>of</strong> a<br />
country’s water resource demands. It expands traditional analyses<br />
restricted to ‘water extraction’ by including the categories <strong>of</strong><br />
green and grey water. It visualises the connections between<br />
local consumption and the global appropriation <strong>of</strong> fresh water. It<br />
also integrates water use and water pollution as elements <strong>of</strong> the<br />
production chain.<br />
Negative Aspects<br />
<strong>The</strong> Water <strong>Footprint</strong> only analyses human demands for water<br />
and not the demands <strong>of</strong> the ecosystems as a whole. It depends on<br />
local data that is <strong>of</strong>ten unavailable or difficult to collect. It is liable<br />
to truncation errors in the calculations. No studies have been<br />
done regarding data uncertainties although they are known to be<br />
significant. Calculations <strong>of</strong> ‘grey’ water rely heavily on estimates<br />
and suppositions.<br />
<strong>Campo</strong> <strong>Grande</strong> <strong>Ecological</strong> <strong>Footprint</strong> p. 37
<strong>The</strong> footprint family and the environmental pressures they represent<br />
Carbon <strong>Footprint</strong><br />
Scientific Question<br />
What is the total amount <strong>of</strong> Greenhouse Gases–(CO 2<br />
, CH 4<br />
, N 2<br />
O,<br />
HFC, PFC and SF 6<br />
) emitted directly or indirectly as a result <strong>of</strong><br />
human activities or accumulated along the life cycle <strong>of</strong> products?<br />
Principal Message<br />
<strong>The</strong> Carbon <strong>Footprint</strong> 10 is mainly based on the consumption <strong>of</strong><br />
goods and services and the greenhouse gases generated by that<br />
consumption. Thus it serves as complement to the inventories made<br />
by the Kyoto Protocol that calculate the greenhouse gas balance<br />
sheets associated to production only.<br />
Data and sources<br />
<strong>The</strong> Carbon <strong>Footprint</strong> makes use <strong>of</strong>:<br />
• Economic data from national accounts (Materials–Products<br />
matrixes, Supply, utilization and others);<br />
• International trade statistics (UN, OECD, GTAP, and others);<br />
• Environmental Accounts data on GG emissions (IEA, GTAP,<br />
and others).<br />
Unit <strong>of</strong> Measurement<br />
<strong>The</strong> Carbon <strong>Footprint</strong> may measure total carbon or carbon<br />
equivalent (CO 2<br />
e 11 ) that is emitted directly or indirectly by a<br />
given human activity or accumulated during the useful life <strong>of</strong> a<br />
product. <strong>The</strong> unit used to express it is the Kg <strong>of</strong> CO 2<br />
when only<br />
carbon dioxide is being considered, or Kg <strong>of</strong> carbon equivalent<br />
when other greenhouse gases are being taken into account as<br />
well. To avoid suppositions and introducing uncertainties, there<br />
is no conversion to express it in terms <strong>of</strong> area. Often however it is<br />
expressed in units per capita.<br />
10 Carbon <strong>Footprint</strong> is used here to determine emissions associated to human production<br />
activities, which means that its significance is different from that <strong>of</strong> the GG emissions Inventory.<br />
11 11 Carbon equivalent – defines the equivalence <strong>of</strong> other gases in relation to CO2.<br />
<strong>Campo</strong> <strong>Grande</strong> <strong>Ecological</strong> <strong>Footprint</strong> 2012 p. 38
Indicator Coverage<br />
<strong>The</strong> Carbon <strong>Footprint</strong>:<br />
• Is a multi-dimensional indicator that can be applied to products,<br />
processes, companies, industries, governments, populations<br />
and so on. Up until 2001, 73 nations and 14 regions had been<br />
analysed using this calculation (cf. Hertwich e Peters, 2009);<br />
• Documents all direct and indirect GG emissions stemming<br />
from the use <strong>of</strong> resources and products (sources);<br />
• Only measures the aspect <strong>of</strong> demand in terms <strong>of</strong> Greenhouse<br />
Gases emitted;<br />
• Does not <strong>of</strong>fer any benchmarking possibilities.<br />
• Has no defined limits established.<br />
• Seeks to analyse the carbon emissions associated to economic<br />
processes, to production trade and services.<br />
THE CARBON<br />
FOOTPRINT ALLOWS<br />
FOR A CLEAR<br />
ASSESSMENT OF<br />
THE HUMAN<br />
CONTRIBUTION<br />
TO CLIMATE<br />
CHANGE<br />
• Can only measure the demand side <strong>of</strong> the emissions related to<br />
the production <strong>of</strong> a product or a service.<br />
Usefulness in policy formulation<br />
<strong>The</strong> Carbon <strong>Footprint</strong> <strong>of</strong>fers:<br />
• An alternative point <strong>of</strong> view for an international policy on<br />
climate change ins<strong>of</strong>ar as it complements the regional and<br />
territorial approach <strong>of</strong> the UNFCCC;<br />
• A better understanding <strong>of</strong> each country’s responsibility thereby<br />
facilitating international cooperation and partnerships between<br />
developed and developing countries;<br />
• A contribution towards the conception <strong>of</strong> a harmonised<br />
international price for GG emissions;<br />
• A more precise charting <strong>of</strong> the unequal distribution <strong>of</strong> natural<br />
resource use and the need to implement international policies<br />
promoting equilibrium in resource use among the different<br />
countries;<br />
• Supporting information for the discussions on the need for<br />
international policies directed at reducing natural resource<br />
consumption.<br />
<strong>Campo</strong> <strong>Grande</strong> <strong>Ecological</strong> <strong>Footprint</strong> p. 39
<strong>The</strong> footprint family and the environmental pressures they represent<br />
Positive Aspects<br />
<strong>The</strong> Carbon <strong>Footprint</strong> makes it possible to obtain a clear<br />
assessment <strong>of</strong> human contributions to climate change and it<br />
is consistent with economic and environmental accounting<br />
standards. In fact the data on which the Carbon <strong>Footprint</strong><br />
calculation is based are relatively more consistent than those <strong>of</strong><br />
the other <strong>Footprint</strong>s.<br />
Negative Aspects<br />
<strong>The</strong> Carbon <strong>Footprint</strong> is not capable <strong>of</strong> accompanying the whole<br />
range <strong>of</strong> human demands on the environment. Additional studies<br />
are essential for any analysis <strong>of</strong> the impacts <strong>of</strong> climate change in<br />
the national and sub-national scales. Efforts need to be made to<br />
construct tables similar to the MRIO (Multi-regional Input Output)<br />
tables and related environmental extensions. <strong>The</strong>re is also no limit<br />
set for the Carbon <strong>Footprint</strong>. We do have a limit in regard to global<br />
emissions but that does not mean that it has been incorporated into<br />
the Carbon <strong>Footprint</strong> calculations.<br />
Complementary quality<br />
<strong>The</strong> three indicators that form the footprint family are mutually<br />
complementary in regard to any evaluation being made <strong>of</strong> human<br />
pressures on the planet.<br />
Adopting a form <strong>of</strong> measurement based on consumption makes it<br />
feasible to evaluate direct and indirect demands that human beings<br />
are making <strong>of</strong> the natural capital and to obtain a clear understanding<br />
<strong>of</strong> the ‘invisible’ or hidden’ sources <strong>of</strong> human pressure. We need to<br />
be aware that not all dimensions <strong>of</strong> the worth and value <strong>of</strong> natural<br />
resources are captured by the indicators described above 12 .<br />
<strong>The</strong>re are values attached both to use and to non use <strong>of</strong> natural<br />
resources. Among the use values that the indicators capture it is<br />
only possible to map situations <strong>of</strong> direct use <strong>of</strong> natural resources.<br />
We cannot capture the indirect forms <strong>of</strong> use that nature <strong>of</strong>fers like<br />
ecosystem services or the values associated to the future uses <strong>of</strong><br />
natural resources.<br />
So it must be explained that it has only been possible to capture a<br />
part <strong>of</strong> the all the values constituted by natural resources – as can be<br />
seen from Figure 8 below.<br />
12 Pearce, D.W.T.K (1990): <strong>The</strong> Economics <strong>of</strong> Natural Resource and the Environment.<br />
HarvesterWheatsheaf, New York.<br />
<strong>Campo</strong> <strong>Grande</strong> <strong>Ecological</strong> <strong>Footprint</strong> 2012 p. 40
All three footprints are aimed at capturing the different forms<br />
<strong>of</strong> pressure being put on natural resources by human consumption.<br />
<strong>The</strong> consumption itself is associated to a process that transforms<br />
raw materials along complex chains <strong>of</strong> custody involving a variety <strong>of</strong><br />
agents and represented in a simplified manner in the illustration.<br />
Figure 8: <strong>The</strong> different<br />
footprints and their<br />
relation to natural<br />
resource use<br />
Natural Resource<br />
Processing<br />
Consumption<br />
by societies<br />
<strong>Ecological</strong><br />
<strong>Footprint</strong><br />
Retail<br />
Consumer<br />
Life cycle analysis<br />
Water<br />
<strong>Footprint</strong><br />
Carbon<br />
<strong>Footprint</strong><br />
Productive<br />
processes<br />
Once the biocapacity has been delineated the <strong>Ecological</strong><br />
<strong>Footprint</strong> establishes a direct link between the renewable natural<br />
resources effectively available and their consumption in the form<br />
<strong>of</strong> goods and services, without considering certain aspects more<br />
strictly associated to the production chains such as processing<br />
and distribution. <strong>The</strong>se aspects are much more related to analyses<br />
<strong>of</strong> product life cycles, which evaluates their useful lives, passing<br />
through all the stage and processes involved until the product is<br />
placed on the market, or depending on the scope <strong>of</strong> the analysis,<br />
until the disposal <strong>of</strong> its residues has been completed. In the latter<br />
case, each stage <strong>of</strong> production can be analysed separately.<br />
<strong>The</strong> Carbon <strong>Footprint</strong> and the Water <strong>Footprint</strong> are much more<br />
closely related to analyses p<strong>of</strong> product life-cycles or processes<br />
than the <strong>Ecological</strong> <strong>Footprint</strong>. That is one <strong>of</strong> the main differences<br />
between these sustainability indicators.<br />
However, only the <strong>Ecological</strong> <strong>Footprint</strong> and the Water<br />
<strong>Footprint</strong> are capable <strong>of</strong> accounts that include an evaluation <strong>of</strong><br />
the planet’s capacity as a source (resource production) and also<br />
<strong>Campo</strong> <strong>Grande</strong> <strong>Ecological</strong> <strong>Footprint</strong> p. 41
<strong>The</strong> footprint family and the environmental pressures they represent<br />
its capacity as a ‘sink’ (residue assimilation). In the case <strong>of</strong> the<br />
Carbon <strong>Footprint</strong>, all it does is to analyse the GG emissions<br />
that generate impacts on the biosphere. Of the three, the<br />
<strong>Ecological</strong> <strong>Footprint</strong> is the only indicator capable <strong>of</strong> establishing<br />
an ecological benchmark (biocapacity) demonstrating human<br />
pressure on the planet. Anthropic GG emissions are tracked as<br />
much by the <strong>Ecological</strong> <strong>Footprint</strong> as by the Carbon <strong>Footprint</strong>, but<br />
the underling intention <strong>of</strong> the <strong>Ecological</strong> <strong>Footprint</strong> in regard to<br />
carbon, is to measure the volume <strong>of</strong> ecosystem services needed to<br />
absorb those residues.<br />
Furthermore, the <strong>Ecological</strong> <strong>Footprint</strong> is based on the<br />
premise that we are making use <strong>of</strong> natural assets that are<br />
finite and that means that it is not sufficient merely to improve<br />
efficiency in resource use especially when the ricochet effect<br />
<strong>of</strong> economies is considered. 13 <strong>The</strong>re is an urgent need to think<br />
in terms <strong>of</strong> the qualitative growth <strong>of</strong> the economies and their<br />
interactions with the environment given that the extraction <strong>of</strong><br />
renewable natural resources is also influential in determining<br />
land settlement patterns.<br />
<strong>The</strong> three indicators reveal the unequal distribution <strong>of</strong> resource<br />
use among the inhabitants <strong>of</strong> the world’s different regions. Based<br />
on such data it is possible to provide support for development<br />
policies and endorse concepts such as contraction and convergence,<br />
environmental justice and fair sharing.<br />
ECOLOGICAL<br />
FOOTPRINT AND<br />
WATER FOOTPRINT<br />
PROVIDE ACCOUNTS<br />
OF THE PLANET’S<br />
CAPACITY AS A<br />
SOURCE (RESOURCE<br />
PRODUCTION)<br />
13<br />
<strong>Campo</strong> <strong>Grande</strong> <strong>Ecological</strong> <strong>Footprint</strong> 2012 p. 42
© WWF-Brasil/ Allison Ishy
THE ECOLOGICAL<br />
FOOTPRINT~<br />
Forecasts for the year 2050 suggest that if we carry<br />
on with present day patterns we will be needing<br />
more than two planets to keep up or consumption<br />
level. A global effort to revert that tendency is<br />
urgently needed so that people can go back to living<br />
within limits <strong>of</strong> the planet’s biocapacity.
© WWF-Brasil / Sérgio Amaral
<strong>The</strong> <strong>Ecological</strong> <strong>Footprint</strong><br />
<strong>The</strong> average global <strong>Ecological</strong> <strong>Footprint</strong> today is 2.7 global hectares<br />
per person but the available biocapacity is only 1.8 global hectares<br />
per person. That means the global population is running up n a<br />
serious ecological deficit. Right now humanity needs 1.5 planets<br />
to maintain its current consumption patterns and that is putting<br />
planetary biocapacity at great risk.<br />
1.6<br />
1.4<br />
1.2<br />
1.0<br />
0.8<br />
0.6<br />
0.4<br />
0.2<br />
0.0<br />
<strong>Global</strong> Living Planet Index<br />
1970 1980 1990 2000 2007<br />
Figure 9: Living<br />
Planet Index<br />
<strong>The</strong> global index<br />
shows that<br />
vertebrate species<br />
populations were<br />
reduced by almost<br />
30% between 1970<br />
and 2007<br />
(WWF/ZSL, 2010)<br />
1.6<br />
<strong>Global</strong> <strong>Ecological</strong> <strong>Footprint</strong><br />
1.4<br />
1.2<br />
<strong>Global</strong> Biocapacity<br />
1.0<br />
0.8<br />
0.6<br />
0.4<br />
0.2<br />
0.0<br />
1961 1971 1981 1991 2001 2007<br />
Figure 10: <strong>Global</strong><br />
<strong>Ecological</strong> <strong>Footprint</strong><br />
Index<br />
Human demands on<br />
the biosphere more<br />
than doubled from<br />
1961 to 2007 (<strong>Global</strong><br />
<strong>Footprint</strong> <strong>Network</strong>,<br />
2010)<br />
<strong>Campo</strong> <strong>Grande</strong> <strong>Ecological</strong> <strong>Footprint</strong> 2012 p. 46
By consuming more resources than are actually available we<br />
start to exhaust the supply <strong>of</strong> them and undermine their capacity to<br />
regenerate and continue sustaining our populations.<br />
Since the end <strong>of</strong> the 1960s humanity has been consuming over<br />
and above the possibilities <strong>of</strong> resource regeneration and that has<br />
gone on right down to the present day. Forecasts for the year 2050<br />
suggest that if we carry on with present day patterns we will be<br />
needing more than two planets to keep up our consumption level.<br />
A global effort to revert that tendency is urgently needed so that<br />
people can go back to living within limits <strong>of</strong> the planet’s biocapacity.<br />
Figure 11: Tendency<br />
Forecasts<br />
(<strong>Global</strong> <strong>Footprint</strong><br />
<strong>Network</strong>, 2010)<br />
Biodiversity<br />
Built up Area<br />
Forest Area<br />
Fisheries<br />
Pastures<br />
Bio-fuels<br />
Arable Land<br />
Carbon<br />
Key<br />
Number <strong>of</strong> Planet Earths<br />
3.5<br />
3.0<br />
2.5<br />
2.0<br />
1.5<br />
1.0<br />
0.5<br />
0<br />
1960 1970 1980 1990 2000 2010 2020 2030 2040 2050<br />
Brazil’s <strong>Ecological</strong> <strong>Footprint</strong><br />
<strong>The</strong> Brazilian <strong>Ecological</strong> <strong>Footprint</strong> is 2.9 global hectares per<br />
inhabitant, showing that the average consumption <strong>of</strong> ecological<br />
resources by a Brazilian person is close to the global <strong>Ecological</strong><br />
<strong>Footprint</strong> average per inhabitant <strong>of</strong> 2.7 global hectares.<br />
An examination <strong>of</strong> the Brazilian footprint in a temporal series<br />
shows only a small tendency to increase up until 2005 indicating<br />
a relative stability in consumer patterns over that period.<br />
<strong>Campo</strong> <strong>Grande</strong> <strong>Ecological</strong> <strong>Footprint</strong> p. 47
<strong>The</strong> <strong>Ecological</strong> <strong>Footprint</strong><br />
9.0<br />
8.0<br />
7.0<br />
6.0<br />
5.0<br />
4.0<br />
3.0<br />
2.0<br />
1.0<br />
0.0<br />
Brazil<br />
Russian<br />
Federation<br />
India China World<br />
Average<br />
Figure 12:<br />
Comparison <strong>of</strong><br />
Brazilian ecological<br />
<strong>Footprint</strong> and<br />
Biocapacity with<br />
BRIC countries<br />
(Taken from: Results<br />
from National<br />
<strong>Footprint</strong> Accounts<br />
2010 edition, GFN)<br />
Key<br />
<strong>Ecological</strong> <strong>Footprint</strong><br />
Biocapacity<br />
On the other hand, however, Brazilian biocapacity has been<br />
showing a strong decline over the years due to the impoverishment <strong>of</strong><br />
ecological services and the degradation <strong>of</strong> the ecosystems (figure 13).<br />
Hectares globais per capita<br />
2.5<br />
2.0<br />
1.5<br />
1.0<br />
0.5<br />
0.0<br />
1960 1965 1970 1975 1980 1985 1990 1995 2000 2005<br />
Figura 13: Consumption<br />
Categories x <strong>Ecological</strong><br />
Resources<br />
Key<br />
<strong>Ecological</strong> <strong>Footprint</strong><br />
Biocapacity<br />
Even so Brazil occupies an important position on the world scene<br />
as one <strong>of</strong> the planet’s greatest ecological creditors and is well situated<br />
in the context <strong>of</strong> the new green economy. To continue to occupy the<br />
position <strong>of</strong> ecological creditor, Brazil must revert this decline in its<br />
biocapacity by unfolding conservation actions and actions to make<br />
production more eco-efficient in a bid to diminish the <strong>Ecological</strong><br />
<strong>Footprint</strong> <strong>of</strong> its population by adopting more conscientious consumer<br />
habits and maintaining demographic stability.<br />
<strong>Campo</strong> <strong>Grande</strong> <strong>Ecological</strong> <strong>Footprint</strong> 2012 p. 48
© WWF-Brasil / Adriano Gambarini
CAMPO GRANDE’S<br />
ECOLOGICAL FOOTPRINT
© WWF-Brasil / Geralda Magela
<strong>Campo</strong> <strong>Grande</strong>’s <strong>Ecological</strong> <strong>Footprint</strong><br />
In order to calculate the <strong>Ecological</strong> <strong>Footprint</strong> <strong>of</strong> the population <strong>of</strong> the<br />
City <strong>of</strong> <strong>Campo</strong> <strong>Grande</strong>, the ecological resources that the population is<br />
putting pressure on must first be identified and the way they are being<br />
consumed must be verified. To that end, ecological resources were<br />
classified into six categories and the consumer patterns were also<br />
organised in six categories that embrace the various items that the<br />
population acquires.<br />
By cross-referencing the information collected on consumption<br />
with those collected on ecological resources demanded by the <strong>Campo</strong><br />
<strong>Grande</strong> populace, we obtain a matrix <strong>of</strong> consumption and land use<br />
patterns associated to the capital’s inhabitants. In turn the matrix<br />
makes it possible to identify where <strong>Campo</strong> <strong>Grande</strong>’s is putting most<br />
pressure not only in terms <strong>of</strong> the demand on resources but also<br />
identified by the specific categories <strong>of</strong> consumption it is associated to.<br />
To provide a better understanding <strong>of</strong> the allocation <strong>of</strong> resources<br />
on the one hand versus consumption on the other we will now<br />
present the different types <strong>of</strong> ecological resource considered and<br />
the categories <strong>of</strong> consumption.<br />
<strong>Ecological</strong> Resources<br />
Agriculture – this refers to the areas <strong>of</strong> arable land the population<br />
needs to produce the vegetable foods, drinks produced on the basis<br />
<strong>of</strong> agricultural products (c<strong>of</strong>fee, teas, beers, etc.) fibres <strong>of</strong> vegetable<br />
origin (cotton, flax, etc.) vegetable oils and other products stemming<br />
from agricultural activities. In the context <strong>of</strong> the <strong>Ecological</strong><br />
<strong>Footprint</strong>, agriculture is considered to be a renewable biological<br />
resource ins<strong>of</strong>ar as production depends on arable land, which<br />
although it may be finite in size, generates resources on a regular<br />
basis. <strong>The</strong> loss <strong>of</strong> arable areas through erosion, exhaustion <strong>of</strong> the<br />
soils, desertification, salinization or being paved over leads to a<br />
decline in the biocapacity <strong>of</strong> this resource (agriculture).<br />
Pastures – are areas covered by natural vegetation or cultivated<br />
but destined for feeding domestic animals to produce meat, dairy<br />
products, wool, animal fats and other products <strong>of</strong> animal origin. Just<br />
like agriculture, the pastures are finite areas for resource generation<br />
but they are also considered as a planetary biocapacity resource.<br />
Forests – in the <strong>Ecological</strong> <strong>Footprint</strong> context, they are areas<br />
covered by natural or cultivated arboreal vegetation dedicated to<br />
the production <strong>of</strong> woods and fibres for human use. <strong>The</strong> forests too<br />
<strong>Campo</strong> <strong>Grande</strong> <strong>Ecological</strong> <strong>Footprint</strong> 2012 p. 52
have finite sizes and resource generating capacities and they are<br />
considered to be one <strong>of</strong> the planet’s ecological resources.<br />
Fisheries – in terms <strong>of</strong> the <strong>Ecological</strong> <strong>Footprint</strong>, these are<br />
marine or river areas for the production <strong>of</strong> fish and other aquatic<br />
organisms for human consumption. Fish stocks in the rivers lakes<br />
and oceans are renewable but their regenerative capacity is directly<br />
affected by the intensity and volume <strong>of</strong> catches so that it is one <strong>of</strong><br />
the planet’s measurable ecological resources. Severe over fishing<br />
<strong>of</strong> fishery resources has led to a decline in the biocapacity <strong>of</strong> the<br />
fisheries as an ecological resource.<br />
Built up areas – are considered in <strong>Ecological</strong> <strong>Footprint</strong><br />
calculations as being an indirect resource. <strong>The</strong> built up areas were<br />
once biologically productive areas and so they are included in<br />
the populations <strong>Ecological</strong> <strong>Footprint</strong> account. Urbanisation and<br />
construction patterns show that built up areas are mostly situated<br />
on arable land and so they have an influence on the footprint<br />
similar to agriculture.<br />
Energy and CO 2<br />
Absorption – fossil fuels are not classified<br />
as ecological resources because there is no biological renovation <strong>of</strong><br />
them and their eventual renewal would be on a time scale where it<br />
would be irrelevant for humans. However, the residues generated<br />
by their combustion, among them CO2 ne e<br />
d to be absorbed by the<br />
ecosystems in order to keep the planet’s temperature stable. Thus<br />
the use <strong>of</strong> these fossil resources is measured indirectly by the<br />
quantities <strong>of</strong> residues that need to be processed. When we analyse<br />
the question <strong>of</strong> greenhouse gases in <strong>Ecological</strong> <strong>Footprint</strong> accounting,<br />
we calculate the areas <strong>of</strong> preserved forests needed to sequester those<br />
gases. That means that they are not measured in CO 2<br />
equivalents as<br />
is the case in climate change calculations, but instead, in the number<br />
<strong>of</strong> global hectares required to absorb them. Under the heading<br />
‘energy and CO 2<br />
absorption’ the areas that need to be inundated by<br />
hydroelectric dams to produce electricity are also considered.<br />
Consumption Categories<br />
Nutrition – food and alcoholic and non alcoholic drinks consumed<br />
in homes. Meals and drinks in restaurants and bars appear under the<br />
heading services.<br />
Housing – considers expenses related to housing, payment <strong>of</strong><br />
rent, occasional repairs, home maintenance, heating or cooling and<br />
electricity and fuel consumption associated to homes.<br />
<strong>Campo</strong> <strong>Grande</strong> <strong>Ecological</strong> <strong>Footprint</strong> p. 53
<strong>Campo</strong> <strong>Grande</strong>’s <strong>Ecological</strong> <strong>Footprint</strong><br />
Mobility – refers to the populace’s spending on transport,<br />
vehicle purchase, collective transport and fuel.<br />
Goods – consists <strong>of</strong> all the goods items for the home and items<br />
for personal use purchased by the population such as shoes and<br />
clothing, furniture and electronic equipment, leisure equipment,<br />
magazines and books, personal care items and others.<br />
Services – congregates all the population’s consumption in<br />
terms <strong>of</strong> water supply and other domestic services, health and<br />
hospital services, postal and communication services, cultural and<br />
recreational services, education, personal care and others.<br />
Government – refers to services provided by the public<br />
authorities in the federal, state and municipal spheres.<br />
Consumption Categories X <strong>Ecological</strong> Resources<br />
This report was elaborated in a different way from the classical<br />
<strong>Ecological</strong> <strong>Footprint</strong> studies where the information presented only<br />
refers to ecological resources. It was decided to present the data<br />
classified not only by ecological resources but also by consumption<br />
category which imbues this publication with additional theoretical<br />
and practical value ins<strong>of</strong>ar as it does not limit itself to an analysis <strong>of</strong><br />
the aggregated <strong>Ecological</strong> <strong>Footprint</strong> alone.<br />
Consumption Categories<br />
Government<br />
Nutrition<br />
Housing<br />
Mobility<br />
Goods<br />
Services<br />
Consumer decisions<br />
generate impacts<br />
on natural resources<br />
<strong>Ecological</strong> Resources<br />
Energy and CO 2 Absorption<br />
Agriculture<br />
Pastures<br />
Forests<br />
Fisheries<br />
Built up Area<br />
Figure 14: Consumption<br />
Categories x <strong>Ecological</strong><br />
Resources<br />
Consumer decisions<br />
generate impacts<br />
on natural resources<br />
By distinguishing the pressures that the separate consumption<br />
categories (Nutrition, Housing, Mobility, Goods, Services, and<br />
Government) put on the planet’s ecological resources (Agriculture,<br />
Pastures, Forests, Fisheries, Built up areas, Energy and CO2<br />
absorption), we provide a tool to be used in the quest for more<br />
sustainable cities. We hope that by confronting the population <strong>of</strong><br />
<strong>Campo</strong> <strong>Grande</strong> <strong>Ecological</strong> <strong>Footprint</strong> 2012 p. 54
<strong>Campo</strong> <strong>Grande</strong> with this evidence, it will, by means <strong>of</strong> its civil society<br />
organisations, class associations, government, companies and<br />
individuals, - manage to identify which activities and actions lead to<br />
degradation and consequently be more thoughtful in its consumer<br />
choices, either by reducing the volumes consumed or by preferring<br />
products and services that have lesser impacts (figure 14).<br />
In the coming chapters we will set out the <strong>Ecological</strong> <strong>Footprint</strong> <strong>of</strong><br />
the <strong>Campo</strong> <strong>Grande</strong> population in detail, identifying the consumption<br />
categories and indicating the ecological resources that are under the<br />
greatest pressure.<br />
<strong>Campo</strong> <strong>Grande</strong>’s <strong>Ecological</strong> <strong>Footprint</strong><br />
<strong>Campo</strong> <strong>Grande</strong> is the capital <strong>of</strong> one <strong>of</strong> the states that make up<br />
Brazil’s Middle-west macro-region, Mato Grosso do Sul. <strong>The</strong>re is<br />
archaeological evidence <strong>of</strong> human settlements in the region that date<br />
back to prehistoric times, but the first <strong>of</strong>ficial records <strong>of</strong> the presence<br />
<strong>of</strong> modern civilization date back to 1872 and later in 1899 with the<br />
<strong>of</strong>ficial registration <strong>of</strong> <strong>Campo</strong> <strong>Grande</strong>’s existence as a municipality.<br />
With its current population standing at 787,204 inhabitants 15 ,<br />
and its area <strong>of</strong> 8,093 Km 2 <strong>Campo</strong> <strong>Grande</strong> is home to 32% <strong>of</strong> the entire<br />
population <strong>of</strong> the state <strong>of</strong> Mato Grosso do Sul and 0.4% <strong>of</strong> the Brazilian<br />
population as a whole. Of that total population, 98.6% lives within the<br />
urban perimeter <strong>of</strong> the capital in 283,017 private households.<br />
Figure 15:<br />
Comparison <strong>of</strong><br />
ecological resources<br />
in gha<br />
3,50<br />
3,00<br />
Key<br />
2,50<br />
2,00<br />
Energy and CO 2<br />
Absorption<br />
Built up Areas<br />
Fisheries<br />
Forests<br />
Pastures<br />
Agriculture<br />
1,50<br />
1,00<br />
0,50<br />
0.0<br />
<strong>Campo</strong><br />
<strong>Grande</strong><br />
Mato Grosso<br />
do Sul<br />
Brazil<br />
World<br />
15 IBGE cidades 2010: http://www.ibge.gov.br/cidadesat/topwindow.htm?1 consulted in March, 2011<br />
<strong>Campo</strong> <strong>Grande</strong> <strong>Ecological</strong> <strong>Footprint</strong> p. 55
<strong>Campo</strong> <strong>Grande</strong>’s <strong>Ecological</strong> <strong>Footprint</strong><br />
<strong>Campo</strong> <strong>Grande</strong>’s <strong>Ecological</strong> <strong>Footprint</strong> is to the order <strong>of</strong> 3.14 global<br />
hectares, which means that the populace makes use <strong>of</strong> 2,471,821 global<br />
hectares altogether which in turn amounts to 35% <strong>of</strong> the <strong>Ecological</strong><br />
<strong>Footprint</strong> <strong>of</strong> the whole state and 0.46% <strong>of</strong> Brazil’s <strong>Ecological</strong> <strong>Footprint</strong>.<br />
<strong>Campo</strong> <strong>Grande</strong>’s <strong>Ecological</strong> <strong>Footprint</strong> is 8% bigger than the<br />
Brazilian national <strong>Ecological</strong> <strong>Footprint</strong>, 10% bigger than the state<br />
<strong>of</strong> Mato Grosso do Sul’s <strong>Footprint</strong> and 14% bigger than the global<br />
average <strong>Footprint</strong> (figure 15). <strong>The</strong> state <strong>of</strong> Mato Grosso do Sul, in<br />
turn, has an <strong>Ecological</strong> <strong>Footprint</strong> that is 3% bigger than the average<br />
footprint for Brazil as a whole.<br />
Based on that data it can be stated that if everyone in the<br />
world were to achieve the same patterns <strong>of</strong> consumption as the<br />
citizens <strong>of</strong> <strong>Campo</strong> <strong>Grande</strong> then 1.7 planets the same as planet<br />
Earth would be needed to sustain humanity as a whole. Currently,<br />
in global terms we are consuming 1.5 planet Earths to sustain the<br />
world population.<br />
When we compare the <strong>Ecological</strong> <strong>Footprint</strong> broken down into<br />
ecological resources, we can see that resource consumption in<br />
<strong>Campo</strong> <strong>Grande</strong>, albeit on a different scale, is very similar to the<br />
average Brazilian consumption in the way it is distributed among<br />
the categories and that its strongest demands are made on areas <strong>of</strong><br />
pastures, arable land and forests (figure 16).<br />
Figure 16:<br />
<strong>Ecological</strong> resources<br />
in gha/capita<br />
16%<br />
3%<br />
5%<br />
26%<br />
Key<br />
Energy and CO 2<br />
Absorption<br />
Built up Areas<br />
Fisheries<br />
Forests<br />
Pastures<br />
Agriculture<br />
18%<br />
32%<br />
In regard to CO2 absorption we can detect a lesser pressure<br />
than the global average mainly due to the low level <strong>of</strong> GG emissions<br />
associated to the Brazilian energy matrix and the intensive use <strong>of</strong><br />
bi<strong>of</strong>uels in Brazil.<br />
<strong>Campo</strong> <strong>Grande</strong> <strong>Ecological</strong> <strong>Footprint</strong> 2012 p. 56
<strong>The</strong> resources represented by agriculture (grains, vegetables<br />
and plant products), pastures (meat production, leather, wool,<br />
animal fats and other animal-based products) and (wood, paper,<br />
fibres, essences, and land use conversion) represent 75% <strong>of</strong> the<br />
<strong>Campo</strong> <strong>Grande</strong> population’s <strong>Ecological</strong> <strong>Footprint</strong>.<br />
Such intense consumption <strong>of</strong> agricultural and pastoral resources<br />
becomes even more glaringly evident if we examine <strong>Campo</strong> <strong>Grande</strong>’s<br />
<strong>Ecological</strong> <strong>Footprint</strong> broken down by consumption categories.<br />
By consumption categories, <strong>Campo</strong> <strong>Grande</strong>’s <strong>Ecological</strong> <strong>Footprint</strong><br />
differs from the Brazilian national footprint in the following aspects:<br />
nutrition (6% more), housing (53% more), services (42% more),<br />
mobility and transport (10% more), goods (13% less). (Figure 17).<br />
Figure 17: <strong>Campo</strong><br />
<strong>Grande</strong>’s ecological<br />
<strong>Footprint</strong> by<br />
consumption<br />
categories<br />
9%<br />
Nutrition<br />
Housing<br />
Mobility and<br />
Transport<br />
Goods<br />
Services<br />
Government and<br />
Infrastructure<br />
Key<br />
18%<br />
45%<br />
15%<br />
6%<br />
7%<br />
Converting <strong>Global</strong> Hectares into simple hectares<br />
Although the unit <strong>of</strong> measurement used for the <strong>Ecological</strong> <strong>Footprint</strong><br />
is the global hectare, to facilitate comparisons <strong>of</strong> the <strong>Ecological</strong><br />
<strong>Footprint</strong>s regardless <strong>of</strong> the actual productivities <strong>of</strong> their respective<br />
lands, we can re-convert global hectares back into regular hectares<br />
so that the <strong>Ecological</strong> <strong>Footprint</strong> becomes more understandable in<br />
terms <strong>of</strong> the demand for land areas.<br />
To undertake that conversion, we decided to use world average<br />
production figures to calculate <strong>Campo</strong> <strong>Grande</strong>’s <strong>Ecological</strong> <strong>Footprint</strong><br />
in global hectares, given that we had no way <strong>of</strong> knowing for certain<br />
whether all the ecological resources consumed by the population<br />
and represented by its <strong>Ecological</strong> <strong>Footprint</strong> have their origins within<br />
Brazilian territory.<br />
<strong>Campo</strong> <strong>Grande</strong> <strong>Ecological</strong> <strong>Footprint</strong> p. 57
<strong>Campo</strong> <strong>Grande</strong>’s <strong>Ecological</strong> <strong>Footprint</strong><br />
As an example, it is known that, on average, Brazilian forests are<br />
almost 170% more efficient in terms <strong>of</strong> CO2 absorption than the global<br />
average, but how can we be sure that the CO2 emitted in <strong>Campo</strong> <strong>Grande</strong><br />
is totally absorbed within Brazilian territorial limits? So we decided to<br />
convert the results obtained into world average values and not Brazilian<br />
ones. See chapter on Harmonising Bio-productive Areas – from hectares<br />
to global hectares – page 96.<br />
In the case <strong>of</strong> <strong>Campo</strong> <strong>Grande</strong> we obtain the equivalent <strong>of</strong> a map that<br />
can be interpreted as showing the area that the population <strong>of</strong> <strong>Campo</strong><br />
<strong>Grande</strong> needs to produce all the goods and services based on the use <strong>of</strong><br />
renewable natural resources that it consumes as well as the areas that<br />
would be needed to absorb all the CO2 emissions generated by the city<br />
<strong>of</strong> <strong>Campo</strong> <strong>Grande</strong> which in this case amount to 30,400 Km² (see the map<br />
below) for the city to become self-sufficient. Thus, current consumption<br />
requires an area 4 times greater than the entire area <strong>of</strong> the municipality.<br />
Obviously we have made certain suppositions but the map illustrates<br />
very well the relations between the consumption concentrated in the cities<br />
and the area that is theoretically needed to sustain that same consumption.<br />
In the following text each consumption category for the city <strong>of</strong> <strong>Campo</strong><br />
<strong>Grande</strong> will be analysed individually in regard to the ecological resources<br />
<strong>Campo</strong> <strong>Grande</strong> <strong>Ecological</strong> <strong>Footprint</strong> 2012 p. 58
that are needed to supply the respective renewable resource<br />
consumption category. If we examine this kind <strong>of</strong> data it becomes<br />
so much easier to develop mitigation strategies or derive other<br />
strategies to foster good public management.<br />
Nutrition<br />
Figure 18:<br />
Distribution <strong>of</strong> the<br />
consumption category<br />
nutrition among<br />
ecological resources<br />
(gha/cap)<br />
Energy and CO 2<br />
Absorption<br />
Built up Areas<br />
Fisheries<br />
Forests<br />
Pastures<br />
Agriculture<br />
Key<br />
We can see that 45% <strong>of</strong> <strong>Campo</strong> <strong>Grande</strong> citizens’ <strong>Ecological</strong> <strong>Footprint</strong><br />
lies in the category ‘nutrition’ and the impact <strong>of</strong> that category on<br />
ecological resources can be seen in the figure below (figure 18).<br />
0,8<br />
0,7<br />
0,6<br />
0,5<br />
0,4<br />
0,3<br />
0,2<br />
0,1<br />
0,0<br />
0,53<br />
0,65<br />
0,08<br />
Even though food consumption in <strong>Campo</strong> <strong>Grande</strong> is 5% less than<br />
the Brazilian average, its meat consumption is 13% higher. <strong>The</strong> <strong>Campo</strong><br />
<strong>Grande</strong> citizen also consumes 10% more in alcoholic and non alcoholic<br />
beverages than the average Brazilian and if the analysis is restricted<br />
to alcoholic beverages, 30% more, mainly related to the consumption<br />
<strong>of</strong> Chopps (unpasteurised beer) and beer.<br />
0,11<br />
0,01<br />
0,05<br />
Meat<br />
Almost a third <strong>of</strong> the <strong>Campo</strong> <strong>Grande</strong>’s <strong>Ecological</strong> <strong>Footprint</strong> is in<br />
the area <strong>of</strong> pastures which amount to 795,076 global hectares, the<br />
equivalent <strong>of</strong> 1,728,426 ordinary hectares, more than twice the area<br />
<strong>of</strong> the entire municipality in areas <strong>of</strong> pasture alone to supply the<br />
meat and animal product needs.<br />
On average the <strong>Campo</strong> <strong>Grande</strong> inhabitant consumes 13.5%<br />
more meat than the average Brazilian and is actually one <strong>of</strong> the<br />
worlds greatest meat consumers at a rate <strong>of</strong> almost 90 kg per<br />
person per annum, more than double the world average figure. 16<br />
In comparison, Germany has a per capita consumption <strong>of</strong> 88.2 kg<br />
16 Food and Agriculture Organization <strong>of</strong> the United Nations (FAO), FAOSTAT on-line statistical<br />
service (FAO, Rome, 2004).Available online at: http://apps.fao.org.<br />
<strong>Campo</strong> <strong>Grande</strong> <strong>Ecological</strong> <strong>Footprint</strong> p. 59
<strong>Campo</strong> <strong>Grande</strong>’s <strong>Ecological</strong> <strong>Footprint</strong><br />
(2009) 17 , and that figure includes red meat, pork, poultry and goat<br />
meat. It must be stressed that the figures refer to the consumption<br />
<strong>of</strong> various kinds <strong>of</strong> meat and not just beef.<br />
Agriculture<br />
Agriculture’s <strong>Ecological</strong> <strong>Footprint</strong> in <strong>Campo</strong> <strong>Grande</strong> is the equivalent<br />
<strong>of</strong> 638,479 global hectares, and corresponds to a little over a quarter<br />
<strong>of</strong> the population’s entire footprint. Among the most relevant elements<br />
making up the Agricultural <strong>Footprint</strong> are foodstuffs <strong>of</strong> vegetable<br />
origin answering for 67% <strong>of</strong> the total calculation for this category<br />
It is interesting to observe that the <strong>Ecological</strong> <strong>Footprint</strong><br />
associated to those foodstuffs are largely imported from other<br />
places. According to the Mato Grosso do Sul Ceasa, 82% <strong>of</strong> the<br />
foodstuffs distributed in 2008 originated from other states 18 .<br />
Programmes stimulating local organic production <strong>of</strong> foodstuffs such<br />
as greens, vegetables and fruits could reduce the CO 2<br />
emissions<br />
associated to the transportation <strong>of</strong> such items as well as improving<br />
their quality and lowering prices.<br />
Changing habits in <strong>Campo</strong> <strong>Grande</strong><br />
One hundred and thirty institutions in the government schools<br />
network already have organic beef on their school meals menus. <strong>The</strong><br />
meat comes from certified organic livestock ranches in the Pantanal<br />
associated to the Brazilian Organic Livestock Association which is<br />
part <strong>of</strong> a WWF-Brasil supported project.<br />
That novel fact is the result <strong>of</strong> a public procurement by tendering<br />
process run by the municipal government at the beginning <strong>of</strong> this<br />
year for the acquisition <strong>of</strong> food supplies for school meals. Among the<br />
selection criteria was the requirement that the products should be<br />
organic. <strong>The</strong> government consumes 11 thousand kilos <strong>of</strong> meat a month<br />
in providing school meals to 70 thousand students in government<br />
schools. This initiative is not only an example <strong>of</strong> responsible<br />
purchasing by a public authority but it is also in harmony with the<br />
directives <strong>of</strong> the National School Meals Programme (PNAE), which<br />
specifically favours products from responsible farming that employs<br />
most rural workers and is based on practices that favour nutritional<br />
diversity and protection <strong>of</strong> the environment.<br />
For further information:<br />
http://www.wwf.org.br/informacoes/sala_de_imprensa/?25480/Merendadas¬escolas-de-<strong>Campo</strong>-<strong>Grande</strong>-MS-tem-carne-orgnica<br />
17 WWF-Germany (2011): Fleischfrisst Land, Report on meat consumption and the implications<br />
on land settlement for the production <strong>of</strong> raw materials.<br />
18 Ceasa-MS http://www.ceasa.ms.gov.br/empresa.htm / consulted in February 2011<br />
<strong>Campo</strong> <strong>Grande</strong> <strong>Ecological</strong> <strong>Footprint</strong> 2012 p. 60
Housing<br />
Figure 19:<br />
Distribution <strong>of</strong> the<br />
consumption category<br />
housing among<br />
natural resources<br />
Housing (gha/capita)<br />
Key<br />
<strong>The</strong> housing sector is responsible for 7% <strong>of</strong> <strong>Campo</strong> <strong>Grande</strong>’s <strong>Ecological</strong><br />
<strong>Footprint</strong> in global hectares, which is 53% more than the national<br />
average figure. <strong>The</strong> main factors making that difference are: electricity<br />
consumption, household maintenance services and air conditioning.<br />
<strong>The</strong> housing consumption category has a strong influence on energy<br />
and CO 2<br />
absorption as the graph below clearly illustrates.<br />
0,15<br />
0,12<br />
0,14<br />
Energy and CO 2<br />
Absorption<br />
0,09<br />
Built up Areas<br />
Fisheries<br />
Forests<br />
Pastures<br />
Agriculture<br />
0,06<br />
0,05<br />
0,03<br />
0,00<br />
0,01 0,01<br />
0,00<br />
0,01<br />
Housing<br />
<strong>The</strong> principle <strong>of</strong> sustainable housing is not achieved merely by using<br />
recycled materials or materials with low environmental impacts.<br />
Sustainable buildings need to be energy-efficient and to that<br />
end they must embody engineering and architectural principles<br />
that maximize the use <strong>of</strong> natural light the free circulation <strong>of</strong> air,<br />
thermal insulation, and rationalized use <strong>of</strong> water throughout the<br />
useful life <strong>of</strong> the building.<br />
It is important to reiterate that the <strong>Ecological</strong> <strong>Footprint</strong> does<br />
not include non-renewable natural resources in its accounts. As<br />
an example, the iron used to produce the steel elements used in<br />
construction is not accounted for, considering that it is a material<br />
that cannot be regenerated on the time scale associated to human<br />
life spans. However, the charcoal that is used in the steelworks<br />
furnaces that produce the steel that goes into construction is<br />
accounted for in the category <strong>of</strong> forest-based ecological resources.<br />
<strong>Campo</strong> <strong>Grande</strong> <strong>Ecological</strong> <strong>Footprint</strong> p. 61
<strong>Campo</strong> <strong>Grande</strong>’s <strong>Ecological</strong> <strong>Footprint</strong><br />
Air conditioning<br />
Air conditioners and air coolers may have a significant impact on<br />
the environment that goes beyond the amount <strong>of</strong> electricity they<br />
consume when they are working. Conventional air conditioning<br />
units make use <strong>of</strong> refrigerating gases known as CHFs and if those<br />
gases are released into the atmosphere their effect in global<br />
warming is 11,700 times worse than that <strong>of</strong> CO 2<br />
19<br />
.<br />
Furthermore many <strong>of</strong> the older models still being sold in<br />
Brazil make use <strong>of</strong> a refrigerating gas called R-22, which not only<br />
contributes to global warming but reacts with the ozone in the<br />
atmosphere. For that reason the Montreal Protocol recommended<br />
that its use should stopped 20 .<br />
Mobility and Transport<br />
This category answers for 6% <strong>of</strong> the municipality’s <strong>Ecological</strong> <strong>Footprint</strong>.<br />
Urban mobility in <strong>Campo</strong> <strong>Grande</strong> has an impact 10% lower than the<br />
Brazilian average as can be seen in the figure below (figure 20).<br />
0,10<br />
0,08<br />
0,09<br />
Figure 20: Distribution<br />
<strong>of</strong> the category<br />
mobility among<br />
natural resources in<br />
gha/capita<br />
Key<br />
0,06<br />
Energy and CO 2<br />
Absorption<br />
0,04<br />
0,02<br />
0,02 0,02<br />
0,03<br />
0,01<br />
Built up Areas<br />
Fisheries<br />
Forests<br />
Pastures<br />
Agriculture<br />
0,00<br />
0,00<br />
While it is true that the average <strong>Campo</strong> <strong>Grande</strong> citizen spends<br />
more on private vehicle purchasing than Brazilians in general, fuel<br />
consumption and the consumption <strong>of</strong> other forms <strong>of</strong> transport are<br />
lower. More in-depth studies <strong>of</strong> mobility in <strong>Campo</strong> <strong>Grande</strong> could<br />
identify ways to maintain this good indicator but from the present<br />
study we can conclude that <strong>Campo</strong> <strong>Grande</strong>’s inhabitants travel less<br />
and spend less time in transit than those in the rest <strong>of</strong> the country.<br />
19 http://www.ipcc-nggip.iges.or.jp/public/gp/bgp/3_6_PFC_HFC_NF3_SF6_Semiconductor_<br />
Manufacturing.pdf<br />
20 http://www.protocolodemontreal.org.br/001/00101001.asp?ttCD_CHAVE=1221&btOperacao=<br />
<strong>Campo</strong> <strong>Grande</strong> <strong>Ecological</strong> <strong>Footprint</strong> 2012 p. 62
How to maintain the good level <strong>of</strong> this indicator<br />
<strong>Campo</strong> <strong>Grande</strong>’s road network enables its citizens to get around<br />
rapidly and efficiently but it also stimulates the consumer option<br />
for a private vehicle as the only means <strong>of</strong> transport. <strong>The</strong> table below<br />
shows the growth <strong>of</strong> the municipal vehicle fleet and the evolution <strong>of</strong><br />
its population over the same period.<br />
<strong>The</strong> city’s flat relief is good for cyclists and extending the network<br />
<strong>of</strong> cycle ways could be one way <strong>of</strong> encouraging the population to use<br />
that means <strong>of</strong> transport in a safe environment.<br />
0.5<br />
0.4<br />
0.3<br />
0.2<br />
0.1<br />
0.0<br />
2003 2004 2005 2006 2007 2008 2009<br />
Furthermore, increased investment in public transport to provide<br />
fast, comfortable locomotion accessible to the public at large a<br />
would be stimulus for the population to make more use <strong>of</strong> collective<br />
transport and relegate private vehicles to second place.<br />
In short, investments should be made in diversifying<br />
transportation options available to the public so that this indicator<br />
maintains the good level, impacts on the environment are reduced<br />
and better quality is aggregated to the lives <strong>of</strong> the populace. Incentives<br />
for the diversification <strong>of</strong> means <strong>of</strong> transport could contribute to<br />
maintaining the low level <strong>of</strong> impacts stemming from urban mobility.<br />
<strong>Campo</strong> <strong>Grande</strong> <strong>Ecological</strong> <strong>Footprint</strong> p. 63
<strong>Campo</strong> <strong>Grande</strong>’s <strong>Ecological</strong> <strong>Footprint</strong><br />
Goods<br />
Consumer goods represent 15% <strong>of</strong> <strong>Campo</strong> <strong>Grande</strong>’s <strong>Ecological</strong><br />
<strong>Footprint</strong> and the level <strong>of</strong> this indicator <strong>of</strong> the city’s impacts is good<br />
because it shows that consumer goods impacts 13% less than the<br />
Brazilian average.<br />
0,15<br />
0,15<br />
Figure 21:<br />
Distribution <strong>of</strong> the<br />
category goods among<br />
natural resources<br />
Goods (gha/capita)<br />
0,12<br />
0,11<br />
Key<br />
0,09<br />
0,06<br />
0,09<br />
0,07<br />
Energy and CO 2<br />
Absorption<br />
Built up Areas<br />
Fisheries<br />
Forests<br />
Pastures<br />
Agriculture<br />
0,03<br />
0,02 0,02<br />
0,00<br />
How to maintain the good level <strong>of</strong> this indicator<br />
Generally speaking the <strong>Campo</strong> <strong>Grande</strong> residents have a lower level<br />
<strong>of</strong> consumer goods consumption than the Brazilian average. <strong>The</strong><br />
same is true for the population <strong>of</strong> the state <strong>of</strong> Mato Grosso do Sul as<br />
a whole so that this indicator is currently at a good level.<br />
However like the Brazilian population at large, the people <strong>of</strong><br />
<strong>Campo</strong> <strong>Grande</strong> are currently expanding their purchasing power<br />
in relation to material goods. With the advent <strong>of</strong> easier access<br />
to credit, a noticeable increase in consumer goods consumption<br />
is in progress. Campaigns directed at consumers stimulating<br />
responsible use <strong>of</strong> credit could help to keep this indicator at a good<br />
level as well as avoiding the population’s getting embroiled in debt.<br />
<strong>The</strong> study revealed that the consumer goods items that place<br />
the greatest pressure on the environment are clothing which is<br />
responsible for 12% <strong>of</strong> the part <strong>of</strong> the footprint generated by this<br />
category, leisure and gardening equipment and pets generating<br />
17% <strong>of</strong> the this category’s footprint and most <strong>of</strong> all tobacco which<br />
contributes 27% <strong>of</strong> consumption in this category.<br />
<strong>Campo</strong> <strong>Grande</strong> <strong>Ecological</strong> <strong>Footprint</strong> 2012 p. 64
Thank you for not smoking!<br />
Tobacco has a considerable impact on the Brazilian <strong>Ecological</strong><br />
<strong>Footprint</strong> and similarly on the footprint <strong>of</strong> <strong>Campo</strong> <strong>Grande</strong>. Tobacco<br />
consumption alone is responsible for almost 4% <strong>of</strong> the municipality’s<br />
total <strong>Ecological</strong> <strong>Footprint</strong>. <strong>The</strong> information gathered in this study does<br />
not allow us to state categorically that there are fewer smokers among<br />
<strong>Campo</strong> <strong>Grande</strong> residents or that they smoke less than the rest <strong>of</strong> the<br />
Brazilian population, but we can state that they spend less on tobacco<br />
so it is reasonable to assume that those two affirmations are true.<br />
On average, Brazilians spend 3.52 Brazilian reals a month on<br />
tobacco while people in <strong>Campo</strong> <strong>Grande</strong> spend only 2.43 reals.<br />
Municipal campaigns <strong>of</strong> prevention against the smoking habit and<br />
assistance for those that want to free themselves from addiction to<br />
tobacco could bring with them added benefits by easing the pressure<br />
on the environment and improving the population’s health.<br />
It is interesting to note that the study <strong>of</strong> consumer patterns<br />
as part <strong>of</strong> the <strong>Ecological</strong> <strong>Footprint</strong> calculations makes it possible<br />
not only to identify impacts on the environment but also potential<br />
public health problems, peoples habits and routines, and other<br />
aspects that are useful for the municipality’s administration. In that<br />
sense the <strong>Ecological</strong> <strong>Footprint</strong> shows itself to be a cross-cutting tool<br />
that can contribute towards sustainable development, and assist<br />
government administration, management and planning.<br />
Services<br />
Figure 22:<br />
Distribution <strong>of</strong> the<br />
category services<br />
among natural<br />
resources<br />
Services answer for 18 % <strong>of</strong> <strong>Campo</strong> <strong>Grande</strong>’s <strong>Ecological</strong> <strong>Footprint</strong>,<br />
which is 42% higher than the national average. <strong>The</strong> following graph<br />
gives a clear idea <strong>of</strong> the pr<strong>of</strong>ile <strong>of</strong> services consumption:<br />
Services (gha/capita)<br />
Energy and CO 2<br />
Absorption<br />
Built up Areas<br />
Fisheries<br />
Forests<br />
Pastures<br />
Agriculture<br />
Key<br />
0,20<br />
0,15<br />
0,10<br />
0,05<br />
0,00<br />
0,14<br />
0,18<br />
0,12<br />
0,03 0,03<br />
0,08<br />
<strong>Campo</strong> <strong>Grande</strong> <strong>Ecological</strong> <strong>Footprint</strong> p. 65
<strong>Campo</strong> <strong>Grande</strong>’s <strong>Ecological</strong> <strong>Footprint</strong><br />
Pastures, Agriculture and Forests<br />
<strong>The</strong> ecological resources <strong>of</strong> pastures, agriculture and forests are under<br />
the greatest pressure from services and they are largely consumed<br />
under the heading Restaurants. Consumption in restaurants generates<br />
50 % <strong>of</strong> the total footprint that services are responsible for. <strong>The</strong><br />
services footprint in <strong>Campo</strong> <strong>Grande</strong> is two and a half times the size<br />
<strong>of</strong> the Brazilian average, the item recreational and cultural services<br />
contributes slightly less than the national average and the consumption<br />
<strong>of</strong> private hospital services is only half the national average.<br />
<strong>The</strong> category services seems to have an impact pattern that is a<br />
miniature version <strong>of</strong> the total footprint pattern for <strong>Campo</strong> <strong>Grande</strong><br />
and attention needs to be paid to the consumption <strong>of</strong> meat and<br />
foodstuffs <strong>of</strong> vegetable origin.<br />
Another point that needs to be highlighted is the consumption<br />
<strong>of</strong> forests by the Services category. Rational use and re-cycling <strong>of</strong><br />
paper, firewood, and charcoal contribute towards reducing the<br />
Services footprint.<br />
Government<br />
Another important category <strong>of</strong> consumption considered in the<br />
<strong>Ecological</strong> <strong>Footprint</strong> studies is government consumption <strong>of</strong><br />
ecological resources and its accounting is undertaken by examining<br />
the figures showing the taxes paid by the population. This category<br />
considers the federal, state and municipal spheres <strong>of</strong> government,<br />
and embraces its administrative services and infrastructure.<br />
Given the outreach <strong>of</strong> this category, the footprint reflects the<br />
pattern <strong>of</strong> the national footprint except that <strong>Campo</strong> <strong>Grande</strong>’s total<br />
<strong>Ecological</strong> <strong>Footprint</strong> is bigger than that <strong>of</strong> Brazil as a whole.<br />
Figure 23:<br />
Distribution <strong>of</strong> the<br />
category government<br />
among natural<br />
resources<br />
0,15<br />
0,12<br />
0,13<br />
Government (gha/capita)<br />
Key<br />
0,09<br />
Energy and CO 2<br />
Absorption<br />
0,06<br />
0,03<br />
0,03<br />
0,04<br />
0,01<br />
0,02<br />
0,06<br />
Built up Areas<br />
Fisheries<br />
Forests<br />
Pastures<br />
Agriculture<br />
0,00<br />
<strong>Campo</strong> <strong>Grande</strong> <strong>Ecological</strong> <strong>Footprint</strong> 2012 p. 66
Forests<br />
<strong>The</strong> consumer category ‘government’ was found to be an intense<br />
consumer <strong>of</strong> forest resources and 43% <strong>of</strong> its total resource demands<br />
are for resources originating from forests.<br />
It must be made clear that this study was not in a position to<br />
identify the origins <strong>of</strong> all the wood consumed in <strong>Campo</strong> <strong>Grande</strong>.<br />
<strong>The</strong> forests that the wood comes from may well be biomes <strong>of</strong> great<br />
conservation interest like the Pantanal and the Amazon.<br />
If the public authority were to establish a programme to ensure<br />
that it only purchased paper and wood with certified origins and at<br />
the same time intensified re-use and re-cycling <strong>of</strong> materials in those<br />
sectors then it would considerably reduce the negative impact it is<br />
having on forests and the size <strong>of</strong> its footprint for that category.<br />
Mobilisation and next steps<br />
Calculating the <strong>Ecological</strong> <strong>Footprint</strong> was just the first stage <strong>of</strong> a<br />
process. At the workshop held with partners in <strong>Campo</strong> <strong>Grande</strong>,<br />
projects and actions already underway in the city were inventoried.<br />
<strong>The</strong> aim was to examine the possibilities <strong>of</strong> integrating and<br />
enhancing their contribution to reducing the size <strong>of</strong> the city’s<br />
footprint. <strong>The</strong>re now follows a list <strong>of</strong> projects that could be<br />
stimulated to help in the <strong>Ecological</strong> <strong>Footprint</strong> work. All <strong>of</strong> them are<br />
now being discussed by the <strong>Campo</strong> <strong>Grande</strong>’s <strong>Ecological</strong> <strong>Footprint</strong><br />
management group and are liable to alteration.<br />
Clean streams, living city<br />
Objective:<br />
Diagnose the quality <strong>of</strong> watercourses and bodies <strong>of</strong> water in the<br />
municipality and implement measures to recuperate and preserve<br />
them.<br />
Project Start Date:<br />
On March 16, 2009 the <strong>Campo</strong> <strong>Grande</strong> city hall, in the person<br />
<strong>of</strong> the head <strong>of</strong> the Municipal Environment and Urban Planning<br />
Department started a programme entitled ‘Clean streams, living<br />
city’ to monitor the quality <strong>of</strong> surface waters in the municipality.<br />
Link to the <strong>Footprint</strong>:<br />
Classification <strong>of</strong> surface waters is highly important in the control<br />
and prevention <strong>of</strong> water resource pollution.<br />
<strong>Campo</strong> <strong>Grande</strong> <strong>Ecological</strong> <strong>Footprint</strong> p. 67
<strong>Campo</strong> <strong>Grande</strong>’s <strong>Ecological</strong> <strong>Footprint</strong><br />
Specific Objective:<br />
De-pollute all the municipalities 33 streams and one river.<br />
Description:<br />
<strong>The</strong> ‘Clean stream, living city’ programme involves: implanting<br />
a monitoring network for streams and the river within the limits<br />
<strong>of</strong> the urban perimeter <strong>of</strong> <strong>Campo</strong> <strong>Grande</strong>; an inspection and<br />
surveillance programme, and educational activities to arouse public<br />
awareness on the issue. First the areas were divided up into microbasins<br />
and each one analysed according to its own peculiarities.<br />
<strong>The</strong> monitoring points were selected and duly geo-referenced.<br />
<strong>The</strong> selection <strong>of</strong> those points took into account the presence <strong>of</strong><br />
installations that were liable to produce effluents draining into<br />
the streams and others were points <strong>of</strong> convergence <strong>of</strong> streams and<br />
springs. Samples are taken at those points every three months and<br />
subjected to laboratory analysis. This monitoring is a permanent<br />
activity with no scheduled end date. <strong>The</strong> results are reproduced<br />
succinctly and displayed on placards placed near to the monitoring<br />
points. <strong>The</strong> unabridged results are published on the municipality’s<br />
internet site (www.capital.ms.gov.br/meioambiente).<br />
Urban Tree Planting Master Plan – PDAU<br />
Objective:<br />
Diagnose the needs and establish directives for tree planting<br />
in <strong>Campo</strong> <strong>Grande</strong>, defining technical criteria to be applied in<br />
expanding and managing the areas with trees.<br />
Project start date:<br />
March 2009<br />
Link to the <strong>Footprint</strong>:<br />
Greater GG absorption.<br />
Specific Objective:<br />
Plant 250 thousand trees in Areas <strong>of</strong> Permanent Protection, along<br />
avenues in institutional areas and public access areas by 2012.<br />
Description:<br />
<strong>The</strong> Urban Tree Planting Master Plan has diagnosed the situation<br />
in regard to trees lining roads and avenues in the city and that<br />
has enabled the <strong>Campo</strong> <strong>Grande</strong> Municipal Authority to draw up<br />
guidelines for the administration and management <strong>of</strong> the urban<br />
tree planting process. Qualitative and quantitative information<br />
was gathered on existing trees in the streets and avenues<br />
and with the support <strong>of</strong> the legal framework in the municipal<br />
legislation it intends to carry out and manage the municipal<br />
<strong>Campo</strong> <strong>Grande</strong> <strong>Ecological</strong> <strong>Footprint</strong> 2012 p. 68
tree planting process <strong>The</strong> Urban Tree Planting Programme is<br />
the operational form <strong>of</strong> the Master Plan and it has seven lines <strong>of</strong><br />
action: 1-Protecting urban water courses and springs; 2-planting<br />
trees in open spaces; 3- Planting trees down the middle <strong>of</strong> wide<br />
avenues, 4-Planting Trees in the City’s parks; 5-Planting Trees in<br />
instructional areas; 6- Providing Environmental Education; 7-<br />
Protecting existing trees.<br />
On September 21, 2010, the Environment and Urban Planning<br />
Department inaugurated its nursery garden with a production<br />
capacity <strong>of</strong> one million tree seedlings a year and in that same<br />
year it launched its Via Verde (Green Way) Project with a Specific<br />
Objective <strong>of</strong> 10 thousand trees planted in public parks by the end<br />
<strong>of</strong> 2011.<br />
Municipal Solid Waste Policy<br />
Objective:<br />
Promote the integrated administration and management <strong>of</strong> solid<br />
waste including hazardous waste, defining responsibilities <strong>of</strong> those<br />
that generate it and <strong>of</strong> the government authorities.<br />
Project start date:<br />
<strong>The</strong> first actions <strong>of</strong> a pilot project <strong>of</strong> selective waste collection began<br />
in 2006 in collaboration with companies, supermarkets, re-cycling<br />
entities like the waste pickers cooperative, the institution <strong>of</strong> the<br />
Municipal Committee for monitoring the Recycling Programme for<br />
selectively collected waste.<br />
In 2010, two eco-points for selective collection were implanted<br />
and selective collection was introduced in municipal schools.<br />
In 2011 the process was begun <strong>of</strong> elaborating directives <strong>of</strong> the<br />
Municipal Solid Waste Policy.<br />
Link to the <strong>Footprint</strong>:<br />
reduction <strong>of</strong> areas used to dump solid waste, improved quality <strong>of</strong><br />
life for residents.<br />
Specific Objectives:<br />
• By 2012: three more eco-points implanted; 30 voluntary<br />
delivery points implanted; selective collection implanted in 30<br />
schools;<br />
• By 2013: door to door selective collection implanted in 60% <strong>of</strong><br />
the municipal area.<br />
<strong>Campo</strong> <strong>Grande</strong> <strong>Ecological</strong> <strong>Footprint</strong> p. 69
<strong>Campo</strong> <strong>Grande</strong>’s <strong>Ecological</strong> <strong>Footprint</strong><br />
Description:<br />
Constructed in a participative manner, the selective collection <strong>of</strong><br />
household waste in the city <strong>of</strong> <strong>Campo</strong> <strong>Grande</strong> is based on the preselection<br />
<strong>of</strong> recyclable materials done by residents and the reception<br />
<strong>of</strong> those materials by companies that work with re-cycling and<br />
commercialisation <strong>of</strong> recyclable materials.<br />
<strong>The</strong> Programme for the Collection and Re-cycling <strong>of</strong> used vegetable<br />
oils was implanted to give a final destination for oils used and discarded<br />
by companies in the food business, homes, condominiums and public<br />
and private institutions. In <strong>Campo</strong> <strong>Grande</strong> there are two collection<br />
point, one in the Municipal Market and the other in the Central Market.<br />
<strong>The</strong> eco-points are collecting places where people can voluntarily<br />
leave their waste. <strong>The</strong>y have simple infrastructure limited to receiving<br />
compressing storing and trading recyclable materials. <strong>The</strong>re are two<br />
such points in the city, one in Bálsamo and the other in São Conrado.<br />
<strong>The</strong> voluntary delivery places are public or private institutions<br />
that receive small volumes <strong>of</strong> dry recyclables and participate<br />
voluntarily in the Selective Waste Collection Programme. Among<br />
them are schools, companies and associations.<br />
Living Springs Programme<br />
Objective:<br />
Execute services in collaboration with residents in rural areas with a<br />
view to protecting watercourses in the basin <strong>of</strong> the Guariroba River,<br />
which is the main source <strong>of</strong> <strong>Campo</strong> <strong>Grande</strong>’s water supply.<br />
Project start date:<br />
Janeiro/2010<br />
Link to the <strong>Footprint</strong>:<br />
Increase the useful life <strong>of</strong> the main source <strong>of</strong> <strong>Campo</strong> <strong>Grande</strong>’s Water<br />
Supply System.<br />
Specific Objectives:<br />
Implement terracing and contour curves to contain erosion<br />
processes in the Guariroba Area <strong>of</strong> Environmental Protection;<br />
• Fencing <strong>of</strong>f and replanting <strong>of</strong> Areas <strong>of</strong> Permanent Protection<br />
within the Guariroba Area <strong>of</strong> Environmental Protection;<br />
• Recuperation <strong>of</strong> roads inside the Guariroba Area <strong>of</strong><br />
Environmental Protection;<br />
• Guaranteeing the quality <strong>of</strong> water supplied to approximately<br />
350 thousand people.<br />
<strong>Campo</strong> <strong>Grande</strong> <strong>Ecological</strong> <strong>Footprint</strong> 2012 p. 70
Description:<br />
Implantation <strong>of</strong> the Water Producer Programme<br />
<strong>Ecological</strong> Tax<br />
Objective:<br />
Foster measures for the protection preservation and recuperation <strong>of</strong><br />
the environment by <strong>of</strong>fering fiscal benefits to tax payers.<br />
Link to the <strong>Footprint</strong>:<br />
Rational use <strong>of</strong> natural resources (constructions using sustainable<br />
materials, recycling construction industry residues; capture and reuse<br />
<strong>of</strong> rain waters; re-use <strong>of</strong> residual waters in buildings originating<br />
from the buildings themselves after suitable treatment; use <strong>of</strong><br />
sustainable energy for water heating and solar electrical heating.<br />
Specific Objectives:<br />
Reduction <strong>of</strong> energy consumption through the use <strong>of</strong> solar energy for<br />
heating water reduction <strong>of</strong> water consumption through the collection<br />
and re-use <strong>of</strong> rainwater; re-use <strong>of</strong> residual waters after suitable<br />
treatment for activities that do not require potable water; Use <strong>of</strong><br />
materials that attenuate environmental impacts (sustainable materials).<br />
Description:<br />
<strong>The</strong> ecological tax proposes the concession <strong>of</strong> a reduction in the<br />
annual urban housing tax and the tax on services <strong>of</strong> any kind<br />
favouring those individuals or legally constituted entities that<br />
own residential or commercial buildings and adopt measures to<br />
protect, preserve or recuperate the environment. To demonstrate<br />
the positive effects <strong>of</strong> the ecological tax proposal (rational use<br />
<strong>of</strong> natural resources, re-use <strong>of</strong> water, collection and re-use <strong>of</strong><br />
rainwater; Use <strong>of</strong> sustainable material and use <strong>of</strong> renewable<br />
energy) two pilot projects were implanted: ‘Sustainable Home’<br />
aimed at showing the possibilities <strong>of</strong> using various sustainable<br />
techniques and products in construction work and ‘Reágua’ (Rewater)<br />
aimed at promoting the capture and re-use <strong>of</strong> rainwater,<br />
which should be stored for use at a later date in activities that do<br />
not require the use <strong>of</strong> potable water supplied by the public water<br />
supply system , such as: discharge water for toilets, irrigation for<br />
lawns and ornamental plants, washing vehicles and paved areas,<br />
decorative ponds and for industrial purposes.<br />
<strong>The</strong> Reágua and Sustainable Homes projects are still only at<br />
the pilot project stage and will become consolidated and effective<br />
<strong>Campo</strong> <strong>Grande</strong> <strong>Ecological</strong> <strong>Footprint</strong> p. 71
<strong>Campo</strong> <strong>Grande</strong>’s <strong>Ecological</strong> <strong>Footprint</strong><br />
through the <strong>Ecological</strong> Tax policy. <strong>The</strong> programme was <strong>of</strong>ficially<br />
instituted by Complementary Law n o 150, dated January 20, 2010.<br />
It is currently being regulated and there is no end date set for it.<br />
Integrated Management <strong>of</strong> Construction Residues Plan<br />
Objective:<br />
Regulate and manage all the waste materials stemming from<br />
building activities in the municipality.<br />
Project start date:<br />
Diagnosis was in 2009 and the Law was published in July 2010<br />
Link to the <strong>Footprint</strong>:<br />
Reduction in the quantities <strong>of</strong> residues and availability <strong>of</strong> areas<br />
formerly used to deposit them.<br />
Specific Objectives (com data):<br />
By 2012, implant ten points for the reception <strong>of</strong> small volumes<br />
<strong>of</strong> construction residues with a view to receiving at least 70%<br />
<strong>of</strong> the small volumes <strong>of</strong> residues that are currently disposed <strong>of</strong><br />
irregularly;<br />
Implementation <strong>of</strong> residue management plans on large-scale<br />
construction ventures and works;<br />
By 2012, implantation <strong>of</strong> at least two areas <strong>of</strong> Trans-shipment<br />
and Screening for the reception <strong>of</strong> large volumes <strong>of</strong> residues;<br />
By 2012, implantation <strong>of</strong> a recycling plant for construction residues.<br />
Description:<br />
<strong>The</strong> Integrated Management Plan defined responsibilities attributed<br />
to large scale producers <strong>of</strong> residues and instituted the Municipal<br />
Construction Residues Management Programme to handle the<br />
destiny <strong>of</strong> small volumes <strong>of</strong> such residues. It also regulates issues<br />
affecting transporters <strong>of</strong> the material.<br />
Environmental Education Centre<br />
Objective:<br />
Promote and provide support for the environmental education<br />
process in <strong>Campo</strong> <strong>Grande</strong>; unfold educational actions addressing<br />
environmental education;<br />
Ensure that the Centre is used as a space for the discussion <strong>of</strong><br />
environmental education and putting it into practice;<br />
Discuss and stimulate transforming actions and the<br />
construction <strong>of</strong> new values.<br />
<strong>Campo</strong> <strong>Grande</strong> <strong>Ecological</strong> <strong>Footprint</strong> 2012 p. 72
Project start date:<br />
April/2011<br />
Link to the <strong>Footprint</strong>:<br />
Constructs new environmental values.<br />
Specific Objectives:<br />
• Promote workshops, lectures, training for multiplying agents<br />
and other educational activities;<br />
• Visitation by at least one school per week according to a the<br />
school year calendar and receive at least 3,000 students by the<br />
year 2012;<br />
• Hold at least 4 workshops per month for multipliers.<br />
Description:<br />
<strong>The</strong> Environmental Education Centres will do the following:<br />
qualify children in primary and lower and higher secondary<br />
education by providing field classes, showing films, giving<br />
lectures, running workshop and play learning activities;<br />
qualify community environmental educators for each <strong>of</strong><br />
the municipality’s micro-regions (presidents <strong>of</strong> residents<br />
associations, members <strong>of</strong> the school community, members <strong>of</strong><br />
religious communities etc.) involving at least four live sessions<br />
and at least one group per month will be qualified; provide<br />
capacity building for teachers in municipal schools preparing<br />
them in turn to provide environmental education in their classes;<br />
train Autonomous Transportation providers (with carts and<br />
wheelbarrows) and qualify them for removing and correctly<br />
disposing <strong>of</strong> small volumes <strong>of</strong> building work residues, qualifying<br />
at least one group every month; provide capacity building for<br />
small local organizations enabling them to elaborate unfold and<br />
monitor environmental education projects holding at least four<br />
workshops a year for that purpose.<br />
<strong>The</strong> Centre will also be the site <strong>of</strong> the following projects: Mini<br />
Municipal Nursery Garden for the team that will be carrying out<br />
the landscaping and maintenance <strong>of</strong> the central flower beds in the<br />
avenues; the first Sustainable Home, open for visitation and built<br />
using the sustainable building techniques and building materials<br />
that are notably sustainable in a model building project.<br />
<strong>Campo</strong> <strong>Grande</strong> <strong>Ecological</strong> <strong>Footprint</strong> p. 73
CONCLUSIONS~<br />
<strong>The</strong> calculation <strong>of</strong> <strong>Campo</strong> <strong>Grande</strong>’s <strong>Ecological</strong><br />
<strong>Footprint</strong> is an important urban management<br />
tool that shows the ways to achieve a more<br />
sustainable city and provide its citizens with a<br />
better quality <strong>of</strong> life. <strong>The</strong> footstep calculation,<br />
however, is just the first step and it needs to be<br />
followed by a discussion with all the local actors<br />
and the subsequent development <strong>of</strong> mitigation<br />
strategies. Mobilisation around the <strong>Ecological</strong><br />
<strong>Footprint</strong> is currently being implanted in <strong>Campo</strong><br />
<strong>Grande</strong> and many local entities and institutions<br />
with activities in the city are taking an active<br />
part (public sector, companies, NGOs, schools<br />
and universities) but there is still a need for<br />
more intense engagement on the part <strong>of</strong> the<br />
public sector in the endeavour to mould the<br />
city’s future. That participation however will be<br />
built up time as time goes by.
© Adriano Gambarini / WWF-Brasil
Conclusions<br />
<strong>The</strong> <strong>Ecological</strong> <strong>Footprint</strong> is a cross-cutting tool, an important<br />
instrument to support urban planning policy ins<strong>of</strong>ar is it provides<br />
elements that help the public authorities to re-think and plan the<br />
future <strong>of</strong> the city that <strong>Campo</strong> <strong>Grande</strong>’s people want to live in. It also<br />
serves as a parameter for examining production chains <strong>of</strong> all that the<br />
population consumes in the categories <strong>of</strong> food, goods and services.<br />
<strong>The</strong>re is a whole series <strong>of</strong> issues that can be addressed using<br />
this tool such as evaluating how natural resources are being used in<br />
agriculture and livestock production to meet the needs <strong>of</strong> the <strong>Campo</strong><br />
<strong>Grande</strong> residents. In regard to transportation, it helps the analysis<br />
<strong>of</strong> emissions stemming from the city’s vehicle fleet and stimulates<br />
greater use <strong>of</strong> collective transport.<br />
By studying the consumption patterns revealed by the <strong>Ecological</strong><br />
<strong>Footprint</strong> calculation, it is possible to identify natural resource use by<br />
the population, potential health problems, habits and routines and other<br />
aspects <strong>of</strong> great relevance for municipal management. In that sense<br />
the <strong>Ecological</strong> <strong>Footprint</strong> is not only an incisive tool but also contributes<br />
towards sustainable development and provides important support for<br />
urban planning and administration.<br />
It enables the city hall to make more sustainable purchasing<br />
choices when acquiring products for the various areas <strong>of</strong> public<br />
service. A good example <strong>of</strong> that is the purchase <strong>of</strong> organic beef for<br />
school meals, which has just been implanted by the <strong>Campo</strong> <strong>Grande</strong><br />
Education Department. In addition to environmental aspects, the<br />
tool can also help in health planning by evaluating, for example, the<br />
population’s alcohol consumption and the way it is reflected in the<br />
health <strong>of</strong> the <strong>Campo</strong> <strong>Grande</strong> population.<br />
It must be stressed that the aim <strong>of</strong> the footprint calculation is not to<br />
paint a negative portrait <strong>of</strong> the city. <strong>The</strong> idea is to <strong>of</strong>fer the city a tool for<br />
better public administration, mobilise the general public in regard to its<br />
consumer habits and encourage it to choose more sustainable products,<br />
while at the same time opening up a dialogue with businessmen to<br />
encourage them to improve their production chains. Also there can be<br />
no doubt that any reduction in the consumption <strong>of</strong> natural resources can<br />
only be achieved slowly over the long term.<br />
<strong>The</strong> <strong>Ecological</strong> <strong>Footprint</strong> <strong>of</strong>fers decision makers the possibility <strong>of</strong><br />
addressing questions related to the structure and functioning <strong>of</strong> local<br />
and national economies and it is an important tool in the discussions<br />
on sustainable production and consumption, energy and climate. It not<br />
only serves the public administrator well but it is also useful to private<br />
company administrators enabling them to become more aware <strong>of</strong> the<br />
<strong>Campo</strong> <strong>Grande</strong> <strong>Ecological</strong> <strong>Footprint</strong> 2012 p. 76
impacts caused by their production chains and useful to ordinary<br />
citizens that wish to press for improvements in the quality <strong>of</strong> life in<br />
their city.<br />
Figure 24: <strong>Ecological</strong><br />
<strong>Footprint</strong> <strong>of</strong> several<br />
cities that have made<br />
the calculation<br />
10<br />
8<br />
6<br />
Key<br />
4<br />
<strong>Footprint</strong> (gha)<br />
<strong>Global</strong> Limit<br />
2<br />
0<br />
Quito (2006)<br />
<strong>Campo</strong> <strong>Grande</strong> (2010)<br />
Curitiba (2006)<br />
Hong Kong (2010)<br />
Cascais (2009)<br />
Nova York (2009)<br />
São Francisco (2011)<br />
Ontario (2005)<br />
Calgary (2005)<br />
As we can see from the chart (figure 24) other cities have<br />
undertaken the <strong>Ecological</strong> <strong>Footprint</strong> calculation and are now<br />
developing long-term mitigation plans designed to reduce their<br />
consumption <strong>of</strong> renewable natural resources. Now it will be up<br />
to the administrators <strong>of</strong> those cities to point the way in which the<br />
development <strong>of</strong> their municipalities needs to head.<br />
Does <strong>Campo</strong> <strong>Grande</strong> want to draw closer to the those cities<br />
with even larger footprints, or would it prefer to maintain a<br />
smaller footprint and seek ways to achieve forms <strong>of</strong> development<br />
with lower environmental costs? It would definitely not be<br />
desirable to get closer to the situations <strong>of</strong> cities like Calgary or<br />
San Franciso and much better to make the effort to keep the<br />
footprint small. <strong>The</strong>re is still a good chance for <strong>Campo</strong> <strong>Grande</strong><br />
to get its footprint down to the size that all cities need to try<br />
for in the long term namely: 1. 8 gha – the global limit for our<br />
<strong>Ecological</strong> <strong>Footprint</strong>.<br />
<strong>The</strong> <strong>Ecological</strong> <strong>Footprint</strong> basically points to the problems, it<br />
does not come up with immediate solutions for them.<br />
We are well aware that there still some points that need to be<br />
improved so that we can make the calculations even more accurate.<br />
<strong>Campo</strong> <strong>Grande</strong> <strong>Ecological</strong> <strong>Footprint</strong> p. 77
Conclusions<br />
<strong>The</strong> data sources can definitely be improved and the main<br />
constants introduced into the calculations need to be gradually<br />
revised 21 .<br />
Even so, we cannot expect this environmental indicator<br />
to solve all the problems that need to be solved to bring about<br />
the transformation and changes towards becoming a more<br />
sustainable society. <strong>The</strong> <strong>Ecological</strong> <strong>Footprint</strong> is an excellent<br />
tool in helping us to change the perspective in which we view<br />
development and stimulating us to find solutions that will tailor<br />
our economic and social growth to be appropriate to the Earth’s<br />
capacity to support them.<br />
What we hope is that this <strong>Ecological</strong> <strong>Footprint</strong> study will<br />
inspire consistent long term planning that goes beyond the<br />
bounds <strong>of</strong> public administration and that it will be maintained<br />
and continued regardless <strong>of</strong> which government is in power.<br />
We are fully aware too that this is not the kind <strong>of</strong> work that<br />
can be done from one day to another. It is essentially long-term<br />
work and there are many stages to be gone through. Nevertheless,<br />
it must be begun immediately and to that end it is important<br />
to verify what the numbers that are set out in this x-ray reveal,<br />
analyse the most critical points and implement an action plan in<br />
harmony and agreement with all the partners, so that when the<br />
next measurement <strong>of</strong> <strong>Campo</strong> <strong>Grande</strong>’s impacts is made, they will<br />
have diminished and the city will have become more sustainable,<br />
<strong>of</strong>fering a better quality <strong>of</strong> life to its inhabitants.<br />
21 Kitzes, J.,Galli, A., Bagliani, M., Barrett, J., Dige, G., Ede, S., Erb, K-H., Giljum, S., Haberl, H.,<br />
Hails, C., Jungwirth, S., Lenzen, M., Lewis, K., Loh, J., Marchettini, N., Messinger, H., Milne, K.,<br />
Moles, R., Monfreda, C., Moran, D., Nakano, K., Pyhälä, A., Rees, W., Simmons, C., Wackernagel,<br />
M., Wada, Y., Walsh, C., Wiedmann, T. (2009). A research agenda for improving national ecological<br />
footprint accounts. <strong>Ecological</strong> Economics 68(7), 1991-2007.<br />
<strong>Campo</strong> <strong>Grande</strong> <strong>Ecological</strong> <strong>Footprint</strong> 2012 p. 78
© WWF-Brasil / Allison Ishy
Conclusions<br />
BIBLIOGRAPHIC REFERENCES<br />
AND RECOMMENDED READING<br />
DG Environment. Potential <strong>of</strong> the <strong>Ecological</strong> <strong>Footprint</strong> for monitoring<br />
environmental impact from natural resource use. http://ec.europa.eu/<br />
environment/natres/studies.htm.<br />
Ewing B., A. Reed, S.M. Rizk, A. Galli, M. Wackernagel, and J. Kitzes. 2008.<br />
Calculation Methodology for the national <strong>Footprint</strong> Accounts, 2008 Edition.<br />
Oakland: <strong>Global</strong> <strong>Footprint</strong> <strong>Network</strong>, www.footprintnetwork.org/atlas.<br />
Ewing B., D. Moore, S. Goldfinger, A. Oursler, A. Reed, M. Wackernagel.<br />
2010. <strong>The</strong> <strong>Ecological</strong> <strong>Footprint</strong>. Atlas 2010. Oakland: <strong>Global</strong> <strong>Footprint</strong><br />
<strong>Network</strong>. www.footprintnetwork.org/atlas.<br />
FAO 2000a. Forest Resource Assessment 2000. Rome, Food and<br />
Agriculture Organization (accessed February 2010).<br />
FAO. 2000b. Technical Conversion Factors for Agricultural Commodities.<br />
http://www.fao.org/es/ess/tcf.asp. (accessed February 2010).<br />
FAO and International Institute for Applied Systems Analysis <strong>Global</strong><br />
Agro-<strong>Ecological</strong> Zones. 2000. http://www.fao.org/ag/agl/agll/gaez/index.<br />
htm (accessed February 2010).<br />
FAO. 1998. <strong>Global</strong> Fiber Supply Model. ftp://ftp.fao.org/docrep/fao/006/<br />
X0105E/X0105E.pdf (accessed February 2010).<br />
Food and Agriculture Organization <strong>of</strong> the United Nations (FAO)<br />
Statistical Databases. http://faostat.fao.org/site/291/default.aspx<br />
(accessed February 2010).<br />
Galli, A., J. Kitzes, P. Wermer, M. Wackernagel, V. Niccolucci& E. Tiezzi,<br />
2007. An Exploration <strong>of</strong> the Mathematics behind the <strong>Ecological</strong> <strong>Footprint</strong>.<br />
International Journal <strong>of</strong> Ecodynamics. 2(4), 250-257.<br />
<strong>Global</strong> <strong>Footprint</strong> <strong>Network</strong> 2010. National <strong>Footprint</strong> Accounts, 2010<br />
Edition. Available at www.footprintnetwork.org.<br />
<strong>Campo</strong> <strong>Grande</strong> <strong>Ecological</strong> <strong>Footprint</strong> 2012 p. 80
Gulland, J.A. 1971. <strong>The</strong> Fish Resources <strong>of</strong> the Ocean. West Byfleet, Surrey,<br />
United Kingdom: Fishing News.<br />
Haberl, H., K.H. Erb, F. Krausmann, V. Gaube, A. Bondeau, C. Plutzar, S.<br />
Gingrich, W. Lucht and M. and Fischer-Kowalski. 2007. Quantifying and<br />
mapping the human appropriation <strong>of</strong> net primary production in earth’s<br />
terrestrial ecosystems. Proc. Natl. Acad. Sci. 104: 12942-12947.<br />
Hammond, G.P. and C.I. Jones. 2008. ‘Embodied energy and carbon in<br />
construction materials’, Proc. Instn Civil. Engrs: Energy, in press.<br />
Hertwich e Peters. Carbon <strong>Footprint</strong> <strong>of</strong> Nations: A <strong>Global</strong>, Trade-Linked Analysis,<br />
Environ. Sci. Technol., 2009, 43 (16), pp 6414–6420<br />
Hoekstra, A. Y., Chapagain, A. K., Aldaya, M. M. and Mekonnen, M.<br />
M. (2009a) Water <strong>Footprint</strong> Manual: State <strong>of</strong> the Art 2009, Water<br />
<strong>Footprint</strong> <strong>Network</strong>, Enschede, the Netherlands, www.waterfootprint.org/<br />
downloads/Water<strong>Footprint</strong>Manual2009.pdf<br />
IBGE (2010): Atlas Nacional do Brasil Milton Santo, IBGE Rio de Janeiro,<br />
Rio de Janeiro.<br />
IEA Statistics and Balances. http://data.iea.org/ieastore/statslisting.asp<br />
(accessed February 2010).<br />
Interfacultaire Vakgroep Energie en Milieukunde Energy Analysis<br />
Program, Research Report no. 98, Groningen, 1999.<br />
Intergovernmental Panel on Climate Change. 2006. 2006 IPCC Guidelines<br />
for National Greenhouse Gas Inventories Volume 4: Agriculture Forestry<br />
and Other Land Use. http://www.ipccnggip.iges.or.jp/public/2006gl/vol4.<br />
html (accessed February 2010).<br />
IPCC 2007. Climate Change 2007. <strong>The</strong> Physical Science Basis. Contribution <strong>of</strong><br />
Working Group I to the Fourth Assessment Report <strong>of</strong> the Intergovernmental<br />
Panel on Climate Change. [Solomon, S., D. Qin, M. Manning, Z. Chen, M.<br />
Marquis, K.B. Averyt, M. Tignor and H.L. Miller (eds.)]. CambridgeUniversity<br />
Press, Cambridge, United Kingdom and New York, NY, USA.<br />
Kitzes, J., A. Galli, A. Reed, S. Rizk, B. Ewing, and M. Wackernagel. 2010.<br />
Guidebook to the National<strong>Footprint</strong> Accounts: 2010 Edition. Oakland:<br />
<strong>Global</strong> <strong>Footprint</strong> <strong>Network</strong>.www.footprintnetwork.org/methodology.<br />
<strong>Campo</strong> <strong>Grande</strong> <strong>Ecological</strong> <strong>Footprint</strong> p. 81
Conclusions<br />
Kitzes, J.,Galli, A., Bagliani, M., Barrett, J., Dige, G., Ede, S., Erb,<br />
K-H., Giljum, S., Haberl, H., Hails, C., Jungwirth, S., Lenzen, M.,<br />
Lewis, K., Loh, J., Marchettini, N., Messinger, H., Milne, K., Moles,<br />
R., Monfreda, C., Moran, D., Nakano, K., Pyhälä, A., Rees, W.,<br />
Simmons, C., Wackernagel, M., Wada, Y., Walsh, C., Wiedmann,<br />
T., 2009. A research agenda for improving national ecological<br />
footprint accounts. <strong>Ecological</strong> Economics 68(7), 1991-2007.<br />
Kitzes, J., A. Peller, S. Goldfinger, and M. Wackernagel. 2007. Current<br />
Methods for Calculating National <strong>Ecological</strong> <strong>Footprint</strong> Accounts.<br />
Science for Environment & Sustainable Society (ResearchCenter for<br />
Sustainability and Environment, ShigaUniversity), 4(1) 1-9.<br />
Meadows, Donella, J. Randers and D. Meadows. Limits to Growth.<br />
New York: Universe Books, 1972<br />
Monfreda, C., Wackernagel, M., Deumling, D., 2004. Establishing<br />
national natural capital accounts based on detailed ecological<br />
footprint and biocapacity assessments. Land Use Policy 21, 231–246.<br />
Pauly, D. and V. Christensen. 1995. Primary production required to<br />
sustain global fisheries. Nature 374, 255-257.<br />
Rees, W.E., 1992. <strong>Ecological</strong> footprints and appropriated carrying<br />
capacity: What urban economics leaves out. Environment and<br />
Urbanization, 4, 121-130.<br />
Stiglitz, J.E., Sen, A. and Fitoussi, J-P. 2009. Report by the Commission<br />
on the Measurement <strong>of</strong> Economic Performance and Social Progress.<br />
http://www.stiglitz-sen-fitoussi.fr/documents/rapport_anglais.pdf.<br />
Thormark, C. 2002. “A low energy building in a life cycle—its<br />
embodied energy, energy need for operation and recycling<br />
potential”, Building and Environment 37, pg. 429 – 435.<br />
UN Commodity Trade Statistics Database. 2010. http://comtrade.<br />
un.org (accessed February 2010).<br />
UN European Commission, International Monetary Fund,<br />
Organization for Economic Co-operation and Development and<br />
World Bank. 2003. Handbook <strong>of</strong> National Accounting – Integrated<br />
Environmental and Economic Accounting 2003.<br />
<strong>Campo</strong> <strong>Grande</strong> <strong>Ecological</strong> <strong>Footprint</strong> 2012 p. 82
UNEP (United Nations Environment Programme), 2007. GEO4<br />
<strong>Global</strong> Environment Outlook: environment for development.<br />
Progress Press Ltd, Malta.<br />
Venetoulis, J., Talberth, J., 2008. Refining the ecological footprint.<br />
Environment, Development and Sustainability 10(4), 441-469.<br />
Wackernagel, M., L. Onisto, A. C. Linares, I. S. L. Falfán, J. M.<br />
García, A. I. S. Guerrero, Ma. G. S. Guerrero. 1997. <strong>Ecological</strong><br />
<strong>Footprint</strong>s <strong>of</strong> Nations: How Much Nature Do <strong>The</strong>y Use? How Much<br />
Nature Do <strong>The</strong>y Have? Commissioned by the Earth Council for the<br />
Rio+5 Forum. Distributed by the International Council for Local<br />
Environmental Initiatives, Toronto.<br />
Wackernagel, M., L. Onisto, P. Bello, Al. C. Linares, I. S. L. Falfán,<br />
J. M. García, A. I. S. Guerrero, Ma. G. S. Guerrero. 1999a. National<br />
natural capital accounting with the ecological footprint concept,<br />
<strong>Ecological</strong> Economics. 29, 375-390.<br />
Wackernagel, M., Lewan, L. and Hansson, C.B., 1999b. Evaluating the<br />
use <strong>of</strong> natural capital with theecological footprint. Ambio 28, 604–612.<br />
Wackernagel, M., B. Schulz, D. Deumling, A. Callejas Linares, M.<br />
Jenkins, V. Kapos, C. Monfreda, J. Loh, N. Myers, R. Norgaard and<br />
J. Randers. 2002. Tracking the ecological overshoot <strong>of</strong> the human<br />
economy, Proc. Natl. Acad. Sci. 99(14), 9266-9271.<br />
Wackernagel, M. and Rees, W.E. 1996. Our <strong>Ecological</strong> <strong>Footprint</strong>:<br />
Reducing Human Impact on the Earth. New Society Publishers,<br />
Gabriola Island, BC. - 18 -- 19 –<br />
Wackernagel, M., C. Monfreda, D. Moran, P. Wermer, S. Goldfinger,<br />
D. Deumling, and M. Murray. 2005. National <strong>Footprint</strong> and<br />
Biocapacity Accounts 2005: <strong>The</strong> underlying calculation method.<br />
Oakland: <strong>Global</strong> <strong>Footprint</strong> <strong>Network</strong>. www.footprintnetwork.org.<br />
WCED. 1987. Our Common Future. World Commission on<br />
Environment and Development , Oxford.<br />
Wiedmann, T. and Barrett, J. 2010. A Review <strong>of</strong> the <strong>Ecological</strong> <strong>Footprint</strong><br />
Indicator - Perceptions and Methods. Sustainability, 2, 1645-169<br />
<strong>Campo</strong> <strong>Grande</strong> <strong>Ecological</strong> <strong>Footprint</strong> p. 83
ATTACHMENTS~
© WWF-Brasil / Adriano Gambarini
Attachments<br />
ECOLOGICAL FOOTPRINT:<br />
FREQUENTLY ASKED QUESTIONS<br />
How is the <strong>Ecological</strong> <strong>Footprint</strong> calculated?<br />
<strong>The</strong> <strong>Ecological</strong> <strong>Footprint</strong> measures the amount <strong>of</strong> biologically<br />
productive land and water area required to produce the resources an<br />
individual, population or activity consumes and to absorb the waste<br />
it generates, given prevailing technology and resource management.<br />
This area is expressed in global hectares (hectares with worldaverage<br />
biological productivity). <strong>Footprint</strong> calculations use yield<br />
factors to normalize countries’ biological productivity to world<br />
averages (e.g. comparing tonnes <strong>of</strong> wheat per UK hectare versus per<br />
world average hectare) and equivalence factors to take into account<br />
differences in world average productivity among land types (e.g.<br />
world average forest versus world average cropland).<br />
<strong>Footprint</strong> and biocapacity results for countries are calculated<br />
annually by <strong>Global</strong> <strong>Footprint</strong> <strong>Network</strong>. Collaborations with national<br />
governments are invited, and serve to improve the data and<br />
methodology used for the National <strong>Footprint</strong> Accounts. To date,<br />
Switzerland has completed a review, and Belgium, Ecuador, Finland,<br />
Germany, Ireland, Japan and the UAE have partially reviewed or are<br />
reviewing their accounts. <strong>The</strong> continuing methodological development<br />
<strong>of</strong> the National <strong>Footprint</strong> Accounts is overseen by a formal review<br />
committee. A detailed methods paper and copies <strong>of</strong> sample calculation<br />
sheets can be obtained from www.footprintnetwork.org<br />
<strong>Footprint</strong> analyses can be conducted on any scale. <strong>The</strong>re is<br />
growing recognition <strong>of</strong> the need to standardize sub-national<br />
<strong>Footprint</strong> applications in order to increase comparability across<br />
studies and longitudinally. Methods and approaches for calculating<br />
the <strong>Footprint</strong> <strong>of</strong> municipalities, organizations and products are<br />
currently being aligned through a global <strong>Ecological</strong> <strong>Footprint</strong><br />
standards initiative. For more information on <strong>Ecological</strong> <strong>Footprint</strong><br />
standards see www.footprintstandards.org<br />
What is included in the <strong>Ecological</strong> <strong>Footprint</strong>? What is<br />
excluded?<br />
To avoid exaggerating human demand on nature, the <strong>Ecological</strong><br />
<strong>Footprint</strong> includes only those aspects <strong>of</strong> resource consumption and<br />
<strong>Campo</strong> <strong>Grande</strong> <strong>Ecological</strong> <strong>Footprint</strong> 2012 p. 86
Appendixwaste production for which the Earth has regenerative<br />
capacity, and where data exist that allow this demand to be<br />
expressed in terms <strong>of</strong> productive area. For example, toxic releases<br />
are not accounted for in <strong>Ecological</strong> <strong>Footprint</strong> accounts. Nor are<br />
freshwater withdrawals, although the energy used to pump or treat<br />
water is included.<br />
<strong>Ecological</strong> <strong>Footprint</strong> accounts provide snapshots <strong>of</strong> past<br />
resource demand and availability. <strong>The</strong>y do not predict the<br />
future. Thus, while the <strong>Footprint</strong> does not estimate future losses<br />
caused by current degradation <strong>of</strong> ecosystems, if this degradation<br />
persists it may be refected in future accounts as a reduction in<br />
biocapacity.<br />
<strong>Footprint</strong> accounts also do not indicate the intensity with which<br />
a biologically productive area is being used. Being a biophysical<br />
measure, it also does not evaluate the essential social and economic<br />
dimensions <strong>of</strong> sustainability.<br />
How is international trade taken into account?<br />
<strong>The</strong> National <strong>Footprint</strong> Accounts calculate the <strong>Ecological</strong> <strong>Footprint</strong><br />
associated with each country’s total consumption by summing<br />
the <strong>Footprint</strong> <strong>of</strong> its imports and its production, and subtracting<br />
the <strong>Footprint</strong> <strong>of</strong> its exports. This means that the resource use and<br />
emissions associated with producing a car that is manufactured in<br />
Japan but sold and used in India will contribute to India’s rather<br />
than Japan’s consumption <strong>Footprint</strong>.<br />
National consumption footprints can be distorted when the<br />
resources used and waste generated in making products for export<br />
are not fully documented for every country. Inaccuracies in reported<br />
trade can signifcantly affect the <strong>Footprint</strong> estimates for countries<br />
where trade fows are large relative to total consumption. However,<br />
this does not affect the total global <strong>Footprint</strong>.<br />
How does the <strong>Ecological</strong> <strong>Footprint</strong> account for the use <strong>of</strong><br />
fossil fuels?<br />
Fossil fuels such as coal, oil and natural gas are extracted from<br />
the Earth’s crust and are not renewable in ecological time spans.<br />
When these fuels burn, carbon dioxide (CO 2<br />
) is emitted into the<br />
atmosphere. <strong>The</strong>re are two ways in which this CO 2<br />
can be stored:<br />
human technological sequestration <strong>of</strong> these emissions, such as<br />
deep-well injection, or natural sequestration. Natural sequestration<br />
occurs when ecosystems absorb CO 2<br />
and store it either in standing<br />
biomass such as trees or in soil.<br />
<strong>Campo</strong> <strong>Grande</strong> <strong>Ecological</strong> <strong>Footprint</strong> 2012 p. 87
Attachments<br />
<strong>The</strong> carbon footprint is calculated by estimating how much<br />
natural sequestration would be necessary to maintain a constant<br />
concentration <strong>of</strong> CO 2<br />
in the atmosphere. After subtracting the<br />
amount <strong>of</strong> CO 2<br />
absorbed by the oceans, <strong>Ecological</strong> <strong>Footprint</strong><br />
accounts calculate the area required to absorb and retain the<br />
remaining carbon based on the average sequestration rate <strong>of</strong> the<br />
world’s forests. CO 2<br />
sequestered by artifcial means would also be<br />
subtracted from the <strong>Ecological</strong> <strong>Footprint</strong> total, but at present this<br />
quantity is negligible. In 2007, one global hectare could absorb the<br />
CO 2<br />
released by burning approximately 1,450 litres <strong>of</strong> gasoline.<br />
Expressing CO 2<br />
emissions in terms <strong>of</strong> an equivalent<br />
bioproductive area does not imply that carbon sequestration in<br />
biomass is the key to resolving global climate change. On the<br />
contrary, it shows that the biosphere has insuffcient capacity<br />
to <strong>of</strong>fset current rates <strong>of</strong> anthropogenic CO 2<br />
emissions. <strong>The</strong><br />
contribution <strong>of</strong> CO 2<br />
emissions to the total <strong>Ecological</strong> <strong>Footprint</strong><br />
is based on an estimate <strong>of</strong> world average forest yields. This<br />
sequestration capacity may change over time. As forests mature,<br />
their CO 2<br />
sequestration rates tend to decline. If these forests are<br />
degraded or cleared, they may become net emitters <strong>of</strong> CO 2<br />
.<br />
Carbon emissions from some sources other than fossil fuel<br />
combustion are incorporated in the National <strong>Footprint</strong> Accounts at the<br />
global level. <strong>The</strong>se include fugitive emissions from the faring <strong>of</strong> gas in<br />
oil and natural gas production, carbon released by chemical reactions<br />
in cement production and emissions from tropical forest fres.<br />
Does the <strong>Ecological</strong> <strong>Footprint</strong> take into account other<br />
species?<br />
<strong>The</strong> <strong>Ecological</strong> <strong>Footprint</strong> compares human demand on nature with<br />
nature’s capacity to meet this demand. It thus serves as an indicator<br />
<strong>of</strong> human pressure on local and global ecosystems. In 2007,<br />
humanity’s demand exceeded the biosphere’s regeneration rate by<br />
more than 50 per cent. This overshoot may result in depletion <strong>of</strong><br />
ecosystems and fll-up <strong>of</strong> waste sinks. This ecosystem stress may<br />
negatively impact biodiversity. However, the <strong>Footprint</strong> does not<br />
measure this latter impact directly, nor does it specify how much<br />
overshoot must be reduced by if negative impacts are to be avoided.<br />
<strong>Campo</strong> <strong>Grande</strong> <strong>Ecological</strong> <strong>Footprint</strong> 2012 p. 88
Does the <strong>Ecological</strong> <strong>Footprint</strong> say what is a “fair” or<br />
“equitable” use <strong>of</strong> resources?<br />
<strong>The</strong> <strong>Footprint</strong> documents what has happened in the past. It<br />
can quantitatively describe the ecological resources used by an<br />
individual or a population, but it does not prescribe what they<br />
should be using. Resource allocation is a policy issue, based on<br />
societal beliefs about what is or is not equitable. While <strong>Footprint</strong><br />
accounting can determine the average biocapacity that is available<br />
per person, it does not stipulate how this biocapacity should be<br />
allocated among individuals or countries. However, it does provide<br />
a context for such discussions.<br />
How relevant is the <strong>Ecological</strong> <strong>Footprint</strong> if the supply<br />
<strong>of</strong> renewable resources can be increased and advances<br />
in technology can slow the depletion <strong>of</strong> non-renewable<br />
resources?<br />
<strong>The</strong> <strong>Ecological</strong> <strong>Footprint</strong> measures the current state <strong>of</strong> resource<br />
use and waste generation. It asks: in a given year, did human<br />
demands on ecosystems exceed the ability <strong>of</strong> ecosystems to meet<br />
these demands? <strong>Footprint</strong> analysis refects both increases in the<br />
productivity <strong>of</strong> renewable resources and technological innovation<br />
(for example, if the paper industry doubles the overall effciency<br />
<strong>of</strong> paper production, the <strong>Footprint</strong> per tonne <strong>of</strong> paper will halve).<br />
<strong>Ecological</strong> <strong>Footprint</strong> accounts capture these changes once they<br />
occur and can determine the extent to which these innovations<br />
have succeeded in bringing human demand within the capacity <strong>of</strong><br />
the planet’s ecosystems. If there is a suffcient increase in ecological<br />
supply and a reduction in human demand due to technological<br />
advances or other factors, <strong>Footprint</strong> accounts will show this as the<br />
elimination <strong>of</strong> global overshoot.<br />
For additional information about current <strong>Ecological</strong> <strong>Footprint</strong><br />
methodology, data sources, assumptions and results, please<br />
visit:www.footprintnetwork.org/atlas<br />
For more information on the <strong>Ecological</strong> <strong>Footprint</strong> at a global level, please see: Butchart, S.H.M.<br />
et al., 2010; GFN, 2010b; GTZ, 2010; Kitzes, J.,2008; Wackernagel, M. et al., 2008; at a regional<br />
and national level please see: Ewing, B. et al., 2009; GFN, 2008; WWF, 2007; 2008c; for further<br />
information on the methodology used to calculate the <strong>Ecological</strong> <strong>Footprint</strong>, please see: Ewing B. et<br />
al., 2009; Galli, A. et al., 2007.<br />
<strong>Campo</strong> <strong>Grande</strong> <strong>Ecological</strong> <strong>Footprint</strong> 2012 p. 89
Attachments<br />
GLOSSARY<br />
Biocapacity<br />
Biocapacity per person<br />
Biodiversity<br />
Biome<br />
Carbon <strong>Footprint</strong><br />
Carbon uptake land<br />
<strong>The</strong> capacity <strong>of</strong> ecosystems to produce useful biological materials<br />
and to absorb waste materials generated by humans, using<br />
current management schemes and extraction technologies.<br />
Biocapacity is measured in global hectares (GFN 2012).<br />
This is calculated by dividing the number <strong>of</strong> productive global<br />
hectares available by the number <strong>of</strong> people living on the planet in<br />
that year.<br />
Shorthand for biological diversity. Variability among living<br />
organisms from all sources including terrestrial, marine and other<br />
aquatic ecosystems, and the ecological complexes <strong>of</strong> which they<br />
are part; this includes diversity within species, between species<br />
and <strong>of</strong> ecosystems (CBD and UNEP)<br />
A major portion <strong>of</strong> the living environment <strong>of</strong> a particular region<br />
characterized by its distinctive vegetation and maintained by local<br />
climatic conditions<br />
When used in <strong>Ecological</strong> <strong>Footprint</strong> studies, this term is<br />
synonymous with demand on carbon uptake land. NOTE: <strong>The</strong><br />
phrase “Carbon <strong>Footprint</strong>” or “carbon footprint” has been picked<br />
up in the climate change debate. <strong>The</strong>re are several calculators that<br />
use the phrase “Carbon <strong>Footprint</strong>”, but many Just calculate tonnes<br />
<strong>of</strong> carbon, or tonnes <strong>of</strong> carbon per euro, rather than demand on<br />
bioproductive area.<br />
<strong>The</strong> demand on biocapacity required to sequester (through<br />
photosynthesis) the carbon dioxide (CO 2<br />
) emissions from fossil<br />
fuel combustion. Although fossil fuels are extracted from the<br />
Earth’s crust and are not regenerated in human time scales, their<br />
use demands ecological services if the resultant CO 2<br />
is not to<br />
accumulate in the atmosphere. <strong>The</strong> <strong>Ecological</strong> <strong>Footprint</strong> therefore<br />
includes the biocapacity, typically that <strong>of</strong> unharvested forests,<br />
needed to absorb that fraction <strong>of</strong> fossil CO 2<br />
that is not absorbed by<br />
the ocean (GFN 2012).<br />
<strong>Ecological</strong> <strong>Footprint</strong><br />
A measure <strong>of</strong> how much biologically productive land and water<br />
an individual, population or activity requires to produce all the<br />
resources it consumes and to absorb the waste it generates using<br />
prevailing technology and resource management practices. <strong>The</strong><br />
<strong>Ecological</strong> <strong>Footprint</strong> is usually measured in global hectares.<br />
Because trade is global, an individual or country’s <strong>Footprint</strong><br />
includes land or sea from all over the world. <strong>Ecological</strong> <strong>Footprint</strong><br />
is <strong>of</strong>ten referred to in short form as <strong>Footprint</strong> and is calculated for<br />
a given year. (GFN 2012).<br />
<strong>Campo</strong> <strong>Grande</strong> <strong>Ecological</strong> <strong>Footprint</strong> 2012 p. 90
Ecosystem<br />
Ecosystem services<br />
Provisioning services<br />
Regulating services<br />
Supporting services<br />
Cultural services<br />
<strong>Global</strong> hectare (gha)<br />
Human Development<br />
A dynamic complex <strong>of</strong> plant, animal and micro-organism<br />
communities and their non-living environment interacting as a<br />
functional unit.<br />
<strong>The</strong> Millennium Ecosystem Assessment distinguished supporting,<br />
provisioning, regulating and cultural services that contribute to<br />
human wellbeing (Millennium Ecosystem Assessment, 2005a, b).<br />
<strong>The</strong>se services are defined as:<br />
Goods obtained directly from ecosystems (e.g. food, medicine,<br />
timber, fibre, bi<strong>of</strong>uel)<br />
Benefits obtained from the regulation <strong>of</strong> natural processes (e.g.<br />
water filtration, waste decomposition, climate regulation, crop<br />
pollination, regulation <strong>of</strong> some human diseases)<br />
Regulation <strong>of</strong> basic ecological functions and processes that are<br />
necessary for the provision <strong>of</strong> all other ecosystem services (e.g.<br />
nutrient cycling, photosynthesis and soil formation).<br />
Psychological and emotional benefits gained from human<br />
relations with ecosystems (e.g. enriching recreational, aesthetic<br />
and spiritual experiences).<br />
A productivity weighted area used to report both the<br />
biocapacity <strong>of</strong> the earth, and the demand on biocapacity (the<br />
<strong>Ecological</strong> <strong>Footprint</strong>). <strong>The</strong> global hectare is normalized to the<br />
area-weighted average productivity <strong>of</strong> biologically productive<br />
land and water in a given year. Because different land types<br />
have different productivity, a global hectare <strong>of</strong>, for example,<br />
cropland, would occupy a smaller physical area than the much<br />
less biologically productive pasture land, as more pasture<br />
would be needed to provide the same biocapacity as one<br />
hectare <strong>of</strong> cropland. Because world bioproductivity varies<br />
slightly from year to year, the value <strong>of</strong> a gha may change<br />
slightly from year to year (GFN 2012).<br />
Human development is a process <strong>of</strong> enlarging people’s choices.<br />
Enlarging people’s choices is achieved by expanding human<br />
capabilities and functioning. At all levels <strong>of</strong> development the<br />
three essential capabilities for human development are for<br />
people to lead long and healthy lives, to be knowledgeable and<br />
to have a decent standard <strong>of</strong> living. If these basic capabilities<br />
are not achieved, many choices are simply not available and<br />
many opportunities remain inaccessible. But the realm <strong>of</strong><br />
human development goes further: essential areas <strong>of</strong> choice,<br />
highly valued by people, range from political, economic and<br />
social opportunities for being creative and productive to<br />
enjoying self-respect, empowerment and a sense <strong>of</strong> belonging<br />
to a community. <strong>The</strong> concept <strong>of</strong> human development is a<br />
holistic one putting people at the centre <strong>of</strong> all aspects <strong>of</strong><br />
the development process. It has <strong>of</strong>ten been misconstrued<br />
and confused with the following concepts and approaches<br />
to development This definition is taken from the Human<br />
Development Report webpage and the latest report can be<br />
found here.<br />
<strong>Campo</strong> <strong>Grande</strong> <strong>Ecological</strong> <strong>Footprint</strong> 2012 p. 91
Attachments<br />
Human Development Index (HDI)<br />
<strong>The</strong> HDI – human development index – is a summary composite<br />
index that measures a country’s average achievements in three<br />
basic aspects <strong>of</strong> human development: health, knowledge, and a<br />
decent standard <strong>of</strong> living. <strong>The</strong> HDI contains three components:<br />
1) Health: life expectancy at birth (<strong>The</strong> number <strong>of</strong> years a newborn infant<br />
would live if prevailing patterns <strong>of</strong> mortality at the time <strong>of</strong> birth were to stay<br />
the same throughout the child’s life).<br />
2) Knowledge: a combination <strong>of</strong> the adult literacy rate and the combined<br />
primary, secondary, and tertiary gross enrolment ratio;<br />
3) Standard <strong>of</strong> living: GDP per capita (PPP US$).<br />
This definition is taken from the Human Development Report<br />
webpage and the latest report can be found here.<br />
Inequality adjusted Human<br />
Development Index (IHDI)<br />
National Accounts Committee<br />
National <strong>Footprint</strong> Accounts<br />
Natural capital<br />
<strong>The</strong> IHDI is a measure <strong>of</strong> the level <strong>of</strong> human development <strong>of</strong><br />
people in a society that accounts for inequality. Under perfect<br />
equality the IHDI is equal to the HDI, but falls below the HDI<br />
when inequality rises. In this sense, the IHDI is the actual level<br />
<strong>of</strong> human development (taking into account inequality), while<br />
the HDI can be viewed as an index <strong>of</strong> the potential human<br />
development that could be achieved if there is no inequality.<br />
<strong>The</strong> IHDI accounts for inequality in HDI dimensions by<br />
“discounting” each dimension’s average value according to<br />
its level <strong>of</strong> inequality. <strong>The</strong> average loss in the HDI due to<br />
inequality is about 23 percent—that is, adjusted for inequality,<br />
the global HDI <strong>of</strong> 0.682 in 2011 would fall to 0.525. Countries<br />
with less human development tend to have greater inequality<br />
in more dimensions—and thus larger losses in human<br />
development. This new version <strong>of</strong> the HDI was developed or<br />
the 2011 Human Development report (UNDP, 2011) and at the<br />
time <strong>of</strong> publication, the adjustment has been applied to 134<br />
countries. For this definition and more information see the<br />
IHDI homepage.<br />
<strong>Global</strong> <strong>Footprint</strong> <strong>Network</strong>’s <strong>of</strong> scientific advisors who develop<br />
and endorse recommendations for methodological changes to the<br />
<strong>Ecological</strong> <strong>Footprint</strong> accounts (GFN 2012).<br />
<strong>The</strong> central data set that calculates the <strong>Footprint</strong>s and<br />
biocapacities <strong>of</strong> the world and roughly 150 nations from 1961<br />
to the present (generally with a three year lag due to data<br />
availability). <strong>The</strong> ongoing development, maintenance and<br />
upgrades <strong>of</strong> the National <strong>Footprint</strong> Accounts are coordinated by<br />
<strong>Global</strong> <strong>Footprint</strong> <strong>Network</strong> and its 70 plus partners (GFN 2012).<br />
Natural capital can be defined as all <strong>of</strong> the raw materials and<br />
natural cycles on Earth. <strong>Footprint</strong> analysis considers one key<br />
component, life supporting natural capital, or ecological capital<br />
for short. This capital is defined as the stock <strong>of</strong> living ecological<br />
assets that yield goods and services on a continuous basis. Main<br />
functions include resource production (such as fish, timber or<br />
cereals), waste assimilation (such as CO2 absorption or sewage<br />
decomposition) and life support services (such as UV protection,<br />
biodiversity, water cleansing or climate stability).<br />
<strong>Campo</strong> <strong>Grande</strong> <strong>Ecological</strong> <strong>Footprint</strong> 2012 p. 92
Overshoot<br />
Sustainable development<br />
Virtual water<br />
Water <strong>Footprint</strong><br />
<strong>Global</strong> overshoot occurs when humanity’s demand on nature<br />
exceeds the biosphere’s supply, or regenerative capacity. Such<br />
overshoot leads to a depletion <strong>of</strong> Earth’s life supporting natural<br />
capital and a build up <strong>of</strong> waste. At the global level, ecological<br />
deficit and overshoot are the same, since there is no net-import<br />
<strong>of</strong> resources to the planet. Local overshoot occurs when a local<br />
ecosystem is exploited more rapidly than it can renew itself<br />
(GFN 2012).<br />
Development that meets the needs <strong>of</strong> the present without<br />
compromising the ability <strong>of</strong> future generations to meet their<br />
own needs.<br />
<strong>The</strong> ‘virtual water content’ <strong>of</strong> a product is the same as its ‘water<br />
footprint’ .he water footprint <strong>of</strong> a product (a commodity, good or<br />
service) is the volume <strong>of</strong> freshwater used to produce the product,<br />
measured at the place where the product was actually produced.<br />
It refers to the sum <strong>of</strong> the water use in the various steps <strong>of</strong> the<br />
production chain.<br />
<strong>The</strong> water footprint <strong>of</strong> an individual, community or business is<br />
defined as the total volume <strong>of</strong> freshwater that is used to produce<br />
the goods and services consumed by the individual or community<br />
or produced by the business. <strong>The</strong> Water footprint <strong>of</strong> a nation is<br />
defined as the total amount <strong>of</strong> water that is used to produce the<br />
goods and services consumed by the inhabitants <strong>of</strong> the nation.<br />
<strong>Campo</strong> <strong>Grande</strong> <strong>Ecological</strong> <strong>Footprint</strong> 2012 p. 93
Attachments<br />
ATTACHMENT A: METHODOLOGY –<br />
ECOLOGICAL FOOTPRINT AND BIOCAPACITY<br />
This section has been taken from the 2010 edition <strong>of</strong> the Calculation<br />
Methodology for the National <strong>Footprint</strong> Accounts, 2010 Edition 22 .<br />
<strong>Footprint</strong> and Biocapacity Calculations<br />
<strong>The</strong> <strong>Ecological</strong> <strong>Footprint</strong> measures appropriated biocapacity and<br />
biocapacity represents the availability <strong>of</strong> bio-productive areas.<br />
For any type <strong>of</strong> land use the <strong>Ecological</strong> <strong>Footprint</strong> <strong>of</strong> a country,<br />
expressed in global hectares is given by:<br />
EF<br />
<br />
P<br />
Y<br />
N<br />
<br />
YF<br />
<br />
EQF<br />
Equation 1a<br />
Where P is the amount <strong>of</strong> a product harvested or Carbon<br />
Dioxide emitted, YN é is the national average yield for P and YF and<br />
EQF are the yield factor and the equivalence factor respectively for<br />
the land use type in question.<br />
A country’s biocapacity (BC) for any land use type, is calculated<br />
as follows:<br />
BC<br />
= A YF EQF<br />
Equation 2<br />
Where A is the area available for a given land use type.<br />
Derived Products<br />
Summing the footprints <strong>of</strong> all the primary products and the<br />
ecosystems capacity to absorb residues we obtain the total footprint<br />
<strong>of</strong> a country’s national production. In some cases however it is<br />
necessary to know the <strong>Ecological</strong> <strong>Footprint</strong>s <strong>of</strong> products derived<br />
from the flows <strong>of</strong> primary goods from the ecosystems. Primary and<br />
derived goods are related by product specific extraction rates.<br />
22 Ewing B., A. Reed, A. Galli, J. Kitzes, and M. Wackernagel. 2010. Calculation Methodology<br />
for the National <strong>Footprint</strong> Accounts, 2010 Edition. Oakland: <strong>Global</strong> <strong>Footprint</strong> <strong>Network</strong>. Available<br />
at http://www.footprintnetwork.org/images/uploads/National_<strong>Footprint</strong>_Accounts_Method_<br />
Paper_2010.pdf<br />
<strong>Campo</strong> <strong>Grande</strong> <strong>Ecological</strong> <strong>Footprint</strong> 2012 p. 94
<strong>The</strong> extraction rate <strong>of</strong> a derived product EXTR D<br />
, é is used to<br />
calculate its effective yield in the following way:<br />
DPD<br />
Y = Y EXTR<br />
Equation 3a<br />
Where Y D<br />
and Y P<br />
are the yields for the primary product and the<br />
effective yields for the derived product respectively.<br />
Normally, EXTR D<br />
is simply the mass ratio <strong>of</strong> derived product<br />
to primary input required. This ratio is known as the technical<br />
conversion factor for the derived product and is denoted by TCF D<br />
below. <strong>The</strong>re are a few cases where multiple products are derived<br />
simultaneously from the same primary product. Soybean oil and<br />
soybean cake are both extracted simultaneously from the same<br />
primary product, in this case soybean. Summing the primary<br />
product equivalent <strong>of</strong> the derived products would lead to double<br />
counting so the primary product footprint must be shared between<br />
the simultaneously derived goods. <strong>The</strong> general formula for the<br />
extraction rate for a derived good (D) is:<br />
TCF<br />
D<br />
EXTR <br />
D<br />
FAF<br />
Equation 3b<br />
D<br />
Where FAF D<br />
is the <strong>Footprint</strong> allocation factor. This allocates<br />
the <strong>Footprint</strong> <strong>of</strong> the primary product between the simultaneously<br />
derived goods according to the TCF-weighted prices. <strong>The</strong> prices <strong>of</strong><br />
derived goods represent their relative contributions to the incentive<br />
for the harvest <strong>of</strong> the primary product. <strong>The</strong> equation for the<br />
<strong>Footprint</strong> allocation factor <strong>of</strong> a derived product is:<br />
FAF<br />
D<br />
<br />
TCF<br />
<br />
D<br />
V<br />
i<br />
D<br />
TCF V<br />
i<br />
Equation 3c<br />
Where V i<br />
is the market price <strong>of</strong> each simultaneously derived<br />
product. For a production chain with only one derived product<br />
then, FAF D<br />
is 1 and the extraction rate is equal to the technical<br />
conversion factor.<br />
<strong>Campo</strong> <strong>Grande</strong> <strong>Ecological</strong> <strong>Footprint</strong> 2012 p. 95
Attachments<br />
Normalising bio-productive areas from hectares to<br />
global hectares<br />
Average bio-productivity differs between various land use types<br />
as well as between countries for any given land use type. For<br />
comparability across countries and land use types, <strong>Ecological</strong><br />
<strong>Footprint</strong> and Biocapacity are usually expressed in units <strong>of</strong> worldaverage<br />
bio-productive areas. Expressing <strong>Footprint</strong> in world-average<br />
hectares also facilitates tracking the embodied bio-productivity in<br />
international trade flows.<br />
Yield Factors<br />
Yield factors account for countries’ differing levels <strong>of</strong><br />
productivity for particular land-use types. Yield factors provides<br />
comparability <strong>of</strong> the <strong>Ecological</strong> <strong>Footprint</strong> and biocapacities <strong>of</strong><br />
various countries. Each year each country may have a different<br />
yield factor for cropland, pastures, forests and fisheries. Usually<br />
Yield factors for built-up areas are assumed to be the same<br />
as cropland given that urban areas tend to be built on or near<br />
productive agricultural lands. Natural factors such as differences<br />
in rainfall or soil quality or even management practices all<br />
determine different levels <strong>of</strong> productivity.<br />
<strong>The</strong> weight <strong>of</strong> productivity factors in the different areas <strong>of</strong> the<br />
earth vary according to their relative productivities. For example<br />
the average hectare <strong>of</strong> pasture in New Zeeland produces more grass<br />
than a world average grazing land hectare and is potentially capable<br />
<strong>of</strong> supporting more meat production.<br />
<strong>The</strong> table below shows the yield factors calculated for various<br />
countries as it appeared in the <strong>Global</strong> <strong>Footprint</strong> <strong>Network</strong>’s 2010<br />
edition <strong>of</strong> the National <strong>Footprint</strong> Accounts.<br />
Agriculture Forests Pastures Fisheries<br />
World Average Yields 1.0 1.0 1.0 1.0<br />
Algeria 0.3 0.4 0.7 0.9<br />
Guatemala 0.9 1.1 2.9 1.1<br />
Hungary 1.1 2.6 1.9 1.0<br />
Japan 1.3 1.4 2.2 0.8<br />
Jordan 1.1 1.5 0.4 1.0<br />
New Zeeland 0.8 2.0 2.5 1.0<br />
Zambia 0.2 0.2 1.5 1.0<br />
<strong>Campo</strong> <strong>Grande</strong> <strong>Ecological</strong> <strong>Footprint</strong> 2012 p. 96
<strong>The</strong> yield factor is the ratio <strong>of</strong> national average to world average<br />
yields . It is calculated in terms <strong>of</strong> annual availability <strong>of</strong> usable<br />
products. For any given land use type L, .a country’s yield factor<br />
YF L<br />
is given by:<br />
A<br />
W,i<br />
iU<br />
YF <br />
L<br />
A<br />
Equation 4a<br />
N, i<br />
iU<br />
Where U is the set <strong>of</strong> all useable primary products that a given land<br />
use type yields and Aw,i Aand An,i are the areas necessary to furnish<br />
that country’s annual available amounts <strong>of</strong> products i at world and<br />
national yields respectively. Those areas are calculated as follows:<br />
A<br />
P<br />
N, i i<br />
Y N<br />
Equation 5a<br />
A<br />
P<br />
W, i i<br />
Y W<br />
Equation 56<br />
Where Pi is the total national annual growth <strong>of</strong> product i and<br />
YN and YW are national and world yields respectively. Thus, ANi is<br />
always the area that produces i within a given country while AW,i<br />
gives the equivalent <strong>of</strong> world-average land yielding i.<br />
Most land use types included in <strong>Footprint</strong> accounts provide<br />
only a single primary product such as wood from forest land or<br />
grass from grazing land. For these land use types the equation<br />
simplifies to:<br />
YF L <br />
Y N<br />
Y W<br />
Equation 4b<br />
For those types <strong>of</strong> land use with a single product, by combining<br />
equations 4b and 1a we obtain a simplified formula for <strong>Ecological</strong><br />
<strong>Footprint</strong> calculation in global hectares:<br />
EF <br />
P<br />
YW<br />
EQF<br />
Equation 1b<br />
In practice cultivated arable land is the only land use type where<br />
the extended version <strong>of</strong> the calculation is actually applied.<br />
<strong>Campo</strong> <strong>Grande</strong> <strong>Ecological</strong> <strong>Footprint</strong> 2012 p. 97
Attachments<br />
Equivalence Factors<br />
In order to combine the <strong>Ecological</strong> <strong>Footprint</strong>s or biocapacities<br />
<strong>of</strong> different land use types a second coefficient is necessary.<br />
Equivalence factors convert real areas <strong>of</strong> different land use types<br />
in hectares into their equivalent in global hectares. Equivalence<br />
factors and Yield factors are used in both footprint and<br />
biocapacity calculations to provide consistent results expressed<br />
in comparable units.<br />
Equivalence factors translate the area supplied or demanded for<br />
a given type <strong>of</strong> land use (world average for cropland, grazing land,<br />
forest, fisheries and land for carbon absorption or built-up land)<br />
into average world measurements <strong>of</strong> biologically productive area,<br />
namely, global hectares.<br />
<strong>The</strong> equivalence factor for built-up land is set equal to that for<br />
cropland while that <strong>of</strong> carbon uptake land is set equal to that <strong>of</strong><br />
forest land. That is based on the suppositions that infrastructure<br />
tends to be built on or near productive agricultural land and that<br />
carbon absorption occurs in forest areas. <strong>The</strong> equivalence factor<br />
for hydroelectric reservoir area is set equal to one reflecting the<br />
assumption that hydroelectric reservoirs flood world average land<br />
<strong>The</strong> equivalence factor for marine area is calculated such that a<br />
single global hectare <strong>of</strong> pasture will produce an amount <strong>of</strong> calories<br />
<strong>of</strong> beef equal to the amount <strong>of</strong> calories that can be produced by a<br />
global area <strong>of</strong> fisheries in fish. <strong>The</strong> equivalence factor for waterways<br />
is equal to the equivalence factor for marine areas.<br />
In 2005, for example, the equivalence factor for cultivated<br />
agricultural areas was 2.64 showing that the average productivity<br />
<strong>of</strong> cultivated land in the world was more than double the average<br />
productivity <strong>of</strong> all land types considered together. For that same<br />
year the equivalence factor for grazing land was 0.40 showing that<br />
the pastures were, on average 40% <strong>of</strong> the productivity <strong>of</strong> a global<br />
hectare. Equivalency factors are calculated every year and for a<br />
given year they are the same for all countries.<br />
<strong>Campo</strong> <strong>Grande</strong> <strong>Ecological</strong> <strong>Footprint</strong> 2012 p. 98
Area Type<br />
Equivalence Factor gha/hectare<br />
Agriculture 2.51<br />
Forests 1.26<br />
Grazing land 0.46<br />
Marine and Inland water 0.37<br />
Built-up land 2.51<br />
Equivalency factors are calculated using suitability indexes<br />
from the <strong>Global</strong> Agro-ecological Zones model combined with<br />
data on the actual areas <strong>of</strong> cropland, forest land and grazing land<br />
area from FAOSTAT (FAO and IIASA <strong>Global</strong> Agro-<strong>Ecological</strong><br />
Zones 2000 FAO Resource STATStatistical Database 2007). <strong>The</strong><br />
GAEZ model divides all land globally into five categories based<br />
on calculated potential crop productivity. All land is assigned a<br />
quantitative suitability index that varies from 0.9 (very suitable)<br />
top 0.1 (Not suitable).<br />
<strong>The</strong> calculation <strong>of</strong> the equivalence factors assumes that<br />
the most suitable land available will be used for the for the<br />
most productive form <strong>of</strong> land use. <strong>The</strong> equivalence factors are<br />
calculated as the ratio <strong>of</strong> the world average suitability index for<br />
a given land use type to the average suitability index for all land<br />
use types.<br />
<strong>Campo</strong> <strong>Grande</strong> <strong>Ecological</strong> <strong>Footprint</strong> 2012 p. 99
Attachments<br />
ATTACHMENT B: IDENTIFICATION OF<br />
CONSUMPTION PATTERNS IN CAMPO<br />
GRANDE<br />
Calculation <strong>of</strong><br />
the <strong>Ecological</strong><br />
footprint by<br />
countries<br />
1<br />
How to read<br />
the footprint<br />
by economic<br />
sectors<br />
Evaluate material and energy<br />
flows in each sector<br />
Based on the economy’s<br />
input-product matrix make an<br />
analysis by economic sectors<br />
Based on the economy’s<br />
input-product matrix<br />
make an analysis by<br />
economic sectors<br />
Describe the use <strong>of</strong> ecological<br />
resources by sectors and their<br />
distribution according to the<br />
monetary flows revealed by<br />
the input-product matrix<br />
2<br />
<strong>Ecological</strong> <strong>Footprint</strong> by<br />
industrial sector or Land Use<br />
and Consumption Matrix<br />
Based on the economy’s<br />
input-product matrix<br />
make an analysis by<br />
economic sectors<br />
4<br />
Based on the economy’s<br />
input-product matrix<br />
make an analysis by<br />
economic sectors<br />
3<br />
<strong>Ecological</strong> <strong>Footprint</strong> by<br />
industrial sector or Land Use<br />
and Consumption Matrix (LUCM)<br />
at national level<br />
<strong>Campo</strong> <strong>Grande</strong> <strong>Ecological</strong> <strong>Footprint</strong> 2012 p. 100
Certain steps need to be taken in order to calculate the <strong>Ecological</strong><br />
<strong>Footprint</strong> <strong>of</strong> a municipality.<br />
First we have on hand the <strong>Ecological</strong> <strong>Footprint</strong> <strong>of</strong> a country<br />
and to interpret that footprint and develop strategies to mitigate<br />
its impact, it is essential gain an understanding <strong>of</strong> its distribution<br />
among the various economic sectors. <strong>The</strong>re are two ways <strong>of</strong><br />
obtaining that understanding (point 1).<br />
<strong>The</strong> first is to analyse the flows <strong>of</strong> materials and energy involved<br />
in each product and service in the economy. That will lead us to make<br />
an analysis <strong>of</strong> the life cycle for each goods item consumed and the<br />
aggregate effect <strong>of</strong> the various goods associated to the impact <strong>of</strong> a<br />
given human activity. We will then be able to add up the footprint<br />
incorporated in all food products so that we obtain the overall footprint<br />
for food consumption.<br />
Another way is to analyse the economic flows based on the<br />
input-product matrix and then make use <strong>of</strong> the money flows to<br />
define the consumption <strong>of</strong> natural resources for each economic<br />
sector. By using economic flows per sector we can gain a picture <strong>of</strong><br />
how the <strong>Ecological</strong> <strong>Footprint</strong> permeates the economic sectors.<br />
For various reasons set out in the respective literature 23 , the<br />
GFN opted for the second method in the venture to obtain <strong>Campo</strong><br />
<strong>Grande</strong>’s <strong>Ecological</strong> <strong>Footprint</strong>.<br />
With the <strong>Ecological</strong> <strong>Footprint</strong> grouped by Natural Resources and<br />
the inputs-product matrix in hand, the next step is to describe the use<br />
<strong>of</strong> natural resources by sectors and its distribution according to the<br />
monetary flows revealed by the inputs-product matrix (point 2).<br />
<strong>The</strong> intermediate result <strong>of</strong> this process is that the <strong>Ecological</strong><br />
<strong>Footprint</strong> provides an understanding <strong>of</strong> the final demand per<br />
economic sector. Thus the global impact <strong>of</strong> the consumption <strong>of</strong> the<br />
family and governmental consuming is identified for each economic<br />
sector in the input-product chart.<br />
<strong>The</strong> final result <strong>of</strong> the input-product approach when working<br />
with <strong>Ecological</strong> <strong>Footprint</strong> is a Land Use and Consumption Matrix<br />
which distributes the <strong>Footprint</strong> according to types <strong>of</strong> land use<br />
(crops, pastures, forests, fisheries, carbon uptake land and built up<br />
areas), and does so, specified by consumption category.<br />
23 Kitzes, J., Galli, A., Bagliani, M., Barrett, J., Dige, G., Ede, S., Erb, K-H., Giljum, S., Haberl, H.,<br />
Hails, C., Jungwirth, S., Lenzen, M., Lewis, K., Loh, J., Marchettini, N., Messinger, H., Milne, K.,<br />
Moles, R., Monfreda, C., Moran, D., Nakano, K., Pyhälä, A., Rees, W., Simmons, C., Wackernagel,<br />
M., Wada, Y., Walsh, C., Wiedmann, T., 2009. A research agenda for improving national ecological<br />
footprint accounts. <strong>Ecological</strong> Economics 68(7), 1991-20<br />
<strong>Campo</strong> <strong>Grande</strong> <strong>Ecological</strong> <strong>Footprint</strong> 2012 p. 101
Attachments<br />
<strong>The</strong> family consumption categories that are currently used<br />
in the LUCM are in alignment with United Nations classification<br />
system for consumption, COICO, which makes it feasible to create<br />
a standardised LUCM for various nations. This adjustment needs<br />
to be made so that we can align the national categories with the<br />
international ones [point 3].<br />
<strong>The</strong> <strong>Ecological</strong> <strong>Footprint</strong> that is the point <strong>of</strong> entry for the LUCM<br />
process is the <strong>Ecological</strong> <strong>Footprint</strong> <strong>of</strong> consumptions, a value that<br />
takes into account the <strong>Ecological</strong> <strong>Footprint</strong> <strong>of</strong> the entire national<br />
production adding to it the <strong>Footprint</strong> <strong>of</strong> imported goods and<br />
subtracting the value corresponding to exported goods. That means<br />
that the total LUCM is an illustration <strong>of</strong> per capita consumption <strong>of</strong><br />
goods and services whether they be from national or international<br />
sources. It also means that the LUCM cannot be used to estimate<br />
the impacts <strong>of</strong> family consumption on the biocapacity <strong>of</strong> a given<br />
sub-national region because the aggregated consumption has its<br />
origins in various different bio-regions around the world.<br />
It must be understood that the <strong>Ecological</strong> <strong>Footprint</strong> quantifies<br />
the planetary impacts <strong>of</strong> local consumption which makes it an<br />
excellent indicator for orientating responsible consumption with<br />
awareness. For <strong>Campo</strong> <strong>Grande</strong>’s LUCM it is presumed that the<br />
goods and services production chains are identical to those <strong>of</strong> the<br />
country as a whole.<br />
To identify consumption patterns <strong>of</strong> the average citizen in<br />
<strong>Campo</strong> <strong>Grande</strong> we made use <strong>of</strong> the Household Budget Survey.<br />
Fortunately such surveys have been conducted for <strong>Campo</strong> <strong>Grande</strong><br />
and it is made use <strong>of</strong> by the Economic and Social Science Studies<br />
and Research Nucleus (NEPES) at the Anhanguera University<br />
(Uniderp) in the work <strong>of</strong> determining the Consumer Price Index.<br />
It was necessary to update the 2004 survey to meet the standards<br />
<strong>of</strong> the 2008 survey run by a NEPES technical team in order to<br />
harmonise it with the IBGE 2008 survey. Under NEPES guidance<br />
we adopted as the standard for average expenses patterns in<br />
<strong>Campo</strong> <strong>Grande</strong>, the same value determined by the IBGE’s HBS<br />
for the State <strong>of</strong> Mato Grosso as a whole. That was the last step<br />
(point 4) for us to arrive at <strong>Campo</strong> <strong>Grande</strong>’s <strong>Ecological</strong> <strong>Footprint</strong>.<br />
<strong>The</strong>re now follow some details <strong>of</strong> sources and the structure <strong>of</strong><br />
the tables so that the more technical reader can obtain a clearer<br />
idea <strong>of</strong> what the steps described above actually meant in terms <strong>of</strong><br />
adapting the data.<br />
<strong>Campo</strong> <strong>Grande</strong> <strong>Ecological</strong> <strong>Footprint</strong> 2012 p. 102
Adjusting the HBS <strong>of</strong> <strong>Campo</strong> <strong>Grande</strong><br />
According to Souza e Reis Neto (2003), the HBS that was elaborated<br />
for <strong>Campo</strong> <strong>Grande</strong> in 1999 and updated in 2002 by<br />
the Economic Research Institute FIPE consists <strong>of</strong> the following<br />
main groups:<br />
• NUTRITION – Cereals, meats, fats, sugars and sweets,<br />
beverages, fruits, greens and vegetables, condiments, eating<br />
out and other;<br />
• HOUSING – Rent, repairs and overhauls, taxes, cleaning<br />
products etc.;<br />
• CLOTHING – Men and women’s clothing, footwear (adult and<br />
juvenile) etc.;<br />
• TRANSPORT – Fuel, fares, (urban and inter-city), vehicles,<br />
parts, maintenance etc.;<br />
• PERSONAL EXPENSES - Beauty parlour, domestic utilities etc.;<br />
• HEALTH – Medial, Dental and Pharmaceutical care and<br />
assistance;<br />
• EDUCATION – School fees, stationary etc.<br />
Hierarchic levels<br />
considered for the<br />
<strong>Campo</strong> Grand HBS<br />
To bring that survey up to date and align it with the data <strong>of</strong><br />
the 2008-2009 survey conducted by the Brazilian Geography and<br />
Statistics Institute two more Groups were added to be taken into<br />
consideration: OTHER CURRENT EXPENSES – Taxes, labour<br />
contributions banking services, pensions, monthly allowances<br />
private social security etc, and ASSETS AND DEBTS – increases in<br />
assets and decreases in debts<br />
GROUP<br />
ITEM<br />
SUB-ITEM<br />
<strong>Campo</strong> <strong>Grande</strong> <strong>Ecological</strong> <strong>Footprint</strong> 2012 p. 103
Attachments<br />
<strong>The</strong> hierarchy <strong>of</strong> the weighting structure consists <strong>of</strong> Group, Item<br />
and sub-item as shown in Figure 1.<br />
<strong>The</strong> updated version <strong>of</strong> the Personal expenses Group is formed<br />
by five groups brought in from the IBGE HBS, namely: Hygiene and<br />
personal care, Recreation and culture, Tobacco, Personal services,<br />
and Miscellaneous Expenses.<br />
<strong>The</strong> weight attributed to the Personal Expenses group is the sum<br />
<strong>of</strong> the five weights attributed in the IBGE survey (BRAZIL, 2010).<br />
<strong>The</strong> distribution <strong>of</strong> the Groups, Items and sub-items in the<br />
updated HBS are the same as those <strong>of</strong> the IBGE with some slight<br />
differences deriving from the proportional distribution <strong>of</strong> the<br />
relative weights to the sub-items which happened to show in<br />
the IBGE HBS but for which it proved impossible to determine<br />
compatible sub-items for the group in question (BRAZIL, 2010).<br />
Those sub-items with zero weighting in the IBGE HBS were not<br />
considered in the process <strong>of</strong> adjusting and updating the <strong>Campo</strong><br />
<strong>Grande</strong> HBS.<br />
Adjusted Version <strong>of</strong> the Household Budget Survey for the<br />
State <strong>of</strong> Mato Grosso do Sul<br />
Type <strong>of</strong> expenditure Total Type <strong>of</strong> Expenditure Total<br />
Total expenditure 100.0 Education 2.0<br />
Current expenditure 90.6 Regular courses 0.5<br />
Consumption expenditure 79.2 Higher education courses 0.6<br />
Food 15.0 Other courses and activities 0.5<br />
Housing 28.6<br />
Educational books and<br />
technical reviews<br />
0.1<br />
Rent 12.1 School material 0.2<br />
Monetary rental 2.0 Others 0.1<br />
Non monetary rental 10.1 Recreation and culture 1.3<br />
Condominium 0.3 Toys and games 0.2<br />
Services and taxes 8.1 Mobile phone & accessories 0.4<br />
Electricity 2.7<br />
Non instructional Periodicals,<br />
books and magazines<br />
0.1<br />
Fixed phone 0.9 Recreation and sports 0.3<br />
Mobile phone 1.3 Others 0.3<br />
Telephone, TV and Internet<br />
package<br />
0.6 Tobacco 0.3<br />
Household gas 1.0 Personal services 0.8<br />
Water and sewage 1.1 Hairdresser 0.5<br />
Others 0.4 Manicuro e pedicuro 0.2<br />
Table 1 represents the<br />
Household Budget Survey<br />
(HBS) <strong>of</strong> the State <strong>of</strong><br />
Mato Grosso do Sul State<br />
undertaken by the IBGE<br />
for the years 2008-2009<br />
which was used to adjust<br />
the HBS values for <strong>Campo</strong><br />
<strong>Grande</strong>.<br />
<strong>Campo</strong> <strong>Grande</strong> <strong>Ecological</strong> <strong>Footprint</strong> 2012 p. 104
Type <strong>of</strong> expenditure Total Type <strong>of</strong> Expenditure Total<br />
Home maintenance 3.2 Repair <strong>of</strong> personal items 0.0<br />
Cleaning products 0.7 Others 0.1<br />
Furniture and household items 1.7 Miscellaneous expenses 2.4<br />
Household appliances 2.2 Gambling and betting 0.1<br />
Repairs for household items 0.3 Communication 0.1<br />
Clothing 4.4 Ceremonies and celebration 0.4<br />
Men’s wear 1.0 Pr<strong>of</strong>essional services 1.0<br />
Women’s wear 1.2 Properties for occasional use 0.2<br />
Children’s wear 0.6 Others 0.6<br />
Shoes and accessories 1.4 Other current expenses 11.5<br />
Costume and real jewellery 0.2 Taxes 4.5<br />
Cloth and haberdashery 0.0 Labour contributions 3.3<br />
Transport 16.5 Banking services 0.4<br />
Urban 1.2<br />
Pensions, allowances &<br />
donations<br />
1.6<br />
Gasoline – own vehicle 3.0 Private social security 0.1<br />
Alcohol – own vehicle 0.2 Others 1.6<br />
Maintenance and accessories 2.1 Increased assets 6.2<br />
Vehicle acquisition 8.0 Real estate (acquisition) 4.1<br />
Sporadic trips 1.1 Property (refurbishing) 2.2<br />
Others 0.9 Other investments 0.0<br />
Hygiene and personal care for<br />
personal use<br />
2.1 Debt reduction 3.1<br />
Health assistance 0.8 Loan 2.7<br />
Medicines 0.2 Property instalments 0.4<br />
Toilet soap 0.1<br />
Instruments and products 1.0<br />
Health assistance 5.7<br />
Medicines 2.8<br />
Health Plan/Insurance 1.7<br />
Dental consultation and<br />
treatment<br />
0.3<br />
Medical consultation 0.2<br />
Medical and outpatient<br />
treatment<br />
0.0<br />
Surgical service 0.1<br />
Hospital admission 0.1<br />
Miscellaneous examinations 0.2<br />
Treatment material 0.3<br />
Others 0.1<br />
<strong>Campo</strong> <strong>Grande</strong> <strong>Ecological</strong> <strong>Footprint</strong> 2012 p. 105
Attachments<br />
<strong>The</strong> IBGE dismembered the Food/Nutrition Group in a single<br />
table due to its importance and great variety (TABLE 2).<br />
Monthly average monetary<br />
and non monetary family<br />
Type and average size <strong>of</strong> family spending on food expenditure on food (R$)<br />
Total<br />
Expenditure on food 368,15<br />
Eating at home 272,98<br />
Cereals, vegetables and oil plants 23,14<br />
Rice 15,03<br />
Beans 6,17<br />
Organics 0,07<br />
Others 1,88<br />
Meals, starches and pastas 10,59<br />
Macaroni 3,14<br />
Flour 2,39<br />
Manioc meal (Cassava) 0,44<br />
Others 4,64<br />
Tubercles and roots 5,09<br />
Potato 1,38<br />
Carrots 0,81<br />
Manioc 1,34<br />
Outros 1,56<br />
Sugar and derivates 13,92<br />
Refined sugar 0,18<br />
Crystal sugar 2,91<br />
Light and diet 0,25<br />
Others 10,58<br />
Greens and vegetables 11,62<br />
Tomato 4,32<br />
Onion 1,26<br />
Lettuce 1,58<br />
Others 4,46<br />
Fruits 12,05<br />
Banana 2,80<br />
Oranges 1,83<br />
Apple 1,35<br />
Other fruits 6,07<br />
Meats, viscera and fish 66,13<br />
Top quality beef 19,72<br />
Regular beef 16,19<br />
Pork 1,72<br />
Industrialised meat and fish 10,50<br />
Fresh fish 2,20<br />
Others 15,81<br />
Poultry and eggs 14,38<br />
Chicken 10,83<br />
Chicken 3,15<br />
Organics -<br />
Others 0,40<br />
Table 2 – family<br />
monetary expenditure<br />
on food by total income<br />
brackets and family assets<br />
variation/month, classified<br />
by types <strong>of</strong> expenditure<br />
with an indication <strong>of</strong> the<br />
number and average size<br />
<strong>of</strong> families – Mato Grosso<br />
do Sul- period- 2008-2009<br />
<strong>Campo</strong> <strong>Grande</strong> <strong>Ecological</strong> <strong>Footprint</strong> 2012 p. 106
Milk and dairy products 29,12<br />
Cows milk 14,32<br />
Powdered milk 1,34<br />
Cheeses 5,20<br />
Light and diet 0,22<br />
Organics 0,15<br />
Others 7,89<br />
Bakery products 21,20<br />
Bread rolls 9,82<br />
Biscuits 5,64<br />
Light and diet 0,16<br />
Other bakery products 5,58<br />
Fats and Oils 7,28<br />
Soy oil 5,65<br />
Olive oil 0,65<br />
Others 0,97<br />
Beverages and infusions 27,44<br />
Ground c<strong>of</strong>fee 5,46<br />
S<strong>of</strong>t drinks 9,25<br />
Non alcoholic drinks light & diet 0,28<br />
Beers and chopps 6,57<br />
Other alcoholic drinks 1,12<br />
Other 4,76<br />
Tinned food and preserves 2,59<br />
Salt and condiments 8,10<br />
Tomato paste 1,86<br />
Mayonaise 0,75<br />
Refined salt 0,57<br />
Others 4,91<br />
Ready made food 8,37<br />
Other foods 11,95<br />
Eating out 95,18<br />
Lunch and dinner 51,99<br />
C<strong>of</strong>fee, milk, c<strong>of</strong>fee/milk and chocolate 0,80<br />
Sandwiches and savouries 8,61<br />
S<strong>of</strong>t drinks and other non alcoholic drinks 7,10<br />
Snacks 10,24<br />
Beers, choppps and other alcoholic drinks 7,71<br />
School meals 3,52<br />
Light and diet food 0,28<br />
Others 4,92<br />
Number <strong>of</strong> families 746 555<br />
Average size <strong>of</strong> family 3,19<br />
Source: IBGE, Surveys Department, Work and Income Coordinating body, Family Budget Survey<br />
2008-2009.<br />
Notes:<br />
1. <strong>The</strong> term ‘household’ is being used to indicate the ‘Consumption Unit’ targeted by the survey as<br />
mentioned in the introduction.<br />
2. Total income brackets and monthly variations in family assets including monetary income,<br />
non monetary income and variations in assets.<br />
(1) Including those with no income.<br />
<strong>Campo</strong> <strong>Grande</strong> <strong>Ecological</strong> <strong>Footprint</strong> 2012 p. 107
Attachments<br />
Table 3 represents expenditure by households in the city <strong>of</strong> <strong>Campo</strong><br />
<strong>Grande</strong> according to the Household Budget Survey conducted by the<br />
Brazilian Geography and Statistics Institute –IBGE ’s with values<br />
updated and weighted according to values used for the State <strong>of</strong> Mato<br />
Grosso do Sul by that survey for the period 2008-2009.<br />
Weight ( % ) Weight<br />
Total expense 100.0000000 1.0000000 g: group<br />
Current expenditure 90.6000000 0.9060000 i: Item<br />
Consumption expenditure 79.2000000 0.7920000 si: sub-Item<br />
Food 15.0000000 0.1500000 g<br />
Cereals, vegetables and oil plants 0.94279519 0.0094280 i<br />
Rice 0.61356512 0.0061357 si<br />
Corn for canjica 0.04988334 0.0004988 si<br />
Corn for popcorn 0.02494167 0.0002494 si<br />
Beans 0.25440505 0.0025441 si<br />
Meals, starches and pastas 0.43398510 0.0043399 i<br />
Macaroni 0.13468503 0.0013469 si<br />
Manioc meal 0.01496500 0.0001497 si<br />
Flour 0.08979002 0.0008979 si<br />
Oat meal 0.01196290 0.0001196 si<br />
Corn meal 0.00031479 0.0000031 si<br />
Breadcrumb meal 0.00031479 0.0000031 si<br />
Farinha láctea 0.00031479 0.0000031 si<br />
Yeast 0.01184048 0.0001184 si<br />
Grated coconut 0.03261532 0.0003262 si<br />
Oat flakes 0.00031479 0.0000031 si<br />
Cerial flakes 0.01198866 0.0001199 si<br />
Flaked maize 0.01198866 0.0001199 si<br />
Manioc starch 0.05365004 0.0005365 si<br />
Corn meal 0.02867702 0.0002868 si<br />
Corn starch 0.01750719 0.0001751 si<br />
Pasty dough 0.01274085 0.0001274 si<br />
Pizza dough 0.00031479 0.0000031 si<br />
Tubercles and roots 0.20951005 0.0020951 i<br />
Potato 0.07076626 0.0007077 si<br />
Carrot 0.03538313 0.0003538 si<br />
Tabela 3 – <strong>Campo</strong><br />
<strong>Grande</strong> Household Budget<br />
Survey data updated<br />
according the weighting<br />
attributions adopted by<br />
the IBGE for the State<br />
<strong>of</strong> Mato Grosso do Sul –<br />
period 2008-2009.<br />
<strong>Campo</strong> <strong>Grande</strong> <strong>Ecological</strong> <strong>Footprint</strong> 2012 p. 108
Manioc (Cassava) 0.07076626 0.0007077 si<br />
Garlic 0.03259439 0.0003259 si<br />
Sugar and derivates 0.64088820 0.0064089 i<br />
Crystal sugar 0.13492383 0.0013492 si<br />
Refined sugar 0.48909889 0.0048910 si<br />
Light and diet sweeteners 0.01686548 0.0001687 si<br />
Greens and vegetables 0.39415053 0.0039415 i<br />
Lettuce 0.05986001 0.0005986 si<br />
Onions 0.04489501 0.0004490 si<br />
Tomato 0.17958004 0.0017958 si<br />
Fresh Coriander and onion leaf 0.00894264 0.0000894 si<br />
Spinach 0.00064089 0.0000064 si<br />
Chicory 0.01699204 0.0001699 si<br />
Cauliflower 0.00891166 0.0000891 si<br />
Cabbage 0.01471508 0.0001472 si<br />
Parsley 0.00064089 0.0000064 si<br />
Puimpkin 0.01235446 0.0001235 si<br />
Courgette 0.00466501 0.0000467 si<br />
Egg Plant 0.00655895 0.0000656 si<br />
Beetroot 0.00662085 0.0000662 si<br />
Chayote 0.00845672 0.0000846 si<br />
Corn on the cob 0.00655895 0.0000656 si<br />
Cucumber 0.00719840 0.0000720 si<br />
Sweet pepper 0.00655895 0.0000656 si<br />
Fruits 0.49384512 0.0049385 i<br />
Banana 0.11972002 0.0011972 si<br />
Orange 0.07482502 0.0007483 si<br />
Apple 0.05986001 0.0005986 si<br />
Pineapple 0.02714665 0.0002715 si<br />
Coconut 0.00692993 0.0000693 si<br />
Guava 0.00692993 0.0000693 si<br />
Lime 0.00692993 0.0000693 si<br />
Papaya 0.04195921 0.0004196 si<br />
Mango 0.00692993 0.0000693 si<br />
Passion fruit 0.04188631 0.0004189 si<br />
Watermelon 0.02842962 0.0002843 si<br />
Strawberry 0.00692993 0.0000693 si<br />
Peach 0.00692993 0.0000693 si<br />
<strong>Campo</strong> <strong>Grande</strong> <strong>Ecological</strong> <strong>Footprint</strong> 2012 p. 109
Attachments<br />
Cantaloupe 0.01496322 0.0001496 si<br />
Grapes 0.04347546 0.0004348 si<br />
Top-grade beef 1.05991432 0.0105991 i<br />
Rump 0.34779086 0.0034779 si<br />
Rump skirt 0.25910432 0.0025910 si<br />
Loin 0.21312735 0.0021313 si<br />
Topside 0.03607024 0.0003607 si<br />
Outside flat 0.00724699 0.0000725 si<br />
Filé-mignon 0.00724699 0.0000725 si<br />
Sirloin 0.18932758 0.0018933 si<br />
2nd grade beef 0.86363389 0.0086363 i<br />
Chuck 0.23956377 0.0023956 si<br />
Ribs 0.12874295 0.0012874 si<br />
Hump 0.02328771 0.0002329 si<br />
Liver 0.04913732 0.0004914 si<br />
Topside 0.03306298 0.0003306 si<br />
Shin 0.04043218 0.0004043 si<br />
Blade 0.05473034 0.0005473 si<br />
Rump skirt 0.04000123 0.0004000 si<br />
Flank 0.04389666 0.0004390 si<br />
Neck steak 0.08913855 0.0008914 si<br />
Neck 0.01828982 0.0001829 si<br />
Knuckle 0.02805671 0.0002806 si<br />
Visceras (bovine) 0.07529366 0.0007529 si<br />
Pork 0.09814022 0.0009814 i<br />
Pork chops 0.02500439 0.0002500 si<br />
Pork ribs 0.01061104 0.0001061 si<br />
Pork loin 0.02212572 0.0002213 si<br />
Fresh fat 0.00100132 0.0000100 si<br />
Pork leg 0.03939774 0.0003940 si<br />
Industrialised meat and fish 0.56920885 0.0056921 i<br />
Tinned meat 0.02940894 0.0002941 si<br />
Dry/jerked meat 0.07633163 0.0007633 si<br />
Fresh sausage 0.07572248 0.0007572 si<br />
Spam 0.02750563 0.0002751 si<br />
Ham 0.03017653 0.0003018 si<br />
Sausage 0.05455572 0.0005456 si<br />
<strong>Campo</strong> <strong>Grande</strong> <strong>Ecological</strong> <strong>Footprint</strong> 2012 p. 110
Tuna 0.13775396 0.0013775 si<br />
Tinned sardines 0.13775396 0.0013775 si<br />
Fresh fish 0.11776817 0.0011777 i<br />
Freshwater fish 0.08125988 0.0008126 si<br />
Sea fish 0.03650830 0.0003651 si<br />
Poultry and eggs 0.58363512 0.0058364 i<br />
Chicken 0.43398509 0.0043399 si<br />
Chicken giblets 0.01496500 0.0001497 si<br />
Chicken eggs 0.13468503 0.0013469 si<br />
Milk and dairy products 1.18223524 0.0118224 i<br />
Pasteurised milk 0.25123413 0.0025123 si<br />
Type C milk 0.33240099 0.0033240 si<br />
Ordinary powdered milk 0.04196789 0.0004197 si<br />
Infnt formula milk 0.01789213 0.0001789 si<br />
Mussarela/prato cheese 0.05237751 0.0005238 si<br />
Cream cheese 0.05237751 0.0005238 si<br />
Minas cheese 0.10475502 0.0010476 si<br />
Cream 0.00000241 0.0000000 si<br />
Yoghurt, curds and jellied milk 0.18961491 0.0018961 si<br />
Condensed milk 0.00000241 0.0000000 si<br />
Butter 0.12464534 0.0012465 si<br />
Light and diet butter 0.01496500 0.0001497 si<br />
Bakery products 0.85300517 0.0085301 i<br />
Bread rolls 0.40405508 0.0040406 si<br />
Biscuits 0.11090257 0.0011090 si<br />
Crackers 0.11357248 0.0011357 si<br />
Mini stick bread (bag) 0.00860968 0.0000861 si<br />
Stick bread 0.00860968 0.0000861 si<br />
Specialty pan bread 0.01935432 0.0001935 si<br />
Hamburger buns 0.01935432 0.0001935 si<br />
Potato bread 0.00860968 0.0000861 si<br />
Wholemeal pan bread 0.01935432 0.0001935 si<br />
Honey bread 0.00908882 0.0000909 si<br />
Corn bread 0.00860968 0.0000861 si<br />
Cheese bread 0.03316587 0.0003317 si<br />
Wholemeal bread 0.00860968 0.0000861 si<br />
Mandy bread 0.00860968 0.0000861 si<br />
<strong>Campo</strong> <strong>Grande</strong> <strong>Ecological</strong> <strong>Footprint</strong> 2012 p. 111
Attachments<br />
Sweet bread 0.03592560 0.0003593 si<br />
Rye bread 0.00860968 0.0000861 si<br />
Pan bread 0.01935432 0.0001935 si<br />
Hot-dog rolls 0.00860968 0.0000861 si<br />
Fats and oils 0.29930006 0.0029930 i<br />
Soy oil 0.26408829 0.0026409 si<br />
Olive oil 0.03521177 0.0003521 si<br />
Beverages and infusions 1.05015715 0.0105016 i<br />
C<strong>of</strong>fee 0.25298218 0.0025298 si<br />
Instant c<strong>of</strong>fee 0.00449746 0.0000450 si<br />
S<strong>of</strong>t drinks 0.42163697 0.0042164 si<br />
Non alcoholic drinks 0.01686548 0.0001687 si<br />
Beer and chopp 0.30357862 0.0030358 si<br />
Other alcoholic drinks 0.05059644 0.0005060 si<br />
Tinned and preserved food 0.10475502 0.0010476 i<br />
Palm heart 0.01751536 0.0001752 si<br />
Olives 0.04178876 0.0004179 si<br />
Peas 0.00002329 0.0000002 si<br />
Margarine 0.03594047 0.0003594 si<br />
Creamed rice 0.00870663 0.0000871 si<br />
Corn on the cob 0.00002329 0.0000002 si<br />
Bean stew (Feijoada) 0.00010529 0.0000011 si<br />
Sausage 0.00065194 0.0000065 si<br />
Salt and condiments 0.32923662 0.0032924 i<br />
Mayonaise 0.02993001 0.0002993 si<br />
Tomato paste 0.07482502 0.0007483 si<br />
Refined salt 0.02993001 0.0002993 si<br />
Meat and chicken bouillon 0.00146340 0.0000146 si<br />
Pepper 0.04333611 0.0004334 si<br />
Dehydrated soup 0.04503471 0.0004503 si<br />
Seasoning 0.06611620 0.0006612 si<br />
Vinager 0.03860118 0.0003860 si<br />
Prepared foods 0.34419507 0.0034420 i<br />
Frozen foods 0.19000774 0.0019001 si<br />
Savouries 0.15418733 0.0015419 si<br />
Other foods 0.47888010 0.0047888 i<br />
Sweets and chewing gum 0.04150593 0.0004151 si<br />
<strong>Campo</strong> <strong>Grande</strong> <strong>Ecological</strong> <strong>Footprint</strong> 2012 p. 112
Sweets 0.04848762 0.0004849 si<br />
Chocolate bar 0.05797317 0.0005797 si<br />
Chocolate powder 0.11046168 0.0011046 si<br />
Preserves in syrup 0.06418097 0.0006418 si<br />
Preserves in paste or solid form 0.07233398 0.0007233 si<br />
Frozen sweets 0.08151484 0.0008151 si<br />
Ready to bake mixes 0.00080731 0.0000081 si<br />
Honey, syrup and karo 0.00080731 0.0000081 si<br />
Gelatine powder 0.00080731 0.0000081 si<br />
Outside the home 3.95076080 0.0395076 i<br />
Lunch and dinner 2.22822909 0.0222823 si<br />
C<strong>of</strong>fee, milk, c<strong>of</strong>fee/milk and<br />
chocolate<br />
0.03160609 0.0003161 si<br />
Sandwiches and savouries 0.36346999 0.0036347 si<br />
S<strong>of</strong>t drinks and other non<br />
alcoholic drinks<br />
0.30025782 0.0030026 si<br />
Snacks 0.44248521 0.0044249 si<br />
Beers, chopp, and other alcoholic<br />
drinks<br />
0.33186391 0.0033186 si<br />
School meals 0.23704565 0.0023705 si<br />
Light and diet food 0.01580304 0.0001580 si<br />
Housing 28.60000000 0.2860000 g<br />
Rent in money 2.00000000 0.0200000 i<br />
Apartment rent 1.00000000 0.0100000 si<br />
House rent 1.00000000 0.0100000 si<br />
Non monetary rent 10.10000000 0.1010000 i<br />
Renting apartament 5.05000000 0.0505000 si<br />
Renting house 5.05000000 0.0505000 si<br />
Condominium 0.30000000 0.0030000 i<br />
Aprtment Condominium 0.30000000 0.0030000 si<br />
Taxes and Services 8.10000000 0.0810000 i<br />
Electricity 2.84914713 0.0284915 si<br />
Fixed phone 0.94971571 0.0094972 si<br />
Mobile phone 1.37181158 0.0137181 si<br />
Telephone, TV & internet pkg. 0.63314381 0.0063314 si<br />
Internet 0.08017844 0.0008018 si<br />
Domestic gas (cylinder) 1.05523968 0.0105524 si<br />
Water and sewage 1.16076365 0.0116076 si<br />
<strong>Campo</strong> <strong>Grande</strong> <strong>Ecological</strong> <strong>Footprint</strong> 2012 p. 113
Attachments<br />
Domestic items and home<br />
maintenance<br />
3.20000000 0.0320000 i<br />
Charcoal 0.07565012 0.0007565 si<br />
Matches 0.30260047 0.0030260 si<br />
Batteries 0.37825059 0.0037825 si<br />
Candles 0.15130024 0.0015130 si<br />
Lap 0.34042553 0.0034043 si<br />
Brick 0.22695035 0.0022695 si<br />
Cement 0.24964539 0.0024965 si<br />
Sand 0.11347518 0.0011348 si<br />
Stone 0.12104019 0.0012104 si<br />
Iron and steel 0.18156028 0.0018156 si<br />
Decks 0.07565012 0.0007565 si<br />
Floors 0.27234043 0.0027234 si<br />
Paint 0.30260047 0.0030260 si<br />
Lawnmower 0.22695035 0.0022695 si<br />
Rake 0.07565012 0.0007565 si<br />
Hoe 0.10591017 0.0010591 si<br />
Cleaning articles 0.70000000 0.0070000 i<br />
Chlorinated Water 0.03537345 0.0003537 si<br />
Alcohol 0.00051925 0.0000052 si<br />
S<strong>of</strong>teners 0.05496368 0.0005496 si<br />
Wax for floors 0.06554399 0.0006554 si<br />
Disinfectant 0.04535892 0.0004536 si<br />
Detergent 0.06395774 0.0006396 si<br />
Steel Sponge 0.04853935 0.0004854 si<br />
Insecticide 0.00051925 0.0000052 si<br />
Kerosene 0.00051925 0.0000052 si<br />
Glass-cleaner 0.00051925 0.0000052 si<br />
Furniture polish 0.00051925 0.0000052 si<br />
Cleaning cloth 0.00051925 0.0000052 si<br />
Soap in solid bars 0.10444686 0.0010445 si<br />
Soap Powder 0.25030286 0.0025030 si<br />
Saponaceous materials 0.00051925 0.0000052 si<br />
Brooms 0.02787840 0.0002788 si<br />
Furniture and domestic items 1.70000000 0.0170000 i<br />
Kitchen table 0.28333333 0.0028333 si<br />
Dining Table 0.24285714 0.0024286 si<br />
<strong>Campo</strong> <strong>Grande</strong> <strong>Ecological</strong> <strong>Footprint</strong> 2012 p. 114
Set <strong>of</strong> s<strong>of</strong>a and chairs 0.16190476 0.0016190 si<br />
Double bed 0.28333333 0.0028333 si<br />
Single Bed 0.12142857 0.0012143 si<br />
Double Matress 0.20238095 0.0020238 si<br />
Single Matress 0.10523810 0.0010524 si<br />
6-door Wardrobe 0.13761905 0.0013762 si<br />
Steel Stand 0.06476190 0.0006476 si<br />
Table for Computer 0.04047619 0.0004048 si<br />
Stand for TV and sound apparatus 0.05666667 0.0005667 si<br />
Electrical/electronic equipment 2.20000000 0.0220000 i<br />
Air conditioning 0.13466355 0.0013466 si<br />
Stove 0.19512921 0.0019513 si<br />
Microwave Oven 0.07909884 0.0007910 si<br />
Freezer 0.09097596 0.0009098 si<br />
Blender 0.07107723 0.0007108 si<br />
Washing Machine 0.45480848 0.0045481 si<br />
Refrigerator 0.47796795 0.0047797 si<br />
Ventilator 0.06654545 0.0006655 si<br />
Sound reproduction apparatus 0.07532931 0.0007533 si<br />
Television set 0.33829348 0.0033829 si<br />
Videocassete 0.08341470 0.0008341 si<br />
Computer 0.10426838 0.0010427 si<br />
Printer 0.02842748 0.0002843 si<br />
Repair <strong>of</strong> household articles 0.30000000 0.0030000 i<br />
Household articles repair 0.30000000 0.0030000 si<br />
Vestuário 4.40000000 0.0440000 g<br />
Menswear 1.00000000 0.0100000 i<br />
Male Shorts and Bermudas 0.19645069 0.0019645 si<br />
Long Male Shorts 0.48326290 0.0048326 si<br />
Male Shirt 0.25261337 0.0025261 si<br />
Male T-shirt 0.06767304 0.0006767 si<br />
Women ’s clothing 1.20000000 0.0120000 i<br />
Female shorts and Bermuda<br />
model<br />
0.08991436 0.0008991 si<br />
Blouse 0.30759556 0.0030760 si<br />
Very feminine long shorts 0.35949487 0.0035949 si<br />
Female T-shirt 0.07143600 0.0007144 si<br />
<strong>Campo</strong> <strong>Grande</strong> <strong>Ecological</strong> <strong>Footprint</strong> 2012 p. 115
Attachments<br />
Lingerie 0.14617462 0.0014617 si<br />
Skirts 0.05336965 0.0005337 si<br />
Skirts 0.17201494 0.0017201 si<br />
Children’s Clothes 0.60000000 0.0060000 i<br />
Uniform 0.05495814 0.0005496 si<br />
Infants long pants 0.06735497 0.0006735 si<br />
Infants Coats 0.04123991 0.0004124 si<br />
Infants Clothing 0.05267768 0.0005268 si<br />
Infants shorts 0.06381718 0.0006382 si<br />
Infants Shirts 0.06182080 0.0006182 si<br />
Infants T-shirts 0.05360834 0.0005361 si<br />
Nappies 0.07560296 0.0007560 si<br />
Infants sports outfit 0.04211373 0.0004211 si<br />
Infants Overalls 0.02439584 0.0002440 si<br />
Shorts and T-shirt set 0.06241045 0.0006241 si<br />
Shoes and accessories 1.40000000 0.0140000 i<br />
Men’s shoe 0.29476471 0.0029476 si<br />
Women’s shoes 0.33683092 0.0033683 si<br />
Children’s Shoes 0.0435751 0.0004358<br />
Male Sandals/slippers 0.05265318 0.0005265 si<br />
Female sandals/slippers 0.05265318 0.0005265 si<br />
Infant sandals/slippers 0.04628204 0.0004628<br />
Trainers 0.57324087 0.0057324 si<br />
Costume and authentic jewellery 0.20000000 0.0020000 i<br />
Male wristwatch 0.06558046 0.0006558 si<br />
Female wristwatch 0.07664558 0.0007665 si<br />
Earring 0.01523041 0.0001523 si<br />
Bracelet 0.03116495 0.0003116 si<br />
Ring 0.01137860 0.0001138 si<br />
Cloth and haberdashery 0.00000562 0.0000001 i<br />
Cloth 0.00000325 0.0000000 si<br />
Haberdashery 0.00000237 0.0000000 si<br />
Transport 16.50000000 0.1650000 g<br />
Urban 1.20000000 0.0120000 i<br />
Urban Buses 1.08923872 0.0108924 si<br />
Taxi 0.11076128 0.0011076 si<br />
<strong>Campo</strong> <strong>Grande</strong> <strong>Ecological</strong> <strong>Footprint</strong> 2012 p. 116
Fuel 4.10000000 0.0410000 i<br />
Petrol/Gasoline – own vehicle 2.00000000 0.0200000 si<br />
Ethanol – own vehicle 1.20000000 0.0120000 si<br />
Diesel 0.90000000 0.0090000 si<br />
Maintenance and accessories 2.10000000 0.0210000 i<br />
Labour 1.29230769 0.0129231 si<br />
Tire 0.80769231 0.0080769 si<br />
Vehicle purchase 8.00000000 0.0800000 i<br />
New vehicle 2.07920932 0.0207921 si<br />
Used vehicle 4.15830537 0.0415831 si<br />
New motorbike 0.37936650 0.0037937 si<br />
Used motorbike 0.75884627 0.0075885 si<br />
New pickup 0.20809085 0.0020809 si<br />
Used pickup 0.41618170 0.0041618 si<br />
Sporadic trips 1.10000000 0.0110000 i<br />
Interstate coach 0.55000000 0.0055000 si<br />
Inter-municipal coach 0.55000000 0.0055000 si<br />
Personal Expenditure 6.90000000 0.0690000 g<br />
Personal Care and Hygiene 2.10000000 0.0210000 i<br />
Perfume 0.80000000 0.0080000 si<br />
Hair Care Products 0.20000000 0.0020000 si<br />
Toilet Soap 0.10000000 0.0010000 si<br />
Menstrual Absorbents 0.06995661 0.0006996 si<br />
Toothpaste 0.10412847 0.0010413 si<br />
Dental Floss 0.05206423 0.0005206 si<br />
Moisturiser 0.16327233 0.0016327 si<br />
Toilet paper 0.15924707 0.0015925 si<br />
Skin cleaning products 0.10517108 0.0010517 si<br />
Tanning products 0.08163616 0.0008164 si<br />
Sunblock 0.08163616 0.0008164 si<br />
Shampoo 0.18288788 0.0018289 si<br />
Recreation and culture 1.30000000 0.0130000 i<br />
Toys and games 0.20000000 0.0020000 si<br />
Mobile phone and accessories 0.40000000 0.0040000 si<br />
Non educational reviews, Books<br />
and magazine<br />
0.10000000 0.0010000 si<br />
Recreation and sports 0.30000000 0.0030000 si<br />
Leisure (club) 0.30000000 0.0030000 si<br />
Smoking 0.30000000 0.0030000 i<br />
Personal Services 0.80000000 0.0080000 i<br />
<strong>Campo</strong> <strong>Grande</strong> <strong>Ecological</strong> <strong>Footprint</strong> 2012 p. 117
Attachments<br />
Hairdresser<br />
(Haircuts and Hair Colouring)<br />
0.50000000 0.0050000 si<br />
Manicure and pedicure 0.20000000 0.0020000 si<br />
Workout Gym 0.05000000 0.0005000 si<br />
Aesthetics Clinics 0.05000000 0.0005000 si<br />
Miscellaneous Expenses 2.40000000 0.0240000 i<br />
Betting and Gambling 0.10000000 0.0010000 si<br />
Postage 0.10000000 0.0010000 si<br />
Ceremonies and Celebrations 0.40000000 0.0040000 si<br />
Pr<strong>of</strong>essional Services 1.00000000 0.0100000 si<br />
Properties used occasionally 0.20000000 0.0020000 si<br />
Cinema and events 0.60000000 0.0060000 si<br />
Health Assistance 5.70000000 0.0570000 g<br />
Medicines 2.80000000 0.0280000 i<br />
Painkillers and anti-Fever drugs 0.27696488 0.0027696 si<br />
Anti-allergy drugs and<br />
bronco-dilators<br />
0.12065881 0.0012066 si<br />
Anti-conception drugs and<br />
hormones<br />
0.10436018 0.0010436 si<br />
Anti-diabetic drugs 0.27037476 0.0027037 si<br />
Common cold and cough<br />
medicines<br />
0.27037476 0.0027037 si<br />
Antibiotics and anti-infection<br />
medicines<br />
0.31772209 0.0031772 si<br />
Anti-inflammatory and<br />
anti-rheumatic medicines<br />
0.39845406 0.0039845 si<br />
Medicines for Hypertension<br />
and high cholesterol<br />
0.11788027 0.0011788 si<br />
Hipotensor e hipocolesterínico 0.48693080 0.0048693 si<br />
Gastro-protectors 0.06372107 0.0006372 si<br />
Psychotropic drugs<br />
and anti-anorexics<br />
0.22868113 0.0022868 si<br />
Vitamins and invigorators 0.14387717 0.0014388 si<br />
Health Plan/Insurance 1.70000000 0.0170000 i<br />
Unimed 0.56666667 0.0056667 si<br />
PAS/UFMS 0.56666667 0.0056667 si<br />
PAX Mundial 0.56666667 0.0056667 si<br />
Dental Consultations and Treatment 0.30000000 0.0030000 i<br />
Extraction 0.15000000 0.0015000 si<br />
Amalgam Filling 0.15000000 0.0015000 si<br />
Medical Consultation 0.30000000 0.0030000 i<br />
<strong>Campo</strong> <strong>Grande</strong> <strong>Ecological</strong> <strong>Footprint</strong> 2012 p. 118
General Practitioner 0.07500000 0.0007500 si<br />
Orthopaedic specialist 0.07500000 0.0007500 si<br />
Paediatrician 0.07500000 0.0007500 si<br />
Ophthalmologist 0.07500000 0.0007500 si<br />
Surgical Services 0.10000000 0.0010000 i<br />
Hospital Admission 0.10000000 0.0010000 i<br />
Miscellaneous Examinations 0.20000000 0.0020000 i<br />
Laboratory Examination 0.185767213 0.0018577 si<br />
Radiography 0.014232787 0.0001423 si<br />
Treatment Material 0.30000000 0.0030000 i<br />
Dressing Material 0.30000000 0.0030000 si<br />
Education 2.00000000 0.0200000 g<br />
Regular Course 0.52631579 0.0052632 i<br />
Language Course 0.17487315 0.0017487 si<br />
IT Course 0.04961210 0.0004961 si<br />
University Entrance Preparatory<br />
Course<br />
0.30183054 0.0030183 si<br />
Higher Education Course 0.63157895 0.0063158 i<br />
Administration 0.30903757 0.0030904 si<br />
Law 0.16591456 0.0016591 si<br />
Mathematics 0.05421012 0.0005421 si<br />
Physiotherapy 0.08926318 0.0008926 si<br />
Medicine 0.01315351 0.0001315 si<br />
Other courses and activities 0.52631579 0.0052632 i<br />
Mandatory education (years 1 to 9) 0.24584549 0.0024585 si<br />
Higher Secondary education 0.21296566 0.0021297 si<br />
Infant education 0.06750465 0.0006750 si<br />
Study books and Technical Reviews 0.10526316 0.0010526 i<br />
Study books 0.10526316 0.0010526 si<br />
School articles 0.21052632 0.0021053 si<br />
School-related stationary and material 0.21052632 0.0021053 si<br />
Other current expenses 11.500000 0.1150000 g<br />
Federal Taxes 3.2856826 0.0328568 i<br />
IR (Individual Income Tax) 0.9063952 0.0090640 si<br />
IPI (Tax on Industrial products) 1.0196946 0.0101969 si<br />
PIS (Social Insurance paid by<br />
employers)<br />
0.2265988 0.0022660 si<br />
<strong>Campo</strong> <strong>Grande</strong> <strong>Ecological</strong> <strong>Footprint</strong> 2012 p. 119
Attachments<br />
COFINS (Corporate Social<br />
Contribution)<br />
0.3398982 0.0033990 si<br />
FUNRURAL(Tax) 0.1132994 0.0011330 si<br />
IOF (Tax) 0.6797964 0.0067980 si<br />
State Taxes 1.3595928 0.0135959 i<br />
ICMS (Tax) 0.9063952 0.0090640 si<br />
IPVA (Vehicle Tax) 0.4531976 0.0045320 si<br />
Municipal Taxes 0.5819974 0.0058200 i<br />
IPTU (Council Tax) 0.2420992 0.0024210 si<br />
ITBI 0.2265988 0.0022660 si<br />
ISS (Service provison tax) 0.1132994 0.0011330 si<br />
Labor Contributions 3.8333333 0.0383333 i<br />
INSS (Social Security) 1.7424242 0.0174242 si<br />
FGTS (Unemployment Conreibution) 1.7424242 0.0174242 si<br />
Union Taxes 0.3484848 0.0034848 si<br />
Bank Services 0.4646465 0.0046465 i<br />
Overdraft Interest Charges 0.1402706 0.0014027 si<br />
Credit Card Interest Charges 0.1402706 0.0014027 si<br />
Simple Money Transfer 0.0175338 0.0001753 si<br />
Delayed Money transfer 0.0263007 0.0002630 si<br />
Check Book charge 0.0526015 0.0005260 si<br />
Savings Account 0.0175338 0.0001753 si<br />
Returned Cheques 0.0263007 0.0002630 si<br />
Monthly Statement 0.0438346 0.0004383 si<br />
Pensions, monthly allowances and<br />
donations<br />
1.8585859 0.0185859 i<br />
Tythes 0.5310245 0.0053102 si<br />
Donation to philanthropic entity 0.2655123 0.0026551 si<br />
Alimony 1.0620491 0.0106205 si<br />
Private Social Security 0.1161616 0.0011616 i<br />
Investment Funds 0.1161616 0.0011616 si<br />
Assets and Liabilities 9.40000000 0.0940000 g<br />
Asset increase 6.30000000 0.0630000 i<br />
Property Purchase 4.10000000 0.0410000 si<br />
Property Refurbishing 2.20000000 0.0220000 si<br />
Debt Reduction 3.10000000 0.0310000 i<br />
Loans 2.70000000 0.0270000 si<br />
Mortgage 0.40000000 0.0040000 si<br />
<strong>Campo</strong> <strong>Grande</strong> <strong>Ecological</strong> <strong>Footprint</strong> 2012 p. 120
Harmonising data from the Brazilian Household Income<br />
Survey Data (POF is the Portuguese Acronym) with<br />
the standards adopted by the United Nations Statistics<br />
Division for the Classification <strong>of</strong> Individual Consumption<br />
According to Purpose - COICOP<br />
<strong>The</strong> <strong>Footprint</strong> Calculations based on constructing the Land Use and<br />
Consumption Matrix has made us <strong>of</strong> the United Nations Statistic<br />
Divisions scheme for classifying individual consumption according<br />
to purpose, the COICOP. To ensure full alignment <strong>of</strong> the Brazilian<br />
data with the international standard we have grouped the many<br />
items and sub-items according to the following table:<br />
POF IBGE 2008<br />
Clothing<br />
Menswear<br />
Menswear<br />
Children’s wear<br />
Cloth and haberdashery<br />
Footwear and gear<br />
Costume and real jewelry<br />
United Nations Statistics Division - COICOP<br />
- (Classification <strong>of</strong> Individual Consumption<br />
According to Purpose)<br />
Clothing and footwear<br />
Clothing<br />
Footwear<br />
Housing<br />
Rent<br />
Rent paid in money<br />
Non monitory rent<br />
Household maintenance<br />
Water Supply and Sewage<br />
Electricity<br />
Household gas<br />
Condominium<br />
Services and charges<br />
Fixed Phone<br />
Mobile Phone<br />
TV, Internet and Phone package<br />
Others<br />
Housing, water, electricity, gas and other fuels<br />
Actual rentals for housing<br />
Imputed rentals for housing<br />
Maintenance and repair <strong>of</strong> the dwelling<br />
Water supply and miscellaneous services relating<br />
to the dwelling<br />
Electricity, gas and other fuels<br />
Furnishings, household equipment and routine<br />
household maintenance<br />
<strong>Campo</strong> <strong>Grande</strong> <strong>Ecological</strong> <strong>Footprint</strong> 2012 p. 121
Attachments<br />
Household furnishings<br />
and objects<br />
Household appliances<br />
Repairs for household items<br />
Household Cleaning Materials<br />
Furniture and furnishings, carpets and other floor<br />
coverings<br />
Household textiles<br />
Glassware, tableware and household utensils<br />
Tools and equipment for house and garden<br />
Household appliances<br />
Goods and services for routine household<br />
maintenance<br />
Health Care<br />
Medicines<br />
Treatment Material<br />
Dental Consultation and treatment<br />
Medical Consultation<br />
Medical and outpatient treatment<br />
Miscellaneous Examinations<br />
Surgical services<br />
Hospital admission<br />
Health Scheme/Insurance<br />
Others<br />
Health<br />
Medical products, appliances and equipment<br />
Outpatient services<br />
Hospital services<br />
Transport<br />
Vehicle acquisition<br />
Petrol (gasoline) – own vehicle<br />
Alcohol – own vehicle<br />
Maintenance and accessories<br />
Others<br />
Urban<br />
Sporadic urban trips<br />
Transport<br />
Purchase <strong>of</strong> vehicles<br />
Operation <strong>of</strong> personal transport equipment<br />
Transport services<br />
Communication<br />
Postal services<br />
Telephone and telefax equipment<br />
Telephone and telefax services<br />
<strong>Campo</strong> <strong>Grande</strong> <strong>Ecological</strong> <strong>Footprint</strong> 2012 p. 122
Recreation and Culture<br />
Toys and games<br />
Recreation and Sports<br />
Others<br />
Non instructional periodicals<br />
books and magazines<br />
Mobile phone and accessories<br />
Recreation and culture<br />
Audio-visual, photographic and information<br />
processing equipment<br />
Other major durables for recreation and culture<br />
Other recreational items and equipment, gardens<br />
and pets<br />
Recreational and cultural services<br />
Newspapers, books and stationery<br />
Package holidays<br />
Education<br />
Regular Courses<br />
Other course and activities<br />
Higher Education courses<br />
Teaching books and technical<br />
reviews<br />
School supplies<br />
Others<br />
Education<br />
Pre-primary and primary education<br />
Secondary education<br />
Post-secondary non-tertiary education<br />
Tertiary education<br />
Education not definable by level<br />
Restaurants and hotels<br />
Catering services<br />
Accommodation services<br />
Miscellaneous goods and services<br />
Personal Services<br />
Hairdresser<br />
Manicure and Pedicure<br />
Repairs to personal possessions<br />
Others<br />
Hygiene and Personal care<br />
Perfume<br />
Hair products<br />
Toilet Soap<br />
Instruments and products for<br />
Personal use<br />
<strong>Campo</strong> <strong>Grande</strong> <strong>Ecological</strong> <strong>Footprint</strong> 2012 p. 123
Attachments<br />
Miscellaneous spending<br />
Betting and Gambling<br />
Communication<br />
Ceremonies and celebrations<br />
Pr<strong>of</strong>essional Services<br />
Properties used occasionally<br />
Others<br />
Other current expenses<br />
Taxes<br />
Labor Contributions<br />
Bank Services<br />
Pensions, monthly allowance,<br />
donations<br />
Private Social Insurance<br />
Others<br />
Asset Increase<br />
Imóvel (aquisição)<br />
Imóvel (reforma)<br />
Outros investimentos<br />
Debt reduction<br />
Loan<br />
Mortgage Installment<br />
Prostitution<br />
Personal effects n.e.c.<br />
Social protection<br />
Insurance<br />
Financial services n.e.c.<br />
Other services n.e.c.<br />
Individual consumption expenditure <strong>of</strong> non-pr<strong>of</strong>it<br />
institutions serving households (NPISHs)<br />
Housing<br />
Health<br />
Recreation and culture<br />
Education<br />
Social protection<br />
Other services<br />
Individual consumption expenditure <strong>of</strong> general<br />
government<br />
Housing<br />
Health<br />
Recreation and culture<br />
Education<br />
Social protection<br />
Tobacco<br />
Cereals, Legumes and oil plants<br />
Rice<br />
Beans<br />
Organics<br />
Others<br />
Meals, starches, pasta<br />
Macaroni<br />
Flour<br />
Manioc Meal<br />
Others<br />
Plant-Based food<br />
<strong>Campo</strong> <strong>Grande</strong> <strong>Ecological</strong> <strong>Footprint</strong> 2012 p. 124
Roots and Tubercles<br />
Potato<br />
Carrot<br />
Manioc (Cassava)<br />
Others<br />
Sugar and derivates<br />
Sugar and derivates<br />
Crystal Sugar<br />
Light and diet<br />
Others<br />
Greens and Vegetables<br />
Tomato<br />
Onion<br />
Lettuce<br />
Others<br />
Fruits<br />
Banana<br />
Orange<br />
Apple<br />
Other Fruits<br />
Fats and Oils<br />
Soy oil<br />
Olive Oil<br />
Others<br />
Plant-Based food<br />
Meats, visceral and Fish<br />
Top quality beef<br />
Beef<br />
Pork<br />
Industrialised meat and fish<br />
Fresh fish<br />
Others<br />
Eggs and Poultry<br />
Chicken<br />
Chicken eggs<br />
Organics<br />
Others<br />
Animal-Based food<br />
<strong>Campo</strong> <strong>Grande</strong> <strong>Ecological</strong> <strong>Footprint</strong> 2012 p. 125
Attachments<br />
Milk and Dairy Products<br />
Liquid Milk<br />
Powdered Milk<br />
Cheese<br />
Light and diet<br />
Organic<br />
Others<br />
Animal-Based food<br />
Bakery Products<br />
Bread Rolls<br />
Biscuits<br />
Light and diet<br />
Other baked items<br />
Other baked items<br />
Salt and condiments<br />
Tomato paste<br />
Mayonnaise<br />
Refined Salt<br />
Others<br />
Prepared Foods<br />
Other Foods<br />
Processed food<br />
Drinks and infusions<br />
Ground C<strong>of</strong>fee<br />
S<strong>of</strong>t Drinks<br />
Light & diet non-alcoholic drinks<br />
Others<br />
Beers and non pasteurized beer<br />
Other alcoholic drinks<br />
Beverages<br />
<strong>Campo</strong> <strong>Grande</strong> <strong>Ecological</strong> <strong>Footprint</strong> 2012 p. 126
ATTACHMENT D – LAND USE AND<br />
CONSUMPTION MATRIX (LUCM)<br />
According to the steps set out above<br />
For the purpose <strong>of</strong> sub-national <strong>Ecological</strong> <strong>Footprint</strong> calculation using <strong>Global</strong> <strong>Footprint</strong><br />
<strong>Network</strong> methodology economic tables are needed to establish the input-product (I-P)<br />
ratios identifying the flows <strong>of</strong> money and accordingly, <strong>of</strong> resources through the economy.<br />
CLUM Brasil<br />
[gha/cap]<br />
Agriculture<br />
CLUM Brasil<br />
Pastures<br />
Forest<br />
Resources<br />
Fishery<br />
resources<br />
Built Up<br />
Areas<br />
Energy<br />
& CO2<br />
absorption<br />
Food 0.48 0.62 0.07 0.11 0.01 0.05 1.34<br />
Food 0.40 0.52 0.05 0.09 0.01 0.04 1.11<br />
Vegetable Origin 0.40 0.00 0.00 0.00 0.00 0.00 0.40<br />
Animal Origin 0.00 0.52 0.00 0.09 0.00 0.00 0.60<br />
Non alcoholic beverages 0.03 0.04 0.01 0.01 0.00 0.00 0.09<br />
Alcoholic beverages 0.05 0.06 0.01 0.01 0.00 0.01 0.14<br />
Housing 0.01 0.01 0.05 0.00 0.01 0.08 0.15<br />
Effective Rent 0.00 0.00 0.01 0.00 0.00 0.00 0.02<br />
Imputed Rent 0.00 0.00 0.02 0.00 0.00 0.01 0.04<br />
Repairs and Maintenance 0.00 0.00 0.02 0.00 0.00 0.00 0.02<br />
Electricity, gas & other fuels 0.00 0.00 0.00 0.00 0.00 0.04 0.05<br />
Electricity 0.00 0.00 0.00 0.00 0.00 0.03 0.04<br />
Firewood 0.00 0.00 0.00 0.00 0.00 0.00 0.00<br />
Diesel, Kerosene, GLP, charcoal 0.00 0.00 0.00 0.00 0.00 0.00 0.00<br />
Total<br />
Household maintenance<br />
services<br />
0.00 0.00 0.00 0.00 0.00 0.01 0.01<br />
Air conditioning/heating (home) 0.01 0.01<br />
Mobility 0.02 0.02 0.03 0.00 0.01 0.10 0.19<br />
Vehicle purchase 0.00 0.00 0.01 0.00 0.00 0.01 0.03<br />
Personal vehicle operation 0.01 0.01 0.02 0.00 0.00 0.02 0.07<br />
Transport Services 0.01 0.01 0.01 0.00 0.00 0.04 0.07<br />
Transport (domestic) 0.02 0.02<br />
<strong>Campo</strong> <strong>Grande</strong> <strong>Ecological</strong> <strong>Footprint</strong> 2012 p. 127
Attachments<br />
[gha/cap]<br />
Agriculture<br />
CLUM Brasil<br />
Pastures<br />
Forest<br />
Resources<br />
Fishery<br />
resources<br />
Built Up<br />
Areas<br />
Energy<br />
& CO2<br />
absorption<br />
Goods 0.11 0.14 0.16 0.02 0.02 0.08 0.53<br />
Clothing 0.01 0.02 0.01 0.00 0.00 0.01 0.06<br />
Footwear 0.00 0.00 0.00 0.00 0.00 0.00 0.01<br />
Total<br />
Furniture, Upholstery,<br />
coverings<br />
0.00 0.00 0.03 0.00 0.00 0.00 0.04<br />
Textiles for the home 0.00 0.00 0.00 0.00 0.00 0.00 0.01<br />
Articles for the home 0.00 0.00 0.00 0.00 0.00 0.01 0.01<br />
Glass, crockery, domestic<br />
utensils<br />
House & garden tools &<br />
equipment<br />
Apparatus and equipment<br />
products<br />
Telephone and Fax<br />
equipment<br />
Audiovisual, photos and<br />
information<br />
Other lasting leisure and<br />
culture goods<br />
0.00 0.00 0.00 0.00 0.00 0.00 0.00<br />
0.00 0.00 0.00 0.00 0.00 0.00 0.01<br />
0.00 0.00 0.00 0.00 0.00 0.01 0.02<br />
0.00 0.00 0.00 0.00 0.00 0.00 0.00<br />
0.00 0.01 0.02 0.00 0.00 0.01 0.04<br />
0.00 0.00 0.00 0.00 0.00 0.00 0.01<br />
Other leisure equipment etc. 0.01 0.01 0.04 0.00 0.00 0.01 0.08<br />
Newspapers. books and<br />
stationary<br />
0.00 0.00 0.01 0.00 0.00 0.00 0.02<br />
Home maintenance goods 0.00 0.00 0.00 0.00 0.00 0.00 0.01<br />
Tobacco 0.06 0.08 0.02 0.01 0.00 0.01 0.18<br />
Other personal items 0.00 0.00 0.02 0.00 0.00 0.00 0.03<br />
Services 0.08 0.10 0.12 0.02 0.02 0.07 0.40<br />
Water Supply & other<br />
household services<br />
0.00 0.00 0.00 0.00 0.00 0.00 0.00<br />
Outpatient Services 0.00 0.00 0.00 0.00 0.00 0.00 0.01<br />
Hospital Services 0.00 0.00 0.04 0.00 0.00 0.00 0.05<br />
Postal Services 0.00 0.00 0.00 0.00 0.00 0.00 0.00<br />
Telephone and Telecopy 0.00 0.00 0.01 0.00 0.00 0.01 0.02<br />
Recreational and cultural<br />
Services<br />
0.01 0.01 0.01 0.00 0.00 0.01 0.03<br />
Holiday Package deals 0.00 0.00 0.00 0.00 0.00 0.00 0.00<br />
Education 0.00 0.00 0.02 0.00 0.00 0.01 0.03<br />
<strong>Campo</strong> <strong>Grande</strong> <strong>Ecological</strong> <strong>Footprint</strong> 2012 p. 128
[gha/cap]<br />
Agriculture<br />
CLUM Brasil<br />
Pastures<br />
Forest<br />
Resources<br />
Fishery<br />
resources<br />
Built Up<br />
Areas<br />
Energy<br />
& CO2<br />
absorption<br />
Restaurants 0.04 0.06 0.01 0.01 0.00 0.01 0.13<br />
Accommodation 0.01 0.01 0.00 0.00 0.00 0.00 0.02<br />
Personal Care 0.00 0.01 0.01 0.00 0.00 0.01 0.03<br />
Social Protection 0.00 0.00 0.01 0.00 0.00 0.01 0.03<br />
Insurance 0.00 0.00 0.01 0.00 0.00 0.01 0.02<br />
Financial Services 0.00 0.00 0.01 0.00 0.00 0.00 0.01<br />
Other Services 0.00 0.00 0.00 0.00 0.00 0.00 0.01<br />
Household Consumption 0.69 0.89 0.44 0.15 0.07 0.37 2.61<br />
Government 0.03 0.04 0.13 0.01 0.02 0.06 0.29<br />
Total (gha/capita) 0.72 0.93 0.57 0.16 0.10 0.43 2.91<br />
Total<br />
CLUM de <strong>Campo</strong> <strong>Grande</strong><br />
[gha/cap] Agriculture Pastures<br />
Forest Fishery<br />
Resources resources<br />
Built Up<br />
Areas<br />
Energy<br />
& CO2<br />
absorption<br />
Food 0.53 0.65 0.08 0.11 0.01 0.05 1.42<br />
Food 0.44 0.53 0.05 0.09 0.01 0.04 1.15<br />
Vegetable Origin 0.44 0.00 0.00 0.00 0.00 0.00 0.44<br />
Animal Origin 0.00 0.53 0.00 0.09 0.00 0.00 0.62<br />
Non alcoholic beverages 0.03 0.04 0.01 0.01 0.00 0.00 0.08<br />
Alcoholic Beverages 0.06 0.08 0.02 0.01 0.00 0.01 0.18<br />
Housing 0.01 0.01 0.05 0.00 0.01 0.14 0.23<br />
Effective Rent 0.00 0.00 0.01 0.00 0.00 0.00 0.01<br />
Imputed Rent 0.00 0.00 0.02 0.00 0.00 0.01 0.04<br />
Repairs and Maintenance 0.00 0.00 0.01 0.00 0.00 0.00 0.02<br />
Electricity, gas & other fuels 0.00 0.00 0.00 0.00 0.00 0.05 0.06<br />
Electricity 0.00 0.00 0.00 0.00 0.00 0.04 0.05<br />
Firewood 0.00 0.00 0.00 0.00 0.00 0.00 0.00<br />
Diesel, Kerosene, GLP, charcoal 0.00 0.00 0.00 0.00 0.00 0.00 0.00<br />
Household maintenance<br />
services<br />
0.00 0.00 0.00 0.00 0.00 0.02 0.02<br />
Air conditioning/heating (home) 0.00 0.00 0.00 0.00 0.00 0.02 0.02<br />
Mobility 0.02 0.02 0.03 0.00 0.01 0.09 0.17<br />
Vehicle purchase 0.00 0.00 0.01 0.00 0.00 0.02 0.04<br />
Personal vehicle operation 0.01 0.01 0.02 0.00 0.00 0.02 0.07<br />
Transport services 0.00 0.00 0.01 0.00 0.00 0.03 0.05<br />
Transport (domestic) 0.00 0.00 0.00 0.00 0.00 0.02 0.02<br />
Total<br />
<strong>Campo</strong> <strong>Grande</strong> <strong>Ecological</strong> <strong>Footprint</strong> 2012 p. 129
Attachments<br />
Goods 0.09 0.11 0.15 0.02 0.02 0.07 0.46<br />
Clothing 0.01 0.02 0.01 0.00 0.00 0.01 0.06<br />
Footwear 0.00 0.00 0.00 0.00 0.00 0.00 0.01<br />
Furniture, upholstery, coverings 0.00 0.00 0.03 0.00 0.00 0.00 0.04<br />
Textiles for home 0.00 0.00 0.00 0.00 0.00 0.00 0.01<br />
Articles for the home 0.00 0.00 0.00 0.00 0.00 0.01 0.01<br />
Glass crockery, domestic<br />
utensils<br />
0.00 0.00 0.00 0.00 0.00 0.00 0.00<br />
House & Garden tools and<br />
equipment<br />
0.00 0.00 0.00 0.00 0.00 0.00 0.01<br />
Apparatus, and equipment<br />
products<br />
0.00 0.00 0.01 0.00 0.00 0.01 0.02<br />
Telephone and Fax equipment 0.00 0.00 0.00 0.00 0.00 0.00 0.00<br />
Audiovisual, photo and<br />
information<br />
0.00 0.01 0.02 0.00 0.00 0.01 0.04<br />
Other lasting leisure and<br />
culture goods<br />
0.00 0.00 0.00 0.00 0.00 0.00 0.01<br />
Other leisure equipment etc. 0.01 0.01 0.04 0.00 0.00 0.01 0.08<br />
Newspapers, books and<br />
stationary<br />
0.00 0.00 0.00 0.00 0.00 0.00 0.01<br />
Home maintenance goods 0.00 0.00 0.00 0.00 0.00 0.00 0.01<br />
Tobacco 0.04 0.05 0.01 0.01 0.00 0.00 0.12<br />
Other personal items 0.00 0.00 0.02 0.00 0.00 0.00 0.03<br />
Services 0.14 0.18 0.12 0.03 0.03 0.08 0.57<br />
Water Supply & other<br />
household services<br />
0.00 0.00 0.00 0.00 0.00 0.00 0.00<br />
Outpatient services 0.00 0.00 0.00 0.00 0.00 0.00 0.01<br />
Hospital Services 0.00 0.00 0.02 0.00 0.00 0.00 0.02<br />
Postal services 0.00 0.00 0.00 0.00 0.00 0.00 0.00<br />
Telephone and Telecopy 0.00 0.00 0.01 0.00 0.00 0.01 0.02<br />
Recreational and cultural Services 0.00 0.01 0.01 0.00 0.00 0.00 0.02<br />
Holiday package deals 0.00 0.00 0.00 0.00 0.00 0.00 0.00<br />
Education 0.00 0.00 0.01 0.00 0.00 0.00 0.03<br />
Restaurants 0.11 0.14 0.03 0.02 0.01 0.02 0.33<br />
Accommodation 0.01 0.01 0.00 0.00 0.00 0.00 0.02<br />
Personal care 0.00 0.01 0.01 0.00 0.00 0.01 0.03<br />
Social Protection 0.00 0.00 0.01 0.00 0.00 0.01 0.03<br />
Insurance 0.00 0.00 0.01 0.00 0.00 0.01 0.02<br />
Financial Services 0.00 0.00 0.01 0.00 0.00 0.00 0.01<br />
Other Services 0.00 0.00 0.01 0.00 0.00 0.00 0.02<br />
Household consumption 0.78 0.97 0.43 0.17 0.08 0.43 2.85<br />
Government 0.03 0.04 0.13 0.01 0.02 0.06 0.29<br />
Total (gha/capita) 0.81 1.01 0.56 0.17 0.11 0.49 3.14<br />
<strong>Campo</strong> <strong>Grande</strong> <strong>Ecological</strong> <strong>Footprint</strong> 2012 p. 130
THE ECOLOGICAL FOOTPRINT<br />
OF CAMPO GRANDE<br />
OVERLOAD<br />
In the mid-1980s, humanity<br />
began consuming more<br />
than the planet naturally<br />
had to <strong>of</strong>fer and has been<br />
consuming above the<br />
necessary one-planet level<br />
ever since. Predictions for<br />
the year 2050 suggest that,<br />
if we carry on like this, we<br />
will need two planets to<br />
maintain our consumption<br />
patterns.<br />
BIOCAPACITY X<br />
CONSUMPTION<br />
Currently the world average for the<br />
<strong>Ecological</strong> <strong>Footprint</strong> is 2.7 global<br />
hectares per person while the available<br />
biocapacity for each human being<br />
is only 1.8 global hectares.<br />
A PEGADA ECOLÓGICA DE CAMPO GRANDE E A FAMÍLIA DE PEGADAS<br />
ECOLOGICAL FOOTPRINT<br />
<strong>The</strong> average <strong>Ecological</strong> <strong>Footprint</strong> <strong>of</strong> an inhabitant <strong>of</strong> <strong>Campo</strong><br />
<strong>Grande</strong> inhabitant is 3.14 global hectares. If everyone in the world<br />
were to consume as <strong>Campo</strong> <strong>Grande</strong> dwellers do, almost two planets<br />
would be needed to keep up their style <strong>of</strong> living. <strong>The</strong> Brazilian<br />
<strong>Ecological</strong> <strong>Footprint</strong> is 2.9 global hectares per person, showing<br />
that the Brazilian’s average consumption <strong>of</strong> ecological resources is<br />
close to the global <strong>Ecological</strong> <strong>Footprint</strong> value.<br />
MOBILISATION<br />
<strong>The</strong> footprint calculation<br />
is a tool to improve public<br />
administration, and mobilise<br />
the general public to review its<br />
consumer habits and choose<br />
more sustainable products,<br />
while at the same time<br />
establishing a dialogue with<br />
businessman, encouraging<br />
them to improve their<br />
production chains.<br />
Why we are here<br />
to halt environmental degradation on the Planet and construct<br />
a future where human beings live in harmony with Nature.<br />
www.wwf.org.br<br />
© 1986 WWF Panda Symbol<br />
® “WWF” is a registered trade mark <strong>of</strong> the WWF <strong>Network</strong><br />
WWF Brasil, SHIS EQ. QL 6/8 Conjunto “E” 71620-430, Brasília-DF — Tel. +55 61 3364-7400<br />
BR WWF.ORG