Assessment of a Rubidium ESFADOF Edge-Filter as ... - tuprints
Assessment of a Rubidium ESFADOF Edge-Filter as ... - tuprints
Assessment of a Rubidium ESFADOF Edge-Filter as ... - tuprints

You also want an ePaper? Increase the reach of your titles
YUMPU automatically turns print PDFs into web optimized ePapers that Google loves.
5.2 Vapor Cell I: 270 mT 97<br />
0.20<br />
5.5<br />
0.15<br />
165°C<br />
164°C<br />
163°C<br />
162°C<br />
FWHM / GHz<br />
5.0<br />
4.5<br />
4.0<br />
3.5<br />
Blue peak<br />
Red peak<br />
Transmission<br />
0.10<br />
161°C<br />
160°C<br />
159°C<br />
158°C<br />
157°C<br />
156°C<br />
155°C<br />
154°C<br />
3.0<br />
155 160 165<br />
Temperature / °C<br />
0.05<br />
166°C<br />
0.00<br />
-10 -5 0 5 10<br />
∆ν / GHz<br />
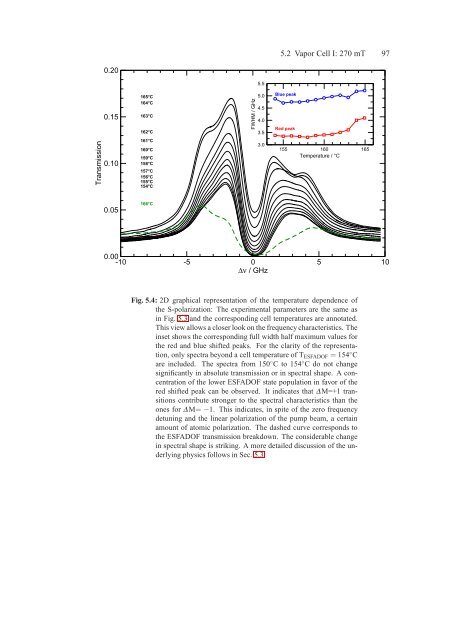
Fig. 5.4: 2D graphical representation <strong>of</strong> the temperature dependence <strong>of</strong><br />
the S-polarization: The experimental parameters are the same <strong>as</strong><br />
in Fig. 5.3 and the corresponding cell temperatures are annotated.<br />
This view allows a closer look on the frequency characteristics. The<br />
inset shows the corresponding full width half maximum values for<br />
the red and blue shifted peaks. For the clarity <strong>of</strong> the representation,<br />
only spectra beyond a cell temperature <strong>of</strong> T <strong>ESFADOF</strong> = 154 ◦ C<br />
are included. The spectra from 150 ◦ C to 154 ◦ C do not change<br />
significantly in absolute transmission or in spectral shape. A concentration<br />
<strong>of</strong> the lower <strong>ESFADOF</strong> state population in favor <strong>of</strong> the<br />
red shifted peak can be observed. It indicates that ∆M=+1 transitions<br />
contribute stronger to the spectral characteristics than the<br />
ones for ∆M= −1. This indicates, in spite <strong>of</strong> the zero frequency<br />
detuning and the linear polarization <strong>of</strong> the pump beam, a certain<br />
amount <strong>of</strong> atomic polarization. The d<strong>as</strong>hed curve corresponds to<br />
the <strong>ESFADOF</strong> transmission breakdown. The considerable change<br />
in spectral shape is striking. A more detailed discussion <strong>of</strong> the underlying<br />
physics follows in Sec. 5.3.