- Page 1 and 2:
INSTITUT FÜR ANGEWANDTE PHYSIK TEC
- Page 3:
Abstract Global and local climate c
- Page 7:
Pentru Alexandru şi Florina
- Page 10 and 11:
II Contents 4.3 Measurement Unit .
- Page 12 and 13:
2 1 Introduction wide sea currents
- Page 15 and 16:
2 Remote Sensing of the Water Colum
- Page 17 and 18:
2.1 Measurement Principle 7 highly
- Page 19 and 20:
2.1 Measurement Principle 9 Fry and
- Page 21 and 22:
2.2 System Requirements 11 operatin
- Page 23 and 24:
2.2 System Requirements 13
- Page 25 and 26:
2.2 System Requirements 15 Table 2.
- Page 27 and 28:
2.2 System Requirements 17 1. Rayle
- Page 29 and 30:
2.2 System Requirements 19 wave. Th
- Page 31 and 32:
2.2 System Requirements 21 cent pro
- Page 33 and 34:
2.2 System Requirements 23 Fig. 2.6
- Page 35 and 36:
2.2 System Requirements 25 Both the
- Page 37 and 38:
2.3 Ideal Edge-Filter 27 of the Bri
- Page 39:
2.3 Ideal Edge-Filter 29 respective
- Page 42 and 43:
32 3 (Excited State) Faraday Anomal
- Page 44 and 45:
34 3 (Excited State) Faraday Anomal
- Page 46 and 47:
36 3 (Excited State) Faraday Anomal
- Page 48 and 49:
38 3 (Excited State) Faraday Anomal
- Page 50 and 51:
40 3 (Excited State) Faraday Anomal
- Page 52 and 53:
42 3 (Excited State) Faraday Anomal
- Page 54 and 55:
44 3 (Excited State) Faraday Anomal
- Page 56 and 57:
46 3 (Excited State) Faraday Anomal
- Page 58 and 59:
48 3 (Excited State) Faraday Anomal
- Page 60 and 61:
50 3 (Excited State) Faraday Anomal
- Page 62 and 63:
52 3 (Excited State) Faraday Anomal
- Page 64 and 65:
54 3 (Excited State) Faraday Anomal
- Page 66 and 67:
56 3 (Excited State) Faraday Anomal
- Page 68 and 69:
58 3 (Excited State) Faraday Anomal
- Page 70 and 71:
60 4 Experimental Investigations of
- Page 72 and 73:
62 4 Experimental Investigations of
- Page 74 and 75:
64 4 Experimental Investigations of
- Page 76 and 77:
66 4 Experimental Investigations of
- Page 78 and 79: 68 4 Experimental Investigations of
- Page 80 and 81: 70 4 Experimental Investigations of
- Page 82 and 83: 72 4 Experimental Investigations of
- Page 84 and 85: 74 4 Experimental Investigations of
- Page 86 and 87: 76 4 Experimental Investigations of
- Page 88 and 89: 78 4 Experimental Investigations of
- Page 90 and 91: 80 4 Experimental Investigations of
- Page 92 and 93: 82 4 Experimental Investigations of
- Page 94 and 95: 84 4 Experimental Investigations of
- Page 96 and 97: 86 4 Experimental Investigations of
- Page 99 and 100: 5 Discussion of the Experimental Re
- Page 101 and 102: 5.1 Overview of the Experimental Pa
- Page 103 and 104: 5.1 Overview of the Experimental Pa
- Page 105 and 106: 5.2 Vapor Cell I: 270 mT 95 5.2 Vap
- Page 107 and 108: 5.2 Vapor Cell I: 270 mT 97 0.20 5.
- Page 109 and 110: 5.2 Vapor Cell I: 270 mT 99 Fig. 5.
- Page 111 and 112: 5.2 Vapor Cell I: 270 mT 101 introd
- Page 113 and 114: 5.2 Vapor Cell I: 270 mT 103 Fig. 5
- Page 115 and 116: 5.2 Vapor Cell I: 270 mT 105 which
- Page 117 and 118: 0.15 ∆ν P = 0.98(2) GHz 5.2 Vapo
- Page 119 and 120: 5.3 ESFADOF Operational Limits 109
- Page 121 and 122: 5.3 ESFADOF Operational Limits 111
- Page 123 and 124: cesses of the atomic vapor. This al
- Page 125 and 126: 5.3 ESFADOF Operational Limits 115
- Page 127: 5.3 ESFADOF Operational Limits 117
- Page 131 and 132: 5.3 ESFADOF Operational Limits 121
- Page 133 and 134: 5.3 ESFADOF Operational Limits 123
- Page 135 and 136: 5.3 ESFADOF Operational Limits 125
- Page 137 and 138: 5.3 ESFADOF Operational Limits 127
- Page 139 and 140: 5.3 ESFADOF Operational Limits 129
- Page 141 and 142: 5.3 ESFADOF Operational Limits 131
- Page 143 and 144: 5.4 Vapor Cell II: 500 mT 133 maxim
- Page 145 and 146: 5.4 Vapor Cell II: 500 mT 135 the P
- Page 147 and 148: 5.4 Vapor Cell II: 500 mT 137 such
- Page 149 and 150: 6 Conclusion and Outlook The presen
- Page 151 and 152: 6 Conclusion and Outlook 141 pulses
- Page 153 and 154: 6 Conclusion and Outlook 143
- Page 155: Appendix
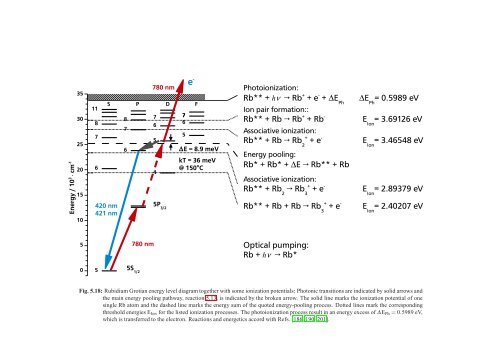
- Page 158 and 159: 148 A Rubidium Atom 2. Relevant ato
- Page 161 and 162: B Manufacturing process of Rb Vapor
- Page 163 and 164: B Manufacturing process of Rb Vapor
- Page 165 and 166: C Magnetic Field Strengths of the E
- Page 167: D Tripod ECDL Fig. D.1: Schematic o
- Page 170 and 171: 160 References [10] G.L. Mellor and
- Page 172 and 173: 162 References [41] E.S. Fry, J. Ka
- Page 174 and 175: 164 References [69] Claude C. Leroy
- Page 176 and 177: 166 References [97] L. Goldberg, D.
- Page 178 and 179:
168 References [125] Cord Fricke-Be
- Page 180 and 181:
170 References [158] Triad Technolo
- Page 182 and 183:
172 References [186] M. Cheret, L.
- Page 185:
Curriculum Vitae Alexandru Lucian P
- Page 188 and 189:
178 1 Publications Conference Proce
- Page 191:
Supervised Theses Denise Stang, Wei
- Page 194:
184 1 Danksagung Bei Herrn Arno Wei