Assessment of a Rubidium ESFADOF Edge-Filter as ... - tuprints
Assessment of a Rubidium ESFADOF Edge-Filter as ... - tuprints
Assessment of a Rubidium ESFADOF Edge-Filter as ... - tuprints

You also want an ePaper? Increase the reach of your titles
YUMPU automatically turns print PDFs into web optimized ePapers that Google loves.
114 5 Discussion <strong>of</strong> the Experimental Results<br />
0.25<br />
780 nm transmission<br />
0.20<br />
0.15<br />
0.10<br />
0.05<br />
<strong>ESFADOF</strong> Breakdown<br />
T <strong>ESFADOF</strong> = 165 °C - decre<strong>as</strong>ing P Pump<br />
T <strong>ESFADOF</strong> = 173 °C - decre<strong>as</strong>ing P Pump<br />
T <strong>ESFADOF</strong> = 173 °C - incre<strong>as</strong>ing P Pump<br />
0.00<br />
0 100 200 300 400 500<br />
P Pump<br />
/ mW<br />
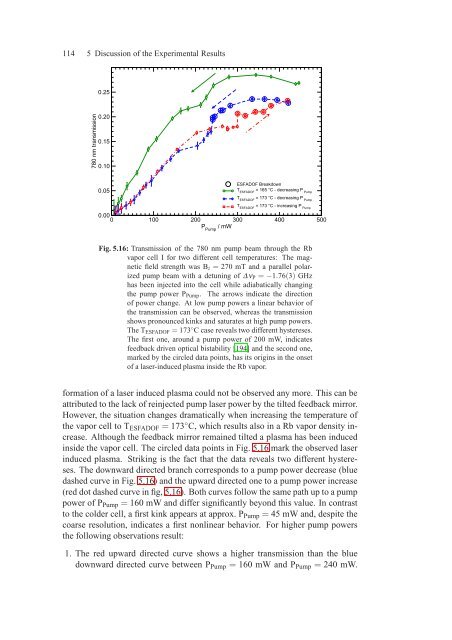
Fig. 5.16: Transmission <strong>of</strong> the 780 nm pump beam through the Rb<br />
vapor cell I for two different cell temperatures: The magnetic<br />
field strength w<strong>as</strong> B z = 270 mT and a parallel polarized<br />
pump beam with a detuning <strong>of</strong> ∆ν P = −1.76(3) GHz<br />
h<strong>as</strong> been injected into the cell while adiabatically changing<br />
the pump power P Pump . The arrows indicate the direction<br />
<strong>of</strong> power change. At low pump powers a linear behavior <strong>of</strong><br />
the transmission can be observed, where<strong>as</strong> the transmission<br />
shows pronounced kinks and saturates at high pump powers.<br />
The T <strong>ESFADOF</strong> = 173 ◦ C c<strong>as</strong>e reveals two different hystereses.<br />
The first one, around a pump power <strong>of</strong> 200 mW, indicates<br />
feedback driven optical bistability [194] and the second one,<br />
marked by the circled data points, h<strong>as</strong> its origins in the onset<br />
<strong>of</strong> a l<strong>as</strong>er-induced pl<strong>as</strong>ma inside the Rb vapor.<br />
formation <strong>of</strong> a l<strong>as</strong>er induced pl<strong>as</strong>ma could not be observed any more. This can be<br />
attributed to the lack <strong>of</strong> reinjected pump l<strong>as</strong>er power by the tilted feedback mirror.<br />
However, the situation changes dramatically when incre<strong>as</strong>ing the temperature <strong>of</strong><br />
the vapor cell to T <strong>ESFADOF</strong> = 173 ◦ C, which results also in a Rb vapor density incre<strong>as</strong>e.<br />
Although the feedback mirror remained tilted a pl<strong>as</strong>ma h<strong>as</strong> been induced<br />
inside the vapor cell. The circled data points in Fig. 5.16 mark the observed l<strong>as</strong>er<br />
induced pl<strong>as</strong>ma. Striking is the fact that the data reveals two different hystereses.<br />
The downward directed branch corresponds to a pump power decre<strong>as</strong>e (blue<br />
d<strong>as</strong>hed curve in Fig. 5.16) and the upward directed one to a pump power incre<strong>as</strong>e<br />
(red dot d<strong>as</strong>hed curve in fig, 5.16). Both curves follow the same path up to a pump<br />
power <strong>of</strong> P Pump = 160 mW and differ significantly beyond this value. In contr<strong>as</strong>t<br />
to the colder cell, a first kink appears at approx. P Pump = 45 mW and, despite the<br />
coarse resolution, indicates a first nonlinear behavior. For higher pump powers<br />
the following observations result:<br />
1. The red upward directed curve shows a higher transmission than the blue<br />
downward directed curve between P Pump = 160 mW and P Pump = 240 mW.