Assessment of a Rubidium ESFADOF Edge-Filter as ... - tuprints
Assessment of a Rubidium ESFADOF Edge-Filter as ... - tuprints
Assessment of a Rubidium ESFADOF Edge-Filter as ... - tuprints

You also want an ePaper? Increase the reach of your titles
YUMPU automatically turns print PDFs into web optimized ePapers that Google loves.
4.4 Data Acquisition and Evaluation 85<br />
Inserting Eqs. 4.11 and 4.12 into Eq. 4.13 results in<br />
√<br />
∣ ∣ ∣<br />
∆T S,P = ∣∆ ˜T S,P 2 ∣∣∣ ∆κ<br />
2<br />
+ T S,P κ ∣ , (4.14)<br />
which allows an estimation <strong>of</strong> the maximum observed transmission error:<br />
1. P-Polarized spectra: The fact, that T P ≤ 1 and ∆κ<br />
κ<br />
≤ ∆ ˜T P results in the following<br />
upper limit for the error <strong>of</strong> the absolute P-polarized transmission:<br />
√ ∣∣ ∣<br />
∆T P ≤ ∆ ˜T P 2 ∣ ∣<br />
+ ∆ ˜T P 2<br />
≤ √ 2 max(∆ ˜T P ). (4.15)<br />
2. S-Polarized spectra: As T S ≪ 1, it is more accurate to insert the maximum<br />
achieved transmission, max(T S ), while keeping ∆κ<br />
κ<br />
≤ ∆ ˜T P . Thus, the following<br />
upper limit for the error <strong>of</strong> the absolute S-polarized transmission results:<br />
∆T S ≤<br />
√ ∣∣<br />
∆ ˜T S<br />
∣ ∣<br />
2 +<br />
∣ ∣max(TS ) max(∆ ˜T P ) ∣ ∣ 2 . (4.16)<br />
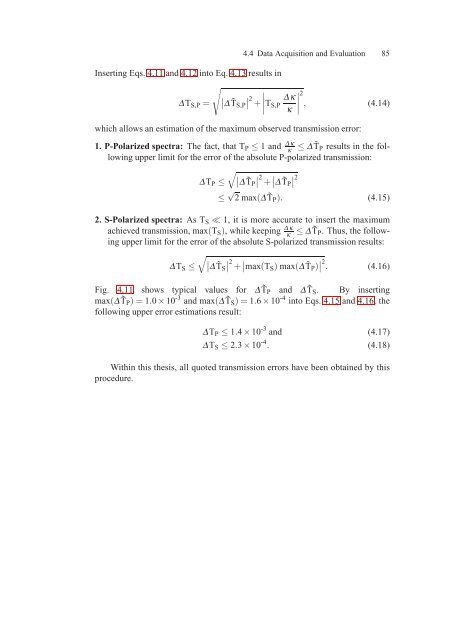
Fig. 4.11 shows typical values for ∆ ˜T P and ∆ ˜T S . By inserting<br />
max(∆ ˜T P ) = 1.0 × 10 -3 and max(∆ ˜T S ) = 1.6 × 10 -4 into Eqs. 4.15 and 4.16, the<br />
following upper error estimations result:<br />
∆T P ≤ 1.4 × 10 -3 and (4.17)<br />
∆T S ≤ 2.3 × 10 -4 . (4.18)<br />
Within this thesis, all quoted transmission errors have been obtained by this<br />
procedure.