Assessment of a Rubidium ESFADOF Edge-Filter as ... - tuprints
Assessment of a Rubidium ESFADOF Edge-Filter as ... - tuprints
Assessment of a Rubidium ESFADOF Edge-Filter as ... - tuprints

Create successful ePaper yourself
Turn your PDF publications into a flip-book with our unique Google optimized e-Paper software.
136 5 Discussion <strong>of</strong> the Experimental Results<br />
0.06<br />
0.05<br />
~<br />
T(∆ν)<br />
∆ν S<br />
= -75 MHz<br />
Transmission<br />
0.04<br />
0.03<br />
0.02<br />
0.01<br />
0.00<br />
2×10 -5<br />
1×10 -5<br />
∂ ∆ν<br />
~ T(∆ν)<br />
∂ ∆ν<br />
~ T(-(∆ν-2∆νS ))<br />
MHz -1<br />
-1×10 -5 0<br />
-2×10 -5<br />
1×10 -5<br />
∂ ∆ν<br />
~ T(∆ν) - ∂∆ν<br />
~ T(-(∆ν-2∆νS ))<br />
5×10 -6<br />
MHz -1<br />
-5×10 -6 0<br />
-1×10 -5<br />
-7.875 GHz -6.875 GHz +6.725 GHz +7.725 GHz<br />
-15 -10 -5 0 5 10 15<br />
∆ν / GHz<br />
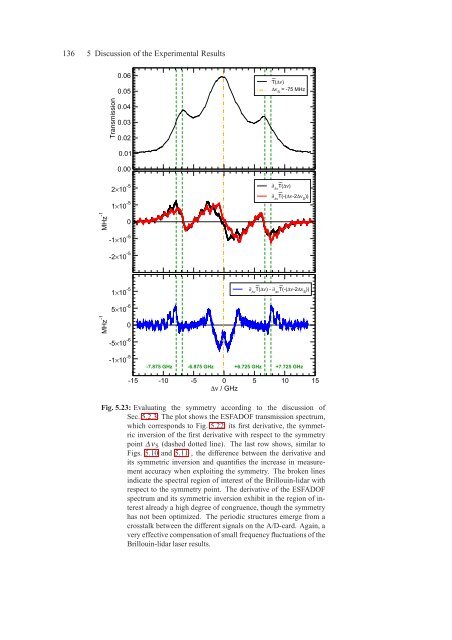
Fig. 5.23: Evaluating the symmetry according to the discussion <strong>of</strong><br />
Sec. 5.2.3: The plot shows the <strong>ESFADOF</strong> transmission spectrum,<br />
which corresponds to Fig. 5.22, its first derivative, the symmetric<br />
inversion <strong>of</strong> the first derivative with respect to the symmetry<br />
point ∆ν S (d<strong>as</strong>hed dotted line). The l<strong>as</strong>t row shows, similar to<br />
Figs. 5.10 and 5.11 , the difference between the derivative and<br />
its symmetric inversion and quantifies the incre<strong>as</strong>e in me<strong>as</strong>urement<br />
accuracy when exploiting the symmetry. The broken lines<br />
indicate the spectral region <strong>of</strong> interest <strong>of</strong> the Brillouin-lidar with<br />
respect to the symmetry point. The derivative <strong>of</strong> the <strong>ESFADOF</strong><br />
spectrum and its symmetric inversion exhibit in the region <strong>of</strong> interest<br />
already a high degree <strong>of</strong> congruence, though the symmetry<br />
h<strong>as</strong> not been optimized. The periodic structures emerge from a<br />
crosstalk between the different signals on the A/D-card. Again, a<br />
very effective compensation <strong>of</strong> small frequency fluctuations <strong>of</strong> the<br />
Brillouin-lidar l<strong>as</strong>er results.