Do labor market institutions matter for business cycles?∗ - European ...
Do labor market institutions matter for business cycles?∗ - European ...
Do labor market institutions matter for business cycles?∗ - European ...

You also want an ePaper? Increase the reach of your titles
YUMPU automatically turns print PDFs into web optimized ePapers that Google loves.
8 TABLES AND FIGURES 25<br />
0.2<br />
correlation output and<br />
employment<br />
0.1<br />
0<br />
-0.1<br />
-0.2<br />
-0.3<br />
-0.4<br />
-0.5<br />
-0.6<br />
sf1 sf2 sf3 sf4 RR ef2 ef3 ef4<br />
growth rates HP data BP data<br />
0.8<br />
0.6<br />
0.4<br />
0.2<br />
0<br />
-0.2<br />
-0.4<br />
correlation wages and <strong>labor</strong><br />
productivity<br />
sf1 sf2 sf3 sf4 RR ef2 ef3 ef4<br />
-0.6<br />
correlation output and <strong>labor</strong><br />
productivity<br />
-0.8<br />
growth rates HP data BP data<br />
0.3<br />
0.2<br />
correlation employment and<br />
<strong>labor</strong> productivity<br />
0.1<br />
0<br />
-0.1<br />
-0.2<br />
sf1 sf2 sf3 sf4 RR ef2 ef3 ef4<br />
growth rates HP data BP data<br />
0<br />
-0.1<br />
-0.2<br />
-0.3<br />
-0.4<br />
-0.5<br />
sf1 sf2 sf3 sf4 RR ef2 ef3 ef4<br />
correlation output and<br />
inflation<br />
-0.6<br />
growth rates HP data BP data<br />
0.6<br />
0.4<br />
0.2<br />
0<br />
-0.2<br />
-0.4<br />
-0.6<br />
-0.8<br />
sf1 sf2 sf3 sf4 RR ef2 ef3 ef4<br />
growth rates HP data BP data<br />
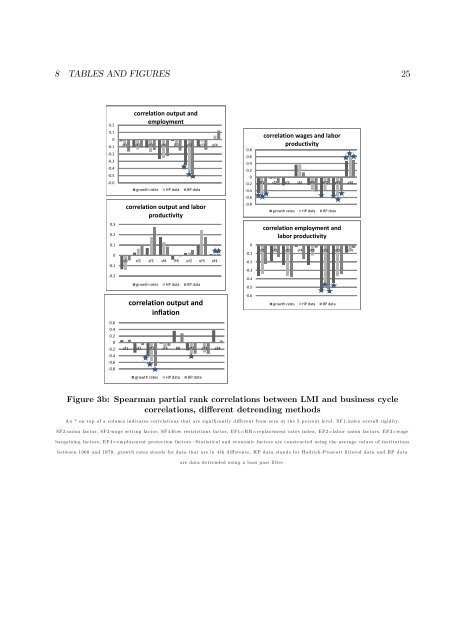
Figure 3b: Spearman partial rank correlations between LMI and <strong>business</strong> cycle<br />
correlations, different detrending methods<br />
A n * on top of a colu m n ind icates correlation s that are sign ifi cantly d iff erent from zero at th e 5 p ercent level. S F 1:ind ex overall rigid ity,<br />
SF 2:un ion factor, SF 3:wage settin g factor, S F 4:fl ow restriction s factor, E F 1= R R = rep lacem ent rates in dex, E F 2= lab or u nion factors, E F 3= wage<br />
bargain in g factors, E F 4= em p loym ent protection factors. Statistical and econ om ic factors are con stru cted u sin g the average valu es of in stitution s<br />
b etween 1960 an d 1970. grow th rates stand s <strong>for</strong> d ata that are in 4th diff eren ce, H P d ata stan d s <strong>for</strong> H o drick -P rescott fi ltered d ata and B P d ata<br />
are d ata d etrend ed u sin g a b ass p ass fi lter.