Do labor market institutions matter for business cycles?∗ - European ...
Do labor market institutions matter for business cycles?∗ - European ...
Do labor market institutions matter for business cycles?∗ - European ...

You also want an ePaper? Increase the reach of your titles
YUMPU automatically turns print PDFs into web optimized ePapers that Google loves.
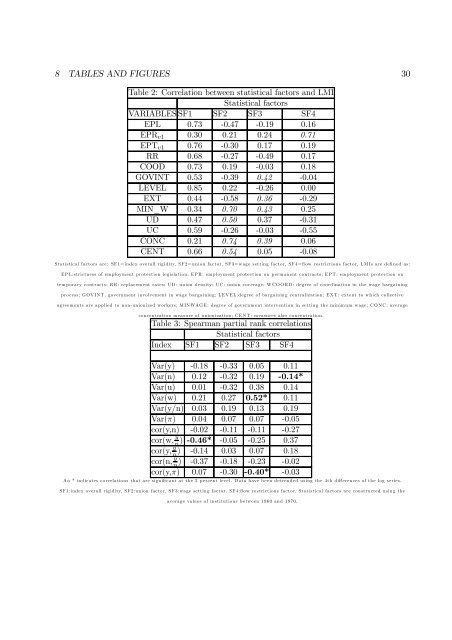
8 TABLES AND FIGURES 30<br />
Table 2: Correlation between statistical factors and LMI<br />
Statistical factors<br />
VARIABLES SF1 SF2 SF3 SF4<br />
EPL 0.73 -0.47 -0.19 0.16<br />
EPR v1 0.30 0.21 0.24 0.71<br />
EPT v1 0.76 -0.30 0.17 0.19<br />
RR 0.68 -0.27 -0.49 0.17<br />
COOD 0.73 0.19 -0.03 0.18<br />
GOVINT 0.53 -0.39 0.42 -0.04<br />
LEVEL 0.85 0.22 -0.26 0.00<br />
EXT 0.44 -0.58 0.36 -0.29<br />
MIN_W 0.34 0.70 0.43 0.25<br />
UD 0.47 0.50 0.37 -0.31<br />
UC 0.59 -0.26 -0.03 -0.55<br />
CONC 0.21 0.74 0.39 0.06<br />
CENT 0.66 0.54 0.05 -0.08<br />
S tatistical factors are: SF 1= in dex overall rigid ity, S F 2= u nion factor, S F 3= wage settin g factor, SF 4= fl ow restriction s factor, L M Is are defi ned as:<br />
E P L:strictness of em p loym ent p rotection legislation; EP R : em p loym ent p rotection on p erm anent contracts; E P T : em p loym ent p rotection on<br />
tem p orary contracts; R R : rep lacem ent rates; U D : un ion d en sity; U C : un ion coverage; W C O O R D : d egree of co ord ination in th e wage b argaining<br />
p ro cess; G OV IN T , govern m ent involvem ent in wage b argaining; L EV E L:d egree of bargain in g centralization; EX T : extent to w h ich collective<br />
agreem ents are applied to n on -un ionized workers; M IN WAG E : d egree of govern m ent intervention in settin g th e m in im u m wage; C O N C : average<br />
concentration m easu re of u nion ization ; C E N T : m easu res also con centration.<br />
Table 3: Spearman partial rank correlations<br />
Statistical factors<br />
Index SF1 SF2 SF3 SF4<br />
Var(y) -0.18 -0.33 0.05 0.11<br />
Var(n) 0.12 -0.32 0.19 -0.14*<br />
Var(u) 0.01 -0.32 0.38 0.14<br />
Var(w) 0.21 0.27 0.52* 0.11<br />
Var(y/n) 0.03 0.19 0.13 0.19<br />
Var(π) 0.04 0.07 0.07 -0.05<br />
cor(y,n) -0.02 -0.11 -0.11 -0.27<br />
cor(w, y n<br />
) -0.46* -0.05 -0.25 0.37<br />
cor(y, y n<br />
) -0.14 0.03 0.07 0.18<br />
cor(n, y n<br />
) -0.37 -0.18 -0.23 -0.02<br />
cor(y,π) 0.07 -0.30 -0.40* -0.03<br />
A n * in d icates correlations that are sign ifi cant at th e 5 p ercent level. D ata h ave b een d etren ded u sing th e 4th diff eren ces of th e log series.<br />
S F 1:ind ex overall rigid ity, S F 2:u nion factor, S F 3:wage settin g factor, SF 4:fl ow restriction s factor, Statistical factors are con stru cted u sin g the<br />
average valu es of in stitution s b etween 1960 an d 1970.