Download PDF (English, 923.84 KB) - IPIECA
Download PDF (English, 923.84 KB) - IPIECA
Download PDF (English, 923.84 KB) - IPIECA

You also want an ePaper? Increase the reach of your titles
YUMPU automatically turns print PDFs into web optimized ePapers that Google loves.
Climate Change and Energy to 2020 and onwards<br />
Energy and emissions outlook<br />
Efforts to reconcile society’s growing demand for energy while promoting efforts to<br />
mitigate the risk of climate change pose a fundamental challenge.<br />
World energy demand is predicted by the International Energy Agency (IEA) to grow<br />
by more than 50 per cent in the next 25 years, with coal use rising more than any<br />
other form of primary energy in absolute terms. In this projection, oil supply and<br />
demand remain tight in the next decade, with a projected gap opening up in supply<br />
and demand of 12.5 million barrels per day by 2015. And China and India are<br />
likely to account for more than 40 per cent of that increased demand, and more than<br />
60 per cent of the increase in carbon dioxide emissions to 2030. The likely scale of<br />
technology deployment needed to manage or reduce these emissions is massive.<br />
In the IEA’s Baseline scenario 1 energy outlook, global CO 2<br />
emissions will increase<br />
from 27 Gt CO 2<br />
in 2005 to 42 Gt CO 2<br />
by 2030. In contrast, in the IEA’s BLUE Map<br />
scenario, emissions fall to 23 Gt CO 2<br />
by 2030. The IEA estimates its BLUE Map<br />
scenario is on a path towards CO 2<br />
stabilization at 450 ppm (parts per million) CO 2<br />
and would lower the risk that the global temperature increase would exceed a 2˚ C<br />
rise. In order to satisfy energy demand whilst limiting GHG emissions under this<br />
scenario, massive amounts of low-carbon generation capacity would need to be<br />
added every year through to 2030 (see Figure 1).<br />
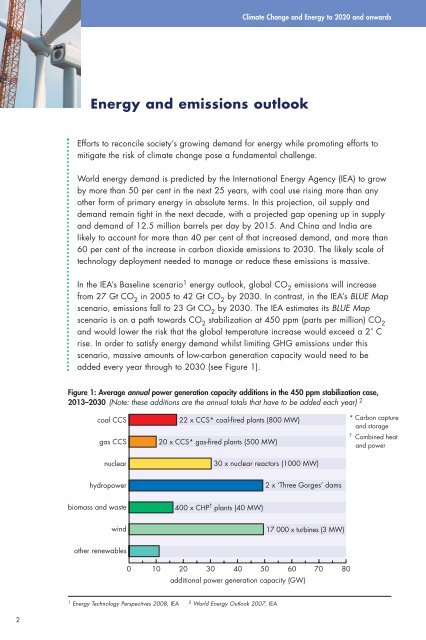
Figure 1: Average annual power generation capacity additions in the 450 ppm stabilization case,<br />
2013–2030 (Note: these additions are the annual totals that have to be added each year) 2<br />
coal CCS<br />
gas CCS<br />
nuclear<br />
22 x CCS* coal-fired plants (800 MW)<br />
20 x CCS* gas-fired plants (500 MW)<br />
30 x nuclear reactors (1000 MW)<br />
* Carbon capture<br />
and storage<br />
† Combined heat<br />
and power<br />
hydropower<br />
2 x ‘Three Gorges’ dams<br />
biomass and waste<br />
400 x CHP † plants (40 MW)<br />
wind<br />
17 000 x turbines (3 MW)<br />
other renewables<br />
0<br />
10 20 30 40 50 60<br />
additional power generation capacity (GW)<br />
70 80<br />
1 Energy Technology Perspectives 2008, IEA 2 World Energy Outlook 2007, IEA<br />
2