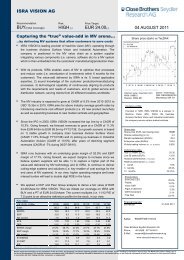
ISRA VISION Buy EUR 26.00 - ISRA VISION AG
ISRA VISION Buy EUR 26.00 - ISRA VISION AG
ISRA VISION Buy EUR 26.00 - ISRA VISION AG

You also want an ePaper? Increase the reach of your titles
YUMPU automatically turns print PDFs into web optimized ePapers that Google loves.
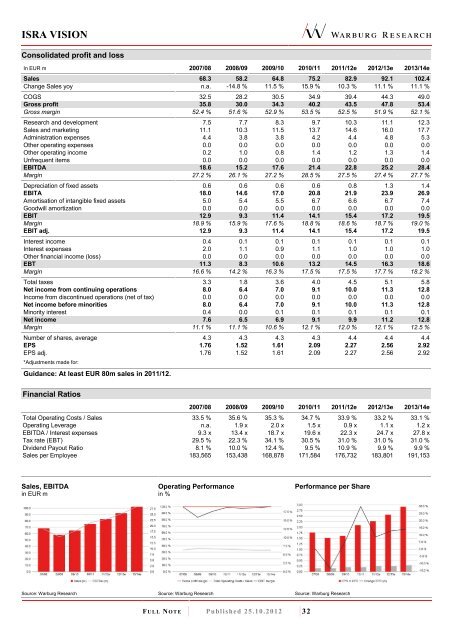
<strong>ISRA</strong> <strong>VISION</strong><br />
Consolidated profit and loss<br />
In <strong>EUR</strong> m 2007/08 2008/09 2009/10 2010/11 2011/12e 2012/13e 2013/14e<br />
Sales 68.3 58.2 64.8 75.2 82.9 92.1 102.4<br />
Change Sales yoy n.a. -14.8 % 11.5 % 15.9 % 10.3 % 11.1 % 11.1 %<br />
COGS 32.5 28.2 30.5 34.9 39.4 44.3 49.0<br />
Gross profit 35.8 30.0 34.3 40.2 43.5 47.8 53.4<br />
Gross margin 52.4 % 51.6 % 52.9 % 53.5 % 52.5 % 51.9 % 52.1 %<br />
Research and development 7.5 7.7 8.3 9.7 10.3 11.1 12.3<br />
Sales and marketing 11.1 10.3 11.5 13.7 14.6 16.0 17.7<br />
Administration expenses 4.4 3.8 3.8 4.2 4.4 4.8 5.3<br />
Other operating expenses 0.0 0.0 0.0 0.0 0.0 0.0 0.0<br />
Other operating income 0.2 1.0 0.8 1.4 1.2 1.3 1.4<br />
Unfrequent items 0.0 0.0 0.0 0.0 0.0 0.0 0.0<br />
EBITDA 18.6 15.2 17.6 21.4 22.8 25.2 28.4<br />
Margin 27.2 % 26.1 % 27.2 % 28.5 % 27.5 % 27.4 % 27.7 %<br />
Depreciation of fixed assets 0.6 0.6 0.6 0.6 0.8 1.3 1.4<br />
EBITA 18.0 14.6 17.0 20.8 21.9 23.9 26.9<br />
Amortisation of intangible fixed assets 5.0 5.4 5.5 6.7 6.6 6.7 7.4<br />
Goodwill amortization 0.0 0.0 0.0 0.0 0.0 0.0 0.0<br />
EBIT 12.9 9.3 11.4 14.1 15.4 17.2 19.5<br />
Margin 18.9 % 15.9 % 17.6 % 18.8 % 18.6 % 18.7 % 19.0 %<br />
EBIT adj. 12.9 9.3 11.4 14.1 15.4 17.2 19.5<br />
Interest income 0.4 0.1 0.1 0.1 0.1 0.1 0.1<br />
Interest expenses 2.0 1.1 0.9 1.1 1.0 1.0 1.0<br />
Other financial income (loss) 0.0 0.0 0.0 0.0 0.0 0.0 0.0<br />
EBT 11.3 8.3 10.6 13.2 14.5 16.3 18.6<br />
Margin 16.6 % 14.2 % 16.3 % 17.5 % 17.5 % 17.7 % 18.2 %<br />
Total taxes 3.3 1.8 3.6 4.0 4.5 5.1 5.8<br />
Net income from continuing operations 8.0 6.4 7.0 9.1 10.0 11.3 12.8<br />
Income from discontinued operations (net of tax) 0.0 0.0 0.0 0.0 0.0 0.0 0.0<br />
Net income before minorities 8.0 6.4 7.0 9.1 10.0 11.3 12.8<br />
Minority interest 0.4 0.0 0.1 0.1 0.1 0.1 0.1<br />
Net income 7.6 6.5 6.9 9.1 9.9 11.2 12.8<br />
Margin 11.1 % 11.1 % 10.6 % 12.1 % 12.0 % 12.1 % 12.5 %<br />
Number of shares, average 4.3 4.3 4.3 4.3 4.4 4.4 4.4<br />
EPS 1.76 1.52 1.61 2.09 2.27 2.56 2.92<br />
EPS adj. 1.76 1.52 1.61 2.09 2.27 2.56 2.92<br />
*Adjustments made for:<br />
Guidance: At least <strong>EUR</strong> 80m sales in 2011/12.<br />
Financial Ratios<br />
2007/08 2008/09 2009/10 2010/11 2011/12e 2012/13e 2013/14e<br />
Total Operating Costs / Sales 33.5 % 35.6 % 35.3 % 34.7 % 33.9 % 33.2 % 33.1 %<br />
Operating Leverage n.a. 1.9 x 2.0 x 1.5 x 0.9 x 1.1 x 1.2 x<br />
EBITDA / Interest expenses 9.3 x 13.4 x 18.7 x 19.6 x 22.3 x 24.7 x 27.8 x<br />
Tax rate (EBT) 29.5 % 22.3 % 34.1 % 30.5 % 31.0 % 31.0 % 31.0 %<br />
Dividend Payout Ratio 8.1 % 10.0 % 12.4 % 9.5 % 10.9 % 9.9 % 9.9 %<br />
Sales per Employee 183,565 153,438 168,878 171,584 176,732 183,801 191,153<br />
Sales, EBITDA<br />
in <strong>EUR</strong> m<br />
Operating Performance<br />
in %<br />
Performance per Share<br />
Source: Warburg Research<br />
Source: Warburg Research<br />
Source: Warburg Research<br />
F U L L N O T E Published 25.10.2012 32