LEGO Development Process - Iva
LEGO Development Process - Iva
LEGO Development Process - Iva

Create successful ePaper yourself
Turn your PDF publications into a flip-book with our unique Google optimized e-Paper software.
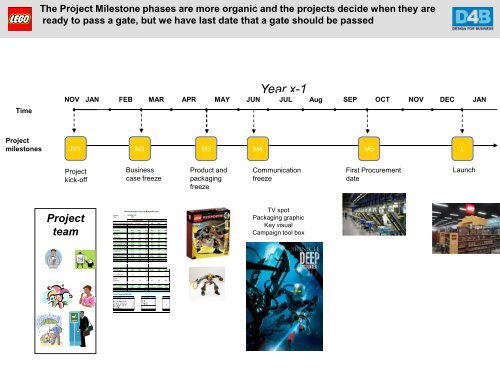
The Project Milestone phases are more organic and the projects decide when they are<br />
ready to pass a gate, but we have last date that a gate should be passed<br />
Year 2007 TOTAL<br />
2007 Novelties - for subsequent years<br />
Product<br />
Amounts stated in Mill DKK Novelties Carry Over Total 2008 2009+ Life<br />
Consumer Sales 376,4 105,6 482,0 188,2 87,8 652,4<br />
Gross Sales 451,7 126,7 578,4 150,5 50,2 652,4<br />
- CTT and Cash Discounts (50,2) (14,2) (64,4) -16,7 -5,6 -72,5<br />
Net sales 401,5 112,5 514,0 133,8 44,6 579,9<br />
- FMC Costs (134,2) (41,7) (175,9) -44,7 -14,9 -193,9<br />
- Kirkby royalty (14,1) (3,9) (18,0) -4,7 -1,6 -20,3<br />
Group Contribution 1 (GC1) 253,2 66,9 320,1 84,4 28,1 365,7<br />
- Full Distribution Costs (27,0) (8,7) (35,7) -9,1 -3,0 -39,1<br />
Group Contribution 2 (GC2) 226,2 58,2 284,4 75,3 25,1 326,6<br />
- Direct Marketing costs (27,6) (1,0) (28,6) xxx xxx -27,6<br />
Group Contribution 3 (GC3) 198,6 57,2 255,8 75,3 25,1 299,0<br />
(41,7) (11,7) (53,4) -13,9 -4,6 -60,2<br />
Group Contribution 5 (GC5) 157,0 45,5 202,4 61,4 20,5 238,8<br />
- Project Costs (11,1) (11,1) -11,1<br />
- Cost of capital employed (4,0) (1,2) (5,2) -1,29 -0,4 -5,7<br />
Earnings Before Allocations (EBA)141,9 44,3 186,1 60,1 20,0 222,0<br />
EBA % of Net Sales 35,3% 39,3% 36,2% 44,9% 44,9% 38,3%<br />
NIP / FMC Factor 3,36 3,04 3,29 3,36 3,36 3,36<br />
Operating Profit 1119,1 316,7 1435,4 417,0 139,3 1674,6<br />
Calculated ROS % 248% 250% 248% 277% 278% 257%<br />
Project Investments 0,7 0,7 0,7<br />
Capital employed 30,4 9,4 39,8 10,1 3,4 43,9<br />
Capital<br />
Return on Invested Capital (GC8)1115,1 315,5 1430,2 415,7 138,9 1668,9<br />
Calculated ROIC % 3588% 3344% 3530% < Launch year - Project life > 3744%<br />
ROI Factor (GC 5/Total outgoings) 13,3 17,1 20,2<br />
Project costs Total Investments Total Grand Total<br />
2,2 0,6<br />
0,8 0,0<br />
2,6 0,1<br />
4,6<br />
0,9<br />
Total project costs 11,1 Total invest. 0,7 11,8<br />
Time<br />
NOV<br />
Year x-1<br />
JAN FEB MAR APR MAY JUN JUL Aug SEP OCT NOV DEC JAN<br />
Project<br />
milestones<br />
M1<br />
M2<br />
M3<br />
M4<br />
M5<br />
L<br />
Project<br />
kick-off<br />
Business<br />
case freeze<br />
Product and<br />
packaging<br />
freeze<br />
Communication<br />
freeze<br />
First Procurement<br />
date<br />
Launch<br />
Project<br />
team<br />
Novelty Project Financial Business Case<br />
Project . . . . . . . . . . . . . RACERS . . . . . . . . 2007 . . . . . . . . . . . .<br />
Year . . . . . . . . . . . . . . . . . . . . 2007 . . . . . . .<br />
TV spot<br />
Packaging graphic<br />
Key visual<br />
Campaign tool box<br />
Employed 31,1 9,4 40,5 10,1 3,4 44,6<br />
Project Outgoings (Mill DKK)