

Rahul Dewan - Jacobs University
Rahul Dewan - Jacobs University
Rahul Dewan - Jacobs University

Create successful ePaper yourself
Turn your PDF publications into a flip-book with our unique Google optimized e-Paper software.
6. SIMPLER AND FASTER METHOD FOR PERIODIC TEXTURES - USING RIGOROUS<br />
COUPLED WAVE ANALYSIS<br />
mA/cm 2<br />
(a)<br />
(b)<br />
(c)<br />
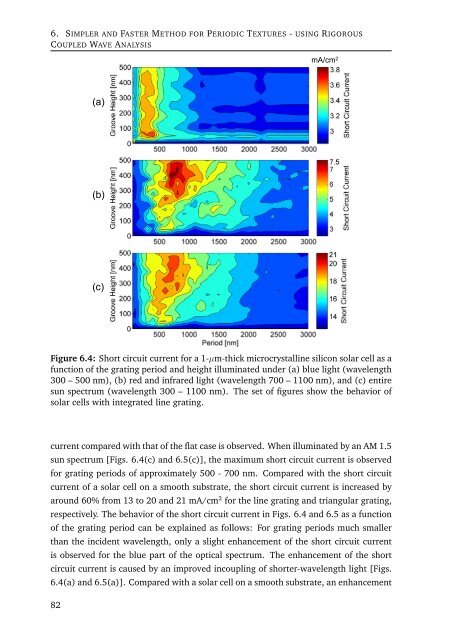
Figure 6.4: Short circuit current for a 1-µm-thick microcrystalline silicon solar cell as a<br />
function of the grating period and height illuminated under (a) blue light (wavelength<br />
300 – 500 nm), (b) red and infrared light (wavelength 700 – 1100 nm), and (c) entire<br />
sun spectrum (wavelength 300 – 1100 nm). The set of figures show the behavior of<br />
solar cells with integrated line grating.<br />
current compared with that of the flat case is observed. When illuminated by an AM 1.5<br />
sun spectrum [Figs. 6.4(c) and 6.5(c)], the maximum short circuit current is observed<br />
for grating periods of approximately 500 - 700 nm. Compared with the short circuit<br />
current of a solar cell on a smooth substrate, the short circuit current is increased by<br />
around 60% from 13 to 20 and 21 mA/cm 2 for the line grating and triangular grating,<br />
respectively. The behavior of the short circuit current in Figs. 6.4 and 6.5 as a function<br />
of the grating period can be explained as follows: For grating periods much smaller<br />
than the incident wavelength, only a slight enhancement of the short circuit current<br />
is observed for the blue part of the optical spectrum. The enhancement of the short<br />
circuit current is caused by an improved incoupling of shorter-wavelength light [Figs.<br />
6.4(a) and 6.5(a)]. Compared with a solar cell on a smooth substrate, an enhancement<br />
82


