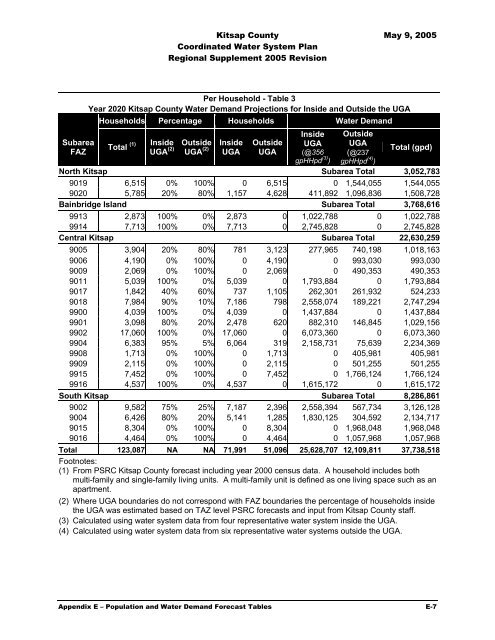
<strong>Kitsap</strong> <strong>County</strong> May 9, 2005 <strong>Coordinated</strong> <strong>Water</strong> <strong>System</strong> <strong>Plan</strong> Regional Supplement 2005 Revision Subarea FAZ Per Household - Table 3 Year 2020 <strong>Kitsap</strong> <strong>County</strong> <strong>Water</strong> Demand Projections for Inside and Outside the UGA Households Percentage Households <strong>Water</strong> Demand Total (1) Inside UGA (2) Outside UGA (2) Inside UGA Outside UGA Inside UGA (@356 gpHHpd (3) ) Outside UGA (@237 gpHHpd (4) ) Total (gpd) North <strong>Kitsap</strong> Subarea Total 3,052,783 9019 6,515 0% 100% 0 6,515 0 1,544,055 1,544,055 9020 5,785 20% 80% 1,157 4,628 411,892 1,096,836 1,508,728 Bainbridge Island Subarea Total 3,768,616 9913 2,873 100% 0% 2,873 0 1,022,788 0 1,022,788 9914 7,713 100% 0% 7,713 0 2,745,828 0 2,745,828 Central <strong>Kitsap</strong> Subarea Total 22,630,259 9005 3,904 20% 80% 781 3,123 277,965 740,198 1,018,163 9006 4,190 0% 100% 0 4,190 0 993,030 993,030 9009 2,069 0% 100% 0 2,069 0 490,353 490,353 9011 5,039 100% 0% 5,039 0 1,793,884 0 1,793,884 9017 1,842 40% 60% 737 1,105 262,301 261,932 524,233 9018 7,984 90% 10% 7,186 798 2,558,074 189,221 2,747,294 9900 4,039 100% 0% 4,039 0 1,437,884 0 1,437,884 9901 3,098 80% 20% 2,478 620 882,310 146,845 1,029,156 9902 17,060 100% 0% 17,060 0 6,073,360 0 6,073,360 9904 6,383 95% 5% 6,064 319 2,158,731 75,639 2,234,369 9908 1,713 0% 100% 0 1,713 0 405,981 405,981 9909 2,115 0% 100% 0 2,115 0 501,255 501,255 9915 7,452 0% 100% 0 7,452 0 1,766,124 1,766,124 9916 4,537 100% 0% 4,537 0 1,615,172 0 1,615,172 South <strong>Kitsap</strong> Subarea Total 8,286,861 9002 9,582 75% 25% 7,187 2,396 2,558,394 567,734 3,126,128 9004 6,426 80% 20% 5,141 1,285 1,830,125 304,592 2,134,717 9015 8,304 0% 100% 0 8,304 0 1,968,048 1,968,048 9016 4,464 0% 100% 0 4,464 0 1,057,968 1,057,968 Total 123,087 NA NA 71,991 51,096 25,628,707 12,109,811 37,738,518 Footnotes: (1) From PSRC <strong>Kitsap</strong> <strong>County</strong> forecast including year 2000 census data. A household includes both multi-family and single-family living units. A multi-family unit is defined as one living space such as an apartment. (2) Where UGA boundaries do not correspond with FAZ boundaries the percentage of households inside the UGA was estimated based on TAZ level PSRC forecasts and input from <strong>Kitsap</strong> <strong>County</strong> staff. (3) Calculated using water system data from four representative water system inside the UGA. (4) Calculated using water system data from six representative water systems outside the UGA. Appendix E – Population and <strong>Water</strong> Demand Forecast Tables E-7
<strong>Kitsap</strong> <strong>County</strong> May 9, 2005 <strong>Coordinated</strong> <strong>Water</strong> <strong>System</strong> <strong>Plan</strong> Regional Supplement 2005 Revision Per Household - Table 4 Year 2030 <strong>Kitsap</strong> <strong>County</strong> <strong>Water</strong> Demand Projections for Inside and Outside the UGA Subarea FAZ Households Percentage Households <strong>Water</strong> Demand Total (1) Inside UGA (2) Outside UGA (2) Inside UGA Outside UGA Inside UGA (@356 gpHHpd (3) ) Outside UGA (@237 gpHHpd (4) ) Total (gpd) North <strong>Kitsap</strong> Subarea Total 3,358,931 9019 7,382 0% 100% 0 7,382 0 1,749,534 1,749,534 9020 6,171 20% 80% 1,234 4,937 439,375 1,170,022 1,609,397 Bainbridge Island Subarea Total 4,146,688 9913 3,077 100% 0% 3,077 0 1,095,412 0 1,095,412 9914 8,571 100% 0% 8,571 0 3,051,276 0 3,051,276 Central <strong>Kitsap</strong> Subarea Total 25,943,298 9005 5,226 20% 80% 1,045 4,181 372,091 990,850 1,362,941 9006 4,759 0% 100% 0 4,759 0 1,127,883 1,127,883 9009 2,269 0% 100% 0 2,269 0 537,753 537,753 9011 6,061 100% 0% 6,061 0 2,157,716 0 2,157,716 9017 2,018 40% 60% 807 1,211 287,363 286,960 574,323 9018 8,635 90% 10% 7,772 864 2,766,654 204,650 2,971,304 9900 4,536 100% 0% 4,536 0 1,614,816 0 1,614,816 9901 3,347 80% 20% 2,678 669 953,226 158,648 1,111,873 9902 20,615 100% 0% 20,615 0 7,338,940 0 7,338,940 9904 7,102 95% 5% 6,747 355 2,401,896 84,159 2,486,055 9908 1,765 0% 100% 0 1,765 0 418,305 418,305 9909 2,473 0% 100% 0 2,473 0 586,101 586,101 9915 8,192 0% 100% 0 8,192 0 1,941,504 1,941,504 9916 4,814 100% 0% 4,814 0 1,713,784 0 1,713,784 South <strong>Kitsap</strong> Subarea Total 9,110,388 9002 9,960 75% 25% 7,470 2,490 2,659,320 590,130 3,249,450 9004 7,286 80% 20% 5,829 1,457 2,075,053 345,356 2,420,409 9015 9,663 0% 100% 0 9,663 0 2,290,131 2,290,131 9016 4,854 0% 100% 0 4,854 0 1,150,398 1,150,398 Total 138,776 NA NA 81,255 57,521 28,926,922 13,632,382 42,559,305 Footnotes: (1) From PSRC <strong>Kitsap</strong> <strong>County</strong> forecast including year 2000 census data. A household includes both multi-family and single-family living units. A multi-family unit is defined as one living space such as an apartment. (2) Where UGA boundaries do not correspond with FAZ boundaries the percentage of households inside the UGA was estimated based on TAZ level PSRC forecasts and input from <strong>Kitsap</strong> <strong>County</strong> staff. (3) Calculated using water system data from four representative water system inside the UGA. (4) Calculated using water system data from six representative water systems outside the UGA. Appendix E – Population and <strong>Water</strong> Demand Forecast Tables E-8
- Page 1 and 2:
Kitsap County Coordinated Water Sys
- Page 5 and 6:
Kitsap County May 9, 2005 Coordinat
- Page 7 and 8:
Kitsap County May 9, 2005 Coordinat
- Page 9 and 10:
Kitsap County May 9, 2005 Coordinat
- Page 11 and 12:
List of Tables Kitsap County May 9,
- Page 13 and 14:
Kitsap County May 9, 2005 Coordinat
- Page 15 and 16:
Kitsap County May 9, 2005 Coordinat
- Page 17 and 18:
Kitsap County May 9, 2005 Coordinat
- Page 19 and 20:
Section 1 Summary 1.1 Introduction
- Page 21 and 22:
Kitsap County May 9, 2005 Coordinat
- Page 23 and 24:
Kitsap County May 9, 2005 Coordinat
- Page 25 and 26:
Kitsap County May 9, 2005 Coordinat
- Page 27 and 28:
Kitsap County May 9, 2005 Coordinat
- Page 29 and 30:
Section 2 Kitsap County May 9, 2005
- Page 31 and 32:
2.3 1992 CWSP Preparation Kitsap Co
- Page 33 and 34:
Kitsap County May 9, 2005 Coordinat
- Page 35 and 36:
Kitsap County May 9, 2005 Coordinat
- Page 37 and 38:
Kitsap County May 9, 2005 Coordinat
- Page 39 and 40:
Kitsap County May 9, 2005 Coordinat
- Page 41 and 42:
Section 3. SUPPLY Kitsap County May
- Page 43 and 44:
Kitsap County May 9, 2005 Coordinat
- Page 45 and 46:
Ordinance No. 134 Page Two Kitsap C
- Page 47 and 48:
Page Four Kitsap County May 9, 2005
- Page 49 and 50:
Kitsap County May 9, 2005 Coordinat
- Page 51 and 52:
Kitsap County May 9, 2005 Coordinat
- Page 53 and 54:
Kitsap County May 9, 2005 Coordinat
- Page 55 and 56:
Kitsap County May 9, 2005 Coordinat
- Page 57 and 58:
Kitsap County May 9, 2005 Coordinat
- Page 59 and 60:
Kitsap County May 9, 2005 Coordinat
- Page 61 and 62:
Kitsap County May 9, 2005 Coordinat
- Page 63 and 64:
Kitsap County May 9, 2005 Coordinat
- Page 65 and 66:
Kitsap County May 9, 2005 Coordinat
- Page 67 and 68:
Kitsap County May 9, 2005 Coordinat
- Page 69 and 70:
Kitsap County May 9, 2005 Coordinat
- Page 71 and 72:
Kitsap County May 9, 2005 Coordinat
- Page 73 and 74:
Kitsap County May 9, 2005 Coordinat
- Page 75 and 76:
Kitsap County May 9, 2005 Coordinat
- Page 77 and 78:
Kitsap County May 9, 2005 Coordinat
- Page 79 and 80:
Kitsap County May 9, 2005 Coordinat
- Page 81 and 82:
Section 4 Kitsap County May 9, 2005
- Page 83 and 84:
Kitsap County May 9, 2005 Coordinat
- Page 85 and 86:
Kitsap County May 9, 2005 Coordinat
- Page 87 and 88:
Kitsap County May 9, 2005 Coordinat
- Page 89 and 90:
Kitsap County May 9, 2005 Coordinat
- Page 91 and 92:
Section 5 Kitsap County May 9, 2005
- Page 93 and 94:
Kitsap County May 9, 2005 Coordinat
- Page 95 and 96:
Kitsap County May 9, 2005 Coordinat
- Page 97 and 98:
Kitsap County May 9, 2005 Coordinat
- Page 99 and 100:
Kitsap County May 9, 2005 Coordinat
- Page 101 and 102:
Kitsap County May 9, 2005 Coordinat
- Page 103 and 104:
Kitsap County May 9, 2005 Coordinat
- Page 105 and 106:
Kitsap County May 9, 2005 Coordinat
- Page 107 and 108:
Kitsap County May 9, 2005 Coordinat
- Page 109 and 110:
Kitsap County May 9, 2005 Coordinat
- Page 111 and 112:
Kitsap County May 9, 2005 Coordinat
- Page 113 and 114:
Kitsap County May 9, 2005 Coordinat
- Page 115 and 116:
Kitsap County May 9, 2005 Coordinat
- Page 117 and 118:
Kitsap County May 9, 2005 Coordinat
- Page 119 and 120:
Kitsap County May 9, 2005 Coordinat
- Page 121 and 122:
Kitsap County May 9, 2005 Coordinat
- Page 123 and 124:
8.3 Water Rights 8.3.1 Types of Wat
- Page 125 and 126:
Kitsap County May 9, 2005 Coordinat
- Page 127 and 128:
Kitsap County May 9, 2005 Coordinat
- Page 129 and 130:
Kitsap County May 9, 2005 Coordinat
- Page 131 and 132:
Kitsap County May 9, 2005 Coordinat
- Page 133 and 134:
Kitsap County May 9, 2005 Coordinat
- Page 135 and 136:
Kitsap County May 9, 2005 Coordinat
- Page 137 and 138:
Kitsap County May 9, 2005 Coordinat
- Page 139 and 140:
Kitsap County May 9, 2005 Coordinat
- Page 141 and 142:
Kitsap County May 9, 2005 Coordinat
- Page 143 and 144: Kitsap County May 9, 2005 Coordinat
- Page 145 and 146: Kitsap County May 9, 2005 Coordinat
- Page 147 and 148: Kitsap County May 9, 2005 Coordinat
- Page 149 and 150: Kitsap County May 9, 2005 Coordinat
- Page 151 and 152: Kitsap County May 9, 2005 Coordinat
- Page 153 and 154: Kitsap County May 9, 2005 Coordinat
- Page 155 and 156: Kitsap County May 9, 2005 Coordinat
- Page 157 and 158: Kitsap County May 9, 2005 Coordinat
- Page 159 and 160: Kitsap County May 9, 2005 Coordinat
- Page 161 and 162: 10.9 Environmental Document Kitsap
- Page 163 and 164: Kitsap County May 9, 2005 Coordinat
- Page 165 and 166: Kitsap County May 9, 2005 Coordinat
- Page 167 and 168: WAC 197-11-960 Environmental checkl
- Page 169 and 170: Kitsap County May 9, 2005 Coordinat
- Page 171 and 172: Kitsap County May 9, 2005 Coordinat
- Page 173 and 174: Kitsap County May 9, 2005 Coordinat
- Page 175 and 176: Kitsap County May 9, 2005 Coordinat
- Page 177 and 178: Kitsap County May 9, 2005 Coordinat
- Page 179 and 180: Kitsap County May 9, 2005 Coordinat
- Page 181 and 182: Kitsap County May 9, 2005 Coordinat
- Page 183 and 184: Kitsap County May 9, 2005 Coordinat
- Page 185 and 186: System Name Kitsap County May 9, 20
- Page 187 and 188: Kitsap County May 9, 2005 Coordinat
- Page 189 and 190: Kitsap County May 9, 2005 Coordinat
- Page 191 and 192: Kitsap County May 9, 2005 Coordinat
- Page 193: Kitsap County May 9, 2005 Coordinat
- Page 197 and 198: Kitsap County May 9, 2005 Coordinat
- Page 199 and 200: Kitsap County May 9, 2005 Coordinat
- Page 201 and 202: Kitsap County May 9, 2005 Coordinat
- Page 203 and 204: Kitsap County May 9, 2005 Coordinat
- Page 205 and 206: Kitsap County May 9, 2005 Coordinat
- Page 207 and 208: Kitsap County May 9, 2005 Coordinat
- Page 209 and 210: Kitsap County May 9, 2005 Coordinat
- Page 211 and 212: Kitsap County May 9, 2005 Coordinat
- Page 213 and 214: Kitsap County May 9, 2005 Coordinat
- Page 215 and 216: Kitsap County May 9, 2005 Coordinat
- Page 217 and 218: Kitsap County May 9, 2005 Coordinat
- Page 219 and 220: Kitsap County May 9, 2005 Coordinat
- Page 221 and 222: Kitsap County May 9, 2005 Coordinat
- Page 223 and 224: Kitsap County May 9, 2005 Coordinat
- Page 225 and 226: Kitsap County May 9, 2005 Coordinat
- Page 227 and 228: Kitsap County May 9, 2005 Coordinat
- Page 229 and 230: Kitsap County May 9, 2005 Coordinat
- Page 231 and 232: Kitsap County May 9, 2005 Coordinat
- Page 233 and 234: Kitsap County May 9, 2005 Coordinat
- Page 235 and 236: Kitsap County May 9, 2005 Coordinat
- Page 237 and 238: Kitsap County May 9, 2005 Coordinat
- Page 239 and 240: Kitsap County May 9, 2005 Coordinat
- Page 241 and 242: Kitsap County May 9, 2005 Coordinat
- Page 243 and 244: Kitsap County May 9, 2005 Coordinat
- Page 245 and 246:
Kitsap County May 9, 2005 Coordinat
- Page 247 and 248:
Kitsap County May 9, 2005 Coordinat
- Page 249 and 250:
Kitsap County May 9, 2005 Coordinat
- Page 251 and 252:
Kitsap County May 9, 2005 Coordinat
- Page 253 and 254:
Kitsap County May 9, 2005 Coordinat
- Page 255 and 256:
Kitsap County May 9, 2005 Coordinat
- Page 257 and 258:
Kitsap County May 9, 2005 Coordinat
- Page 259 and 260:
Kitsap County May 9, 2005 Coordinat
- Page 261 and 262:
Kitsap County May 9, 2005 Coordinat
- Page 263 and 264:
Kitsap County May 9, 2005 Coordinat
- Page 265 and 266:
Kitsap County May 9, 2005 Coordinat
- Page 267 and 268:
Kitsap County May 9, 2005 Coordinat
- Page 269 and 270:
Kitsap County May 9, 2005 Coordinat
- Page 271 and 272:
Kitsap County May 9, 2004 Coordinat
- Page 273 and 274:
Kitsap County May 9, 2004 Coordinat
- Page 275 and 276:
Kitsap County May 9, 2005 Coordinat
- Page 277 and 278:
Kitsap County May 9, 2005 Coordinat
- Page 279 and 280:
Kitsap County May 9, 2005 Coordinat
- Page 281 and 282:
Kitsap County May 9, 2005 Coordinat
- Page 283 and 284:
Kitsap County May 9, 2005 Coordinat
- Page 285 and 286:
Kitsap County May 9, 2005 Coordinat
- Page 287 and 288:
Kitsap County May 9, 2005 Coordinat
- Page 289 and 290:
Kitsap County May 9, 2005 Coordinat
- Page 291 and 292:
Kitsap County May 9, 2005 Coordinat
- Page 293 and 294:
Kitsap County May 9, 2005 Coordinat
- Page 295 and 296:
Kitsap County May 9, 2005 Coordinat
- Page 297 and 298:
Kitsap County May 9, 2005 Coordinat
- Page 299 and 300:
Kitsap County May 9, 2005 Coordinat
- Page 301 and 302:
Kitsap County May 9, 2005 Coordinat
- Page 303 and 304:
Kitsap County May 9, 2005 Coordinat
- Page 305 and 306:
Kitsap County May 9, 2005 Coordinat
- Page 307 and 308:
Appendix L Kitsap County May 9, 200
- Page 309 and 310:
Stream Number** Stream Name Gage Nu
- Page 311 and 312:
#279 Blackjack Creek and tributarie
- Page 313:
#342 Unnamed Stream and tributaries