CR, CRI, CRN, CRE, CRIE, CRNE - Grundfos Canada
CR, CRI, CRN, CRE, CRIE, CRNE - Grundfos Canada
CR, CRI, CRN, CRE, CRIE, CRNE - Grundfos Canada

Create successful ePaper yourself
Turn your PDF publications into a flip-book with our unique Google optimized e-Paper software.
Selection and sizing<br />
<strong>CR</strong>, <strong>CR</strong>I, <strong>CR</strong>N, <strong>CR</strong>E, <strong>CR</strong>IE, <strong>CR</strong>NE<br />
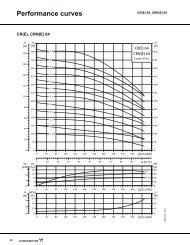
How to read the curve charts<br />
Number of stages.<br />
First figure: number of<br />
stages;<br />
second figure: number of<br />
reduced-diameter impellers.<br />
The eff curve shows the<br />
efficiency of the pump.<br />
The eff curve is an average<br />
curve of all the pump types<br />
shown in the chart.<br />
The efficiency of pumps<br />
with reduced-diameter<br />
impellers is approx. 2 %<br />
lower than the eff curve<br />
shown in the chart.<br />
H<br />
[m]<br />
300<br />
280<br />
260<br />
240<br />
220<br />
200<br />
180<br />
160<br />
140<br />
120<br />
100<br />
80<br />
60<br />
40<br />
20<br />
0<br />
H<br />
[ft]<br />
1000<br />
950<br />
900<br />
850<br />
800<br />
750<br />
700<br />
650<br />
600<br />
550<br />
500<br />
450<br />
400<br />
350<br />
300<br />
250<br />
200<br />
150<br />
100<br />
50<br />
-11-2<br />
-10<br />
-10-2<br />
-9<br />
-9-2<br />
-8<br />
-8-2<br />
-7<br />
-7-2<br />
-6<br />
-6-2<br />
-5<br />
-5-2<br />
-4<br />
-4-2<br />
-3<br />
-3-2<br />
-2<br />
-2-1<br />
-2-2<br />
-1<br />
-1-1<br />
<strong>CR</strong>(E) 32<br />
<strong>CR</strong>N(E) 3 2<br />
2-pole, 60 Hz<br />
0<br />
0<br />
0 20 40 60 80 100 120 140 160 180 200 Q [US GPM]<br />
P2<br />
0 5 10 15 20 25 30 35 40 45<br />
P2<br />
Q [m3/h ]<br />
Eff<br />
[kW ] [hp]<br />
[%]<br />
4<br />
Eff<br />
P2 1/1 80<br />
2<br />
3<br />
P2 2/3<br />
60<br />
2<br />
40 The NPSHR curve is an<br />
1<br />
1<br />
20 average curve for all the<br />
0 0<br />
0 variants shown. When<br />
0 20 40 60 80 100 120 140 160 180 200 Q [US GPM] sizing the pumps, add a<br />
H NPSH<br />
H safety margin of at<br />
[m] [ft]<br />
[ft]<br />
30<br />
30 least 2.0 feet.<br />
8<br />
20<br />
20<br />
4<br />
10<br />
NPSHR<br />
10<br />
0 0<br />
0<br />
H<br />
[ft]<br />
1000<br />
950<br />
900<br />
850<br />
800<br />
750<br />
700<br />
500<br />
450<br />
400<br />
350<br />
300<br />
250<br />
200<br />
150<br />
Pump type, number<br />
of poles and frequency.<br />
QH curve for the individual<br />
650<br />
pump. The bold curves<br />
600<br />
indicate the recommended<br />
550 performance range for<br />
best efficiency.<br />
The power curves indicate<br />
100<br />
pump input power per stage.<br />
50<br />
Curves are shown for<br />
complete (1/1) and for<br />
reduced-diameter (2/3)<br />
impellers.<br />
TM02 0039 1303<br />
Fig. 27 How to read the curve charts<br />
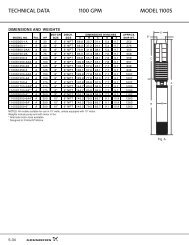
Guidelines to performance curves<br />
The guidelines below apply to the curves shown on the<br />
following pages:<br />
1. The motors used for the measurements are standard<br />
motors (ODP, TEFC or MLE).<br />
2. Measurements have been made with airless water<br />
at a temperature of 68 °F.<br />
3. The curves apply to a kinematic viscosity of<br />
= 1 mm 2 /s (1 cSt).<br />
4. Due to the risk of overheating, the pumps should not<br />
be used at a flow below the minimum flow rate.<br />
5. The QH curves apply to actual speed with the motor<br />
types mentioned at 60 Hz.<br />
The curve below shows the minimum flow rate as a<br />
percentage of the nominal flow rate in relation to the<br />
liquid temperature. The dotted line shows a <strong>CR</strong> pump<br />
fitted with an air-cooled top assembly.<br />
Qmin<br />
[%]<br />
30<br />
20<br />
10<br />
0<br />
104 140 176 212 248 284 320 356<br />
40 60 80 100 120 140 160 180 t [°F]<br />
40 60 80 100 120 140 160 180t [°C]<br />
Fig. 28 Minimum flow rate<br />
TM02 7538 3703<br />
25