Results: Copper - Auckland Council
Results: Copper - Auckland Council
Results: Copper - Auckland Council

Create successful ePaper yourself
Turn your PDF publications into a flip-book with our unique Google optimized e-Paper software.
Prediction of Contaminant<br />
Accumulation in the Upper<br />
Waitemata Harbour – <strong>Results</strong>:<br />
<strong>Copper</strong><br />
Aug 2004 Technical Publication 259<br />
<strong>Auckland</strong> Regional <strong>Council</strong><br />
Technical Publication No. 259, August 2004<br />
ISSN 1175 205, ISBN 1-877-353-77-9,<br />
www.arc.govt.nz<br />
Printed on recycled paper
Prediction of Contaminant<br />
Accumulation in the<br />
Upper Waitemata Harbour –<br />
<strong>Results</strong>: <strong>Copper</strong><br />
Malcolm Green<br />
Mike Timperley<br />
Bruce Williamson<br />
(Diffuse Sources Ltd)<br />
Prepared for<br />
<strong>Auckland</strong> Regional <strong>Council</strong>, North Shore City <strong>Council</strong>, Rodney District<br />
<strong>Council</strong>, Waitakere City <strong>Council</strong>, and Transit New Zealand.<br />
NIWA Client Report: HAM2003-087/3<br />
August 2004<br />
NIWA Project: ARC03210<br />
National Institute of Water & Atmospheric Research Ltd<br />
Gate 10, Silverdale Road, Hamilton<br />
P O Box 11115, Hamilton, New Zealand<br />
Phone +64-7-856 7026, Fax +64-7-856 0151<br />
www.niwa.co.nz
Acknowledgements<br />
This report was prepared for the <strong>Auckland</strong> Regional <strong>Council</strong> , the North Shore<br />
City <strong>Council</strong>, the Rodney District <strong>Council</strong>, the Waitakere City <strong>Council</strong>, and Transit<br />
New Zealand by the National Institute of Water and Atmospheric Research<br />
Limited (NIWA).
Prediction of Contaminant Accumulation in the Upper Waitemata Harbour - COPPER TP 259 1
Contents<br />
Executive Summary 3<br />
1. Introduction 6<br />
2. Simulation Inputs 8<br />
3. Simulation Inputs – Details 14<br />
3.1 Simulation period: 54 years (2808 weeks) 14<br />
3.2 Simulation period: 108 years (5616 weeks) 28<br />
4. <strong>Results</strong> 38<br />
4.1 Simulation period: 54 years 39<br />
4.1.2 Contaminant concentrations in the harbour 40<br />
4.1.3 Time for total-sediment concentrations to reach “traffic lights” 44<br />
4.1.4 Sedimentation in the harbour 46<br />
4.1.5 Origin of sediments / contaminants that deposit in harbour (%) 47<br />
4.1.6 Origin of sediments / contaminants that deposit in harbour<br />
(mass) 50<br />
4.1.7 Fate of sediments / contaminants that derive from land (%) 52<br />
4.1.8 Fate of sediments / contaminants that derive from land (mass) 54<br />
4.2 Simulation period: 108 years 56<br />
4.2.2 Contaminant concentrations in the harbour 57<br />
4.2.3 Time for total-sediment concentrations to reach “traffic lights” 60<br />
4.2.4 Sedimentation in the harbour 63<br />
4.2.5 Origin of sediments / contaminants that deposit in harbour (%) 64<br />
4.2.6 Origin of sediments / contaminants that deposit in harbour<br />
(mass) 67<br />
4.2.7 Fate of sediments / contaminants that derive from land (%) 69<br />
4.2.8 Fate of sediments / contaminants that derive from land (mass) 71<br />
5. Discussion 74<br />
5.1 Validation of predictions 74<br />
5.2 Examples of how to interrogate and interpret results 75<br />
6. Conclusions 78<br />
Prediction of Contaminant Accumulation in the Upper Waitemata Harbour - COPPER TP 259 2
7. References 80<br />
APPENDIX A1. Programme Control Information 82<br />
A1.1 54-year simulation – existing scenario 82<br />
A1.2 108-year simulation – existing scenario 83<br />
A1.3 54-year simulation – development #1 scenario 84<br />
A1.4 108-year simulation – development #1 scenario 85<br />
A1.5 54-year simulation – response envelope – no controls 86<br />
A1.6 108-year simulation – response envelope – no controls 87<br />
A1.7 54-year simulation – response envelope – maximum attainable<br />
controls 88<br />
A1.8 108-year simulation – response envelope – maximum attainable<br />
controls 89<br />
Prediction of Contaminant Accumulation in the Upper Waitemata Harbour - COPPER TP 259 3
Executive Summary<br />
The background to the Upper Waitemata Harbour contaminant-accumulation study and the<br />
methodology used therein to predict contaminant accumulation are reported in NIWA Client<br />
Report HAM2003-087/1 – Methods.<br />
The original goal of the Upper Waitemata Harbour contaminant-accumulation study was to<br />
predict the temporal development and spatial patterns of contaminant accumulation<br />
associated with (1) the existing pattern of landuse in the catchment, and (2) two proposed<br />
patterns/sequences of development.<br />
The original goal of the study has matured somewhat over the course of the study. This has<br />
culminated in pursuing the following scenarios, the results of which are presented herein:<br />
• Existing scenario. This is the “baseline” simulation: it extrapolates the<br />
“current-day” (i.e., 2001) landuse into the future based on the assumption<br />
that landuse does not change. It also assumes no stormwater contaminant<br />
controls. This scenario serves as a baseline.<br />
• Development #1 scenario. This is the “realistic” simulation: it models<br />
development proposed in each subcatchment for each year in the future.<br />
At each modelled stage, therefore, the spatial pattern of earthworks sites<br />
and completed (mature) urban land is captured, complete with associated<br />
contaminant loads and projected stormwater contaminant controls.<br />
• Response-envelope scenario. Here, the sediment loads and contaminant<br />
loads used in the development #1 scenario are run with each of two<br />
stormwater contaminant controls, these being zero controls and maximum<br />
attainable controls. The two results bracket the results of the development<br />
#1 scenario, forming an “envelope” of responses in the harbour<br />
Inputs used in the simulations are presented, including sediment loads, contaminant loads,<br />
stormwater controls, and initial contaminant concentrations in the harbour bed sediments.<br />
There are two simulation periods: 54 years and 108 years.<br />
<strong>Results</strong> are presented as:<br />
Contaminant concentrations in the harbour<br />
(a) Existing scenario versus development #1 scenario<br />
(b) Response envelope around development #1 scenario<br />
Time for total-sediment concentrations to reach “traffic lights”<br />
(a) Existing scenario versus development #1 scenario<br />
(b) Response envelope around development #1 scenario<br />
Sedimentation 1 in the harbour<br />
(a) Existing scenario versus development #1 scenario<br />
1 Refer to the zinc results report [NIWA Client Report HAM2003-087/2 – <strong>Results</strong>: Zinc] for results<br />
concerning sediments.<br />
Prediction of Contaminant Accumulation in the Upper Waitemata Harbour - COPPER TP 259 4
(b) Response envelope around development #1 scenario<br />
Origin of sediments 1 / contaminants that deposit in harbour (%)<br />
(a) Existing scenario versus development #1 scenario<br />
Origin of sediments 1 / contaminants that deposit in harbour (mass)<br />
(a) Existing scenario versus development #1 scenario<br />
Fate of sediments 1 / contaminants that derive from land (%)<br />
(a) Existing scenario versus development #1 scenario<br />
Fate of sediments 1 / contaminants that derive from land (mass)<br />
(a) Existing scenario versus development #1 scenario<br />
The kinds of questions that may be answered with the results as a part of informing<br />
management choices include:<br />
• Where does contaminant deposited in each part of the harbour come from?<br />
• Which subestuary is most at risk? Why?<br />
• How might this risk be lessened?<br />
• Will there be other benefits associated with source control in particular<br />
subcatchments?<br />
• Which subestuary is least at risk? Why?<br />
The way the response-envelope predictions may be interpreted is explained. Further<br />
questions that may be addressed include:<br />
• Are there parts of the harbour where contaminant concentrations still exceed<br />
traffic lights even under the maximum attainable controls? What should be done<br />
in this case?<br />
• Are there parts of the harbour where environmental targets will be reached<br />
without any intervention?<br />
• Are there subestuaries where significant gains in time-to-traffic-light can be had<br />
for modest control improvements?<br />
Prediction of Contaminant Accumulation in the Upper Waitemata Harbour - COPPER TP 259 5
1. Introduction<br />
The background to the Upper Waitemata Harbour contaminant-accumulation study and the<br />
methodology used therein to predict contaminant accumulation are reported in NIWA Client<br />
Report HAM2003-087/1 – Methods.<br />
The original goal of the Upper Waitemata Harbour contaminant-accumulation study was to<br />
predict the temporal development and spatial patterns of contaminant accumulation<br />
associated with (1) the existing pattern of landuse in the catchment, and (2) two proposed<br />
patterns/sequences of development.<br />
The original goal of the study has matured somewhat over the course of the study. This has<br />
culminated in pursuing the following scenarios, the results of which are presented herein:<br />
• Existing scenario. This is the “baseline” simulation: it extrapolates the “currentday”<br />
(i.e., 2001) landuse into the future based on the assumption that landuse<br />
does not change. It also assumes no stormwater contaminant controls. In<br />
addition to serving as a baseline, this simulation is used as a model test and<br />
validation, as described in the Methods report (NIWA Client Report HAM2003-<br />
087/1 – Methods) and in the zinc results report (NIWA Client Report HAM2003-<br />
087/2 – <strong>Results</strong>: Zinc).<br />
• Development #1 scenario. This is the “realistic” simulation: it models<br />
development proposed in each subcatchment for each year in the future. At each<br />
modelled stage, therefore, the spatial pattern of earthworks sites and completed<br />
(mature) urban land is captured, complete with associated contaminant loads and<br />
projected stormwater contaminant controls.<br />
• Response-envelope scenario. Here, the sediment loads and contaminant loads<br />
used in the development #1 scenario are run with each of two stormwater<br />
contaminant controls, these being zero controls and maximum attainable<br />
controls. The two results bracket the results of the development #1 scenario,<br />
forming an “envelope” of responses in the harbour. That is, under the zerocontrol<br />
simulation, contaminant concentrations rise quickly compared to under<br />
the maximum-attainable-control simulation, and the concentrations under the<br />
realistic simulation (i.e., development #1 scenario) fall somewhere between<br />
those two extremes.<br />
Prediction of Contaminant Accumulation in the Upper Waitemata Harbour - COPPER TP 259 6
Prediction of Contaminant Accumulation in the Upper Waitemata Harbour - COPPER TP 259 7
2. Simulation Inputs<br />
There are two simulation periods: 54 and 108 years.<br />
The following parameters remain fixed throughout the simulation period:<br />
• subestuary areas over which deposition of sediments and contaminants is<br />
allowed to occur;<br />
• freshwater runoff associated with each event;<br />
• pattern of sediment and contaminant dispersal throughout the estuary (R);<br />
• pattern of sediment and contaminant redispersal throughout the estuary (R3);<br />
• bioturbation depth (BEDPTH).<br />
The following are initial conditions:<br />
• <strong>Copper</strong> concentrations in estuarine sediments, which are expressed in three<br />
ways:<br />
o mass of copper attached to size fraction 1 (silt) per total mass of size<br />
fraction 1 (silt) sediment;<br />
o mass of copper attached to size fraction 2 (sand) per total mass of size<br />
fraction 2 (sand) sediment;<br />
o total mass of copper per total mass of sediment.<br />
• The initial split of estuarine bed sediments into size fractions.<br />
The following parameters may be varied throughout the simulation period in order to<br />
generate the scenarios:<br />
• Sediment load.<br />
o The existing scenario assumes that sediment yield under the “current”<br />
(2001) landuse within the UWH catchment applies for the duration of the<br />
simulation. The catchment is characterised predominantly by pastoral land,<br />
with bush and pine also present. In addition, both established and ongoing<br />
urban development is found, e.g., in Lucas Creek subcatchment. These<br />
landuses and their spatial patterns are incorporated within the catchment<br />
model. The level of development in 2001 is assumed to continue for the<br />
whole period of the simulation. Sediment loss from established urban land<br />
is not modelled directly; instead, a constant loss of 150 kg ha-1 yr-1 is<br />
assumed. A comparison of predicted mean annual sediment yields with<br />
observed values (e.g., van Roon, 1983) has enabled catchment model<br />
validation under the existing scenario to be undertaken for all<br />
subcatchments except Hellyers Creek. This validation has confirmed that<br />
Prediction of Contaminant Accumulation in the Upper Waitemata Harbour - COPPER TP 259 8
predicted catchment yields closely match observed values, providing<br />
confidence in the parameters used within the model. Under the existing<br />
scenario, the model predictions are of hillslope sediment loss only and do<br />
not incorporate in-stream sediment dynamics. However, since downstream<br />
travel distance is generally short in the UWH subcatchments, it is assumed<br />
that sediment generated on hillsides is delivered to the estuary without<br />
further attenuation. This is likely to be a reasonable assumption during large<br />
storms, and it is these events that transport most of the annual sediment<br />
load to the estuary. Furthermore, under the existing scenario the stream<br />
banks are likely to be relatively stable.<br />
o For development #1 scenario, the spatial pattern of earthworks and<br />
completed development was incorporated into the model for each different<br />
stage of the proposed development. Sediment control measures were<br />
applied during the prediction of sediment yield at 50% of earthworks sites.<br />
These control measures had an average annual efficiency of 65–70%. The<br />
remaining 50% of earthworks sites had no sediment control measures in<br />
place. The efficiency and application of sediment controls implemented<br />
within scenario #1 was determined through discussions between NIWA,<br />
ARC and the TA’s. In addition to the simulation of hillside erosion (including<br />
earthwork sites), bank erosion, which is caused by increased flows<br />
associated with urbanisation, was predicted under the scenario #1<br />
development. This was achieved using a relation between the degree of<br />
imperviousness in a catchment and the increase in channel area, derived<br />
from the work of Herald (1989) in the Albany basin, coupled with numerous<br />
overseas studies.<br />
o For the response-envelope scenario, sediment loads from development #1<br />
scenario were applied.<br />
• Sediment partitioning. The sediment load was partitioned across particle sizes 1<br />
and 2 based on the GLEAMS output.<br />
• Contaminant load.<br />
o The derivation of copper loads followed a similar process to that described<br />
for zinc (NIWA Client Report HAM2003-087/2 – <strong>Results</strong>: Zinc) although for<br />
copper more weight was given to stormwater monitoring data collected for<br />
<strong>Auckland</strong> City. This monitoring produced best estimates of 100 g ha-1 for<br />
residential catchments equivalent to 8.3 g dwelling-1, 140 g ha-1 for<br />
commercial catchments and 110 g ha-1 for industrial catchments after<br />
subtraction of the small natural load. These estimates are consistent with<br />
the median load for all available data given in Williamson (1991) of 90 g ha-1<br />
(10 to 90%ile range 20 to 200 g ha-1). The similarity of loads among the<br />
three landuses and the slightly higher load for the commercial landuse are<br />
understandable because the main contributor of copper is likely to be<br />
vehicle brake pads and linings and the vehicle.km are higher in commercial<br />
catchments. Also, there is greater use of copper building materials in<br />
commercial buildings. The per vehicle.km copper load used for estimating<br />
the load from through-traffic was 0.00016 g vehicle-1 km-1 (Macaskill and<br />
Williamson 1994).<br />
o<br />
The existing scenario assumes that the copper load under the “current”<br />
(2001) landuse within the UWH catchment applies for the duration of the<br />
Prediction of Contaminant Accumulation in the Upper Waitemata Harbour - COPPER TP 259 9
simulation. The derivation of the 2001 annual copper load for each<br />
subcatchment is explained in the next paragraph on the development #1<br />
scenario.<br />
o The development #1 scenario copper loads generated within each<br />
subcatchment for each year were derived by adding together: (1) the total<br />
number of existing and proposed new dwellings in the year multiplied by<br />
the dwelling copper load of 8.3 g per annum; (2) the existing and proposed<br />
new commercial areas in the year multiplied by 140 g ha-1; (3) the existing<br />
and proposed new industrial areas in the year multiplied by 110 g ha-1, and;<br />
(4) the distance travelled by through traffic as vehicle.km in the year<br />
multiplied by the copper load of 0.00016 g per vehicle.km.<br />
Estimates of the numbers of dwellings, areas of commercial and industrial<br />
landuse and through traffic were obtained as described in the zinc results<br />
report (NIWA Client Report HAM2003-087/2 – <strong>Results</strong>: Zinc).<br />
o For the response-envelope scenario, the copper loads used were the same<br />
as those derived for the development #1 scenario.<br />
• Contaminant partitioning. <strong>Copper</strong> is distributed between the silt and sand in the<br />
catchment soils in the same proportion as was measured in the estuarine bed<br />
sediments. This copper concentration silt:sand ratio varied between<br />
approximately 1 to 2.5. The specific partitioning used for each subcatchment is<br />
given in the model results.<br />
• Stormwater contaminant controls.<br />
o For the existing scenario, stormwater contaminant controls were set at<br />
zero, meaning that there is no retention of sediment and associated<br />
contaminants. Although this is not strictly correct, the assumption makes<br />
no material difference to the model results; it simply means that all new<br />
controls included in the model are additional to those that existed in 2001.<br />
o The development #1 scenario stormwater contaminant controls are based<br />
on the responses to two questionnaires, one from NIWA and one from the<br />
ARC, to the participating TLAs as explained in the zinc results report (NIWA<br />
Client Report HAM2003-087/2 – <strong>Results</strong>: Zinc). The rationale for the copper<br />
controls is the same as that for zinc with the only difference being the<br />
somewhat higher retention efficiency usually achieved for copper. This<br />
higher efficiency is mainly a consequence of the much lower solubility of<br />
copper compared with zinc. The exception to this general difference is the<br />
control for copper from through traffic. The control is assumed to be the<br />
same as the control for zinc because the maximum retention of any metal<br />
in pond–swale systems is about 80%. The development #1 scenario<br />
controls are given in the following table. These controls apply only to new<br />
development, i.e., retrofitting is excluded.<br />
Prediction of Contaminant Accumulation in the Upper Waitemata Harbour - COPPER TP 259 10
<strong>Copper</strong> source<br />
Realistic controls<br />
(% retained)<br />
Existing dwellings 0 No retrofitting.<br />
Existing commercial 0 No retrofitting.<br />
Existing industrial 0 No retrofitting.<br />
Existing through<br />
traffic<br />
30% to 2005,<br />
then 80%<br />
Explanation<br />
Assumed to follow controls on<br />
future traffic because same<br />
roads are used.<br />
Future dwellings 60 80% of dwellings connected to<br />
controls with 75% retention.<br />
Future commercial 60 As for future dwellings.<br />
Future industrial 60 As for future dwellings.<br />
Future through traffic 30% to 2005,<br />
then 80%<br />
Up to 2005, 40% of runoff<br />
from new roads controlled with<br />
80% retention. From 2006 on,<br />
100% of runoff treated with<br />
80% retention.<br />
o The response-envelope scenario addressed the two extreme options for<br />
contaminant controls; zero and the maximum attainable as explained in<br />
detail in the zinc results report (NIWA Client Report HAM2003-087/2 –<br />
<strong>Results</strong>: Zinc). The maximum-attainable controls for copper are listed and<br />
described in the following table. As explained for zinc, for dwellings and<br />
commercial and industrial landuses, a generic level of control for copper<br />
equivalent to the retention achieved in a wetland, i.e., 75%, was assumed.<br />
The maximum attainable controls for roads are the same as for<br />
development #1 scenario. Note that the only difference between the<br />
controls for development #1 scenario and the response-envelope scenario<br />
is the inclusion of retrofitting in the envelope scenario.<br />
Prediction of Contaminant Accumulation in the Upper Waitemata Harbour - COPPER TP 259 11
<strong>Copper</strong> source<br />
Maximum<br />
attainable control<br />
(% retained)<br />
Explanation<br />
Existing dwellings 50 60% of dwellings connected to<br />
controls with 75% retention.<br />
Existing commercial 50 As for existing dwellings.<br />
Existing industrial 50 As for existing dwellings.<br />
Existing through<br />
traffic<br />
30% to 2005,<br />
then 80%<br />
Assumed to follow controls on<br />
future traffic because same<br />
roads are used.<br />
Future dwellings 60 80% of dwellings connected to<br />
controls with 75% retention.<br />
Future commercial 60 As for future dwellings.<br />
Future industrial 60 As for future dwellings.<br />
Future through traffic 30% to 2005,<br />
then 80%<br />
Up to 2005, 40% of runoff<br />
from new roads controlled with<br />
80% retention. From 2006 on,<br />
100% of runoff treated with<br />
80% retention.<br />
Prediction of Contaminant Accumulation in the Upper Waitemata Harbour - COPPER TP 259 12
Prediction of Contaminant Accumulation in the Upper Waitemata Harbour - COPPER TP 259 13
3. Simulation Inputs – Details<br />
3.1 Simulation period: 54 years (2808 weeks)<br />
For the 54-year simulation, the following inputs were used.<br />
• Total area of each subestuary and area of channel and banks/intertidal flats in<br />
each subestuary (Table 4.2 in Methodology Report).<br />
• Bioturbation model – uniform, with a bioturbation depth of 0.11 m .<br />
• Event time series – four different magnitude events (E1, E2, E3, E4; Table 4.3<br />
and Table 4.4 in Methodology Report) spread uniformly throughout simulation<br />
period of 54 years (1–2808 weeks, Figure A.3 in Methodology Report).<br />
• R (Figure 4.6 in Methodology Report).<br />
• R3(Figure 4.7 in Methodology Report).<br />
• Contaminant partitioning across size fractions:<br />
Period<br />
#<br />
Week<br />
start<br />
Week<br />
end<br />
Fraction of contaminant<br />
load on each size fraction<br />
Subcatchment Size fraction 1 Size fraction<br />
(silt)<br />
2<br />
(sand)<br />
1 1 2808 1=Hellyers 0.98 0.02<br />
1 1 2808 2=Lucas 0.95 0.05<br />
1 1 2808 3=Paremoremo 0.92 0.08<br />
1 1 2808 4=Rangitopuni 0.95 0.05<br />
1 1 2808 5=Brighams 0.95 0.05<br />
1 1 2808 6=Rarawaru 0.95 0.05<br />
1 1 2808 7=Waiarohia 0.98 0.02<br />
• Sediment partitioning across size fractions:<br />
Fraction of sediment load<br />
on each size fraction<br />
Period<br />
#<br />
Week<br />
start<br />
Week<br />
end<br />
Subcatchment Size fraction 1<br />
(silt)<br />
Size fraction 2<br />
(sand)<br />
1 1 2808 1=Hellyers 0.93 0.07<br />
1 1 2808 2=Lucas 0.88 0.12<br />
1 1 2808 3=Paremoremo 0.90 0.10<br />
1 1 2808 4=Rangitopuni 0.91 0.09<br />
1 1 2808 5=Brighams 0.95 0.05<br />
1 1 2808 6=Rarawaru 0.95 0.05<br />
1 1 2808 7=Waiarohia 0.95 0.05<br />
Prediction of Contaminant Accumulation in the Upper Waitemata Harbour - COPPER TP 259 14
• Contaminant loads – soil (natural or “background” load):<br />
o For all subcatchments: 20 mg copper per kg of silt (size fraction 1) yield and<br />
6 mg copper per kg of sand (size fraction 2) yield.<br />
• Initial contaminant concentrations in estuarine bed sediment size fractions:<br />
Cu conc, mg/kg<br />
Subestuary Size<br />
fraction 1<br />
(silt)<br />
Size<br />
fraction 2<br />
(sand)<br />
1 = Hellyers 22 6<br />
2 = Lucas 24 9<br />
3 = Paremoremo 22 23<br />
4 = Rangitopuni 23 12<br />
5 = Brighams 24 24<br />
6 = Rarawaru 24 24<br />
7 = Waiarohia 23 10<br />
8 = MWH - -<br />
9 = Upper main UWH 25 21<br />
10 = Middle main UWH 27 4<br />
11 = Lower main UWH 28 5<br />
Prediction of Contaminant Accumulation in the Upper Waitemata Harbour - COPPER TP 259 15
• Initial split of estuarine bed sediments into size fractions:<br />
Subestuary<br />
% of bed sediment in each size fraction<br />
Size fraction 1<br />
(silt)<br />
Size fraction 2<br />
(sand)<br />
1 = Hellyers 77.77 22.23<br />
2 = Lucas 66.68 33.32<br />
3 = Paremoremo 68.80 31.20<br />
4 = Rangitopuni 56.84 43.16<br />
5 = Brighams 77.30 22.70<br />
6 = Rarawaru 77.30 22.70<br />
7 = Waiarohia 26.09 73.91<br />
8 = MWH - -<br />
9 = Upper main UWH 82.34 17.66<br />
10 = Middle main UWH 33.55 66.45<br />
11 = Lower main UWH 33.35 66.65<br />
• Initial contaminant concentrations in estuarine bed sediments – total:<br />
Subestuary<br />
Cu conc, mg/kg<br />
1 = Hellyers 20<br />
2 = Lucas 19<br />
3 = Paremoremo 21<br />
4 = Rangitopuni 18<br />
5 = Brighams 24<br />
6 = Rarawaru 24<br />
7 = Waiarohia 13<br />
8 = MWH -<br />
9 = Upper main UWH 22<br />
10 = Middle main UWH 6<br />
11 = Lower main UWH 13<br />
Prediction of Contaminant Accumulation in the Upper Waitemata Harbour - COPPER TP 259 16
• Sediment loads from each subcatchment as a function of event magnitude, 54<br />
years, existing scenario:<br />
Period<br />
#<br />
sediment load, kg<br />
Subcatchment Event E1 Event E2 Event E3 Event E4<br />
Week<br />
start<br />
Week<br />
end<br />
1 1 2808 1=Hellyers 6,000 70,000 180,000 1,800,000<br />
1 1 2808 2=Lucas 11,037 1,190,000 5,130,000 18,100,000<br />
1 1 2808 3=Paremoremo 14.3 319,000 1,540,000 5,730,000<br />
1 1 2808 4=Rangitopuni 1,160 1,960,000 8,720,000 31,200,000<br />
1 1 2808 5=Brighams 45 132,000 488,000 3,520,000<br />
1 1 2808 6=Rarawaru 195 10,000 69,900 271,000<br />
1 1 2808 7=Waiarohia 437 52,100 282,000 1,330,000<br />
sediment load (kg)<br />
SEDIMENT LOAD (kg) FROM EACH SUBCATCHMENT<br />
AS A FUNCTION OF EVENT MAGNITUDE<br />
54 years - Existing<br />
100000000<br />
10000000<br />
1000000<br />
100000<br />
10000<br />
1000<br />
100<br />
10<br />
syep1.grf<br />
E1<br />
E2<br />
E3<br />
E4<br />
1 2 3 4 5 6 7<br />
subcatchment number<br />
These are the same sediment loads that were<br />
used in the existing scenario, zinc.<br />
Prediction of Contaminant Accumulation in the Upper Waitemata Harbour - COPPER TP 259 17
• Sediment loads from each subcatchment as a function of event magnitude, 54<br />
years, development #1 scenario and response-envelope scenario (change in<br />
loads through time is a result of landuse change):<br />
Period<br />
#<br />
sediment load, kg<br />
Subcatchment Event E1 Event E2 Event E3 Event E4<br />
Week<br />
start<br />
Week<br />
end<br />
1 1 520 1=Hellyers 6,000 70,000 180,000 1,800,000<br />
1 1 520 2=Lucas 8,726 906,917 3,616,680 12,842,993<br />
1 1 520 3=Paremoremo 9,146 848,914 3,428,741 12,167,005<br />
1 1 520 4=Rangitopuni 1,280 1,901,862 8,414,052 30,149,116<br />
1 1 520 5=Brighams 10 210,801 800,788 5,660,463<br />
1 1 520 6=Rarawaru 10 13,536 68,872 365,385<br />
1 1 520 7=Waiarohia 113 72,258 371,658 1,794,805<br />
2 521 1040 1=Hellyers 6,000 70,000 180,000 1,800,000<br />
2 521 1040 2=Lucas 4,038 611,016 2,443,164 9,575,109<br />
2 521 1040 3=Paremoremo 4,018 500,403 2,048,763 8,169,509<br />
2 521 1040 4=Rangitopuni 1,223 1,818,339 8,045,166 28,886,503<br />
2 521 1040 5=Brighams 10 274,786 1,043,837 7,400,884<br />
2 521 1040 6=Rarawaru 10 13,374 67,732 363,100<br />
2 521 1040 7=Waiarohia 163 90,426 456,730 2,275,890<br />
3 1041 1560 1=Hellyers 6,000 70,000 180,000 1,800,000<br />
3 1041 1560 2=Lucas 2,973 489,639 1,912,042 7,811,152<br />
3 1041 1560 3=Paremoremo 2,874 363,223 1,456,753 6,164,793<br />
3 1041 1560 4=Rangitopuni 1,051 1,798,170 7,985,930 28,667,845<br />
3 1041 1560 5=Brighams 10 268,811 1,019,490 7,256,593<br />
3 1041 1560 6=Rarawaru 10 11,011 55,789 310,707<br />
3 1041 1560 7=Waiarohia 45 64,648 325,179 1,768,049<br />
4 1561 2080 1=Hellyers 6,000 70,000 180,000 1,800,000<br />
4 1561 2080 2=Lucas 1,962 414,417 1,613,499 7,045,243<br />
4 1561 2080 3=Paremoremo 1,913 290,643 1,170,328 5,456,592<br />
4 1561 2080 4=Rangitopuni 1,051 1,798,170 7,985,930 28,667,845<br />
4 1561 2080 5=Brighams 10 258,709 981,120 7,006,161<br />
4 1561 2080 6=Rarawaru 10 10,774 54,577 304,129<br />
4 1561 2080 7=Waiarohia 34 46,081 229,720 1,273,534<br />
5 2081 2808 1=Hellyers 6,000 70,000 180,000 1,800,000<br />
5 2081 2081 2=Lucas 1,569 368,319 1,426,442 6,429,850<br />
5 2081 2081 3=Paremoremo 1,491 238,573 959,891 4,731,769<br />
5 2081 2081 4=Rangitopuni 1,051 1,798,170 7,985,930 28,667,845<br />
5 2081 2081 5=Brighams 10 274,208 1,039,830 7,450,822<br />
5 2081 2081 6=Rarawaru 10 10,756 54,473 303,724<br />
5 2081 2081 7=Waiarohia 38 47,819 235,964 1,337,167<br />
The next pages<br />
show plots, with<br />
comparisons to<br />
sediment loads used<br />
in existing scenario.<br />
These are the same sediment loads that were<br />
used in the development #1 and responseenvelope<br />
scenarios, zinc.<br />
Prediction of Contaminant Accumulation in the Upper Waitemata Harbour - COPPER TP 259 18
SEDIMENT LOAD (kg) FROM EACH SUBCATCHMENT<br />
AS A FUNCTION OF EVENT MAGNITUDE<br />
54 years - Development #1 Scenario<br />
Period 1: 0-520 weeks<br />
sys1p1.grf<br />
sediment load (kg)<br />
100000000<br />
10000000<br />
1000000<br />
100000<br />
10000<br />
1000<br />
100<br />
10<br />
Dashed lines show sediment loads<br />
used in existing scenario<br />
E1<br />
E2<br />
E3<br />
E4<br />
1 2 3 4 5 6 7<br />
subcatchment number<br />
SEDIMENT LOAD (kg) FROM EACH SUBCATCHMENT<br />
AS A FUNCTION OF EVENT MAGNITUDE<br />
54 years - Development #1 Scenario<br />
Period 2: 521-1040 weeks<br />
sys1p2.grf<br />
100000000<br />
Dashed lines show sediment loads<br />
used in existing scenario<br />
E1<br />
E2<br />
E3<br />
E4<br />
sediment load (kg)<br />
10000000<br />
1000000<br />
100000<br />
10000<br />
1000<br />
100<br />
10<br />
1 2 3 4 5 6 7<br />
subcatchment number<br />
Prediction of Contaminant Accumulation in the Upper Waitemata Harbour - COPPER TP 259 19
SEDIMENT LOAD (kg) FROM EACH SUBCATCHMENT<br />
AS A FUNCTION OF EVENT MAGNITUDE<br />
54 years - Development #1 Scenario<br />
Period 3: 1041-1560 weeks<br />
sys1p3.grf<br />
100000000<br />
Dashed lines show sediment loads<br />
used in existing scenario<br />
E1<br />
E2<br />
E3<br />
E4<br />
sediment load (kg)<br />
10000000<br />
1000000<br />
100000<br />
10000<br />
1000<br />
100<br />
10<br />
1 2 3 4 5 6 7<br />
subcatchment number<br />
SEDIMENT LOAD (kg) FROM EACH SUBCATCHMENT<br />
AS A FUNCTION OF EVENT MAGNITUDE<br />
54 years - Development #1 Scenario<br />
Period 4: 1561-2080 weeks<br />
sys1p4.grf<br />
100000000<br />
Dashed lines show sediment loads<br />
used in existing scenario<br />
E1<br />
E2<br />
E3<br />
E4<br />
sediment load (kg)<br />
10000000<br />
1000000<br />
100000<br />
10000<br />
1000<br />
100<br />
10<br />
1 2 3 4 5 6 7<br />
subcatchment number<br />
Prediction of Contaminant Accumulation in the Upper Waitemata Harbour - COPPER TP 259 20
SEDIMENT LOAD (kg) FROM EACH SUBCATCHMENT<br />
AS A FUNCTION OF EVENT MAGNITUDE<br />
54 years - Development #1 Scenario<br />
Period 5: 2081-2808 weeks<br />
sys1p5.grf<br />
sediment load (kg)<br />
100000000<br />
10000000<br />
1000000<br />
100000<br />
10000<br />
1000<br />
100<br />
10<br />
Dashed lines show sediment loads<br />
used in existing scenario<br />
E1<br />
E2<br />
E3<br />
E4<br />
1 2 3 4 5 6 7<br />
subcatchment number<br />
• Contaminant loads – dwellings, roads, traffic (“urban load”) – existing scenario:<br />
Period Week Week<br />
kg copper from each subcatchment<br />
# start end 1=Hel 2=Luc 3=Par 4=Ran 5=Bri 6=Rar 7=Wai<br />
1 1 2808 95.45 82.14 2.06 13.78 10.00 14.19 40.23<br />
COPPER LOAD (kg) FROM EACH<br />
SUBCATCHMENT AS A FUNCTION OF TIME<br />
100<br />
54 years - Existing c54eac23.grf<br />
Hel<br />
Luc<br />
Par<br />
<strong>Copper</strong> load (kg)<br />
10<br />
Ran<br />
Bri<br />
Rar<br />
Wai<br />
1<br />
0<br />
9<br />
18<br />
27<br />
36<br />
45<br />
54<br />
YEARS FROM 2001<br />
Prediction of Contaminant Accumulation in the Upper Waitemata Harbour - COPPER TP 259 21
• Contaminant loads – dwellings, roads, traffic (“urban load”) – development #1<br />
scenario and response-envelope scenario:<br />
Period Week Week<br />
kg copper from each subcatchment<br />
# start end 1=Hel 2=Luc 3=Par 4=Ran 5=Bri 6=Rar 7=Wai<br />
1 1 52 95.45 82.14 2.06 13.78 10.00 14.19 40.23<br />
2 53 104 95.45 87.74 2.11 13.82 10.07 14.20 40.34<br />
3 105 156 95.45 93.33 2.17 13.86 10.13 14.22 40.44<br />
4 157 208 95.45 98.96 2.22 13.89 10.20 14.23 40.58<br />
5 209 260 95.45 104.56 2.27 14.26 12.13 14.24 40.69<br />
6 261 312 95.45 111.32 2.33 14.63 14.05 14.44 46.73<br />
7 313 364 95.45 117.91 2.36 14.99 15.98 14.64 52.69<br />
8 365 416 95.45 124.43 2.40 15.36 17.91 14.84 58.58<br />
9 417 468 95.45 130.88 2.43 15.73 19.83 15.04 64.40<br />
10 469 520 95.45 137.26 2.46 16.09 21.76 15.24 70.15<br />
11 521 572 95.45 143.58 2.50 16.46 23.68 15.44 75.85<br />
12 573 624 95.45 150.77 2.51 16.82 25.61 15.66 81.49<br />
13 625 676 95.45 157.91 2.52 17.19 27.53 15.89 87.08<br />
14 677 728 95.45 164.99 2.52 17.55 29.45 16.12 92.62<br />
15 729 780 95.45 172.03 2.53 17.91 31.37 16.34 98.11<br />
16 781 832 95.45 179.03 2.54 18.28 33.30 16.57 103.56<br />
17 833 884 95.45 185.98 2.55 18.64 35.22 16.79 108.96<br />
18 885 936 95.45 192.89 2.56 19.00 37.14 17.02 114.33<br />
19 937 988 95.45 199.77 2.57 19.37 39.06 17.24 119.66<br />
20 989 1040 95.45 206.61 2.58 19.73 40.98 17.47 124.96<br />
21 1041 1092 95.45 213.43 2.59 20.09 42.89 17.70 130.22<br />
22 1093 1144 95.45 222.65 2.59 20.45 44.81 17.93 134.54<br />
23 1145 1196 95.45 231.86 2.59 20.81 46.73 18.17 138.84<br />
24 1197 1248 95.45 241.03 2.59 21.17 48.65 18.41 143.10<br />
25 1249 1300 95.45 250.18 2.59 21.20 50.56 18.64 147.34<br />
26 1301 1352 95.45 259.30 2.59 21.23 52.18 18.69 149.94<br />
27 1353 1404 95.45 268.40 2.60 21.26 53.09 18.74 152.51<br />
28 1405 1456 95.45 277.49 2.60 21.29 54.01 18.79 155.07<br />
29 1457 1508 95.45 286.55 2.60 21.32 54.92 18.84 157.60<br />
30 1509 1560 95.45 295.59 2.60 21.35 55.84 18.89 160.12<br />
31 1561 1612 95.45 304.62 2.60 21.38 56.75 18.94 162.61<br />
32 1613 1664 95.45 310.72 2.61 21.41 57.67 18.94 165.09<br />
33 1665 1716 95.45 316.81 2.61 21.44 58.58 18.94 167.56<br />
34 1717 1768 95.45 322.88 2.62 21.47 59.49 18.94 170.01<br />
35 1769 1820 95.45 328.94 2.62 21.49 60.41 18.94 172.45<br />
36 1821 1872 95.45 334.99 2.62 21.52 61.32 18.94 174.87<br />
37 1873 1924 95.45 341.02 2.63 21.55 62.23 18.94 177.29<br />
38 1925 1976 95.45 347.04 2.63 21.58 63.14 18.94 179.69<br />
39 1977 2028 95.45 353.06 2.64 21.60 64.05 18.94 182.08<br />
40 2029 2080 95.45 359.06 2.64 21.63 64.96 18.94 184.46<br />
41 2081 2132 95.45 365.05 2.65 21.65 65.87 18.94 186.83<br />
42 2133 2184 95.45 371.06 2.65 21.68 66.78 18.94 189.20<br />
43 2185 2236 95.45 377.07 2.65 21.71 67.69 18.94 191.55<br />
44 2237 2288 95.45 383.06 2.66 21.73 68.60 18.94 193.90<br />
45 2289 2340 95.45 389.05 2.66 21.76 69.51 18.94 196.24<br />
46 2341 2392 95.45 395.03 2.66 21.78 70.42 18.94 198.57<br />
47 2393 2444 95.45 401.00 2.67 21.81 71.33 18.94 200.90<br />
48 2445 2496 95.45 406.97 2.67 21.83 72.23 18.94 203.22<br />
49 2497 2548 95.45 412.93 2.67 21.85 73.14 18.94 205.53<br />
50 2549 2600 95.45 418.89 2.68 21.88 74.04 18.94 207.84<br />
51 2601 2652 95.45 424.84 2.68 21.90 74.95 18.94 210.14<br />
52 2653 2704 95.45 424.91 2.68 21.92 75.86 18.94 212.44<br />
53 2705 2756 95.45 424.98 2.68 21.95 76.76 18.94 214.74<br />
54 2757 2808 95.45 425.05 2.68 21.97 77.67 18.94 217.03<br />
The next page shows a plot, with comparisons to<br />
contaminant loads used in existing scenario.<br />
Prediction of Contaminant Accumulation in the Upper Waitemata Harbour - COPPER TP 259 22
COPPER LOAD (kg) FROM EACH<br />
SUBCATCHMENT AS A FUNCTION OF TIME<br />
54 years - Development #1 Scenario c54s1c23.grf<br />
Dashed lines show contaminant loads<br />
used in existing scenario<br />
<strong>Copper</strong> load (kg)<br />
100<br />
10<br />
Hel<br />
Luc<br />
Par<br />
Ran<br />
Bri<br />
Rar<br />
Wai<br />
1<br />
0<br />
9<br />
18<br />
27<br />
36<br />
45<br />
54<br />
YEARS FROM 2001<br />
• Stormwater contaminant controls – existing scenario:<br />
Fraction of sediment load (with attached contaminant) passed through controls<br />
1=Hel 2=Luc 3=Par 4=Ran 5=Bri 6=Rar 7=Wai<br />
Period Week Week Events<br />
# start end<br />
silt sand silt sand silt sand silt sand silt sand silt sand silt sand<br />
1 1 2808 1,2,3,4 1.00 1.00 1.00 1.00 1.00 1.00 1.00 1.00 1.00 1.00 1.00 1.00 1.00 1.00<br />
Prediction of Contaminant Accumulation in the Upper Waitemata Harbour - COPPER TP 259 23
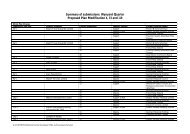
• Stormwater contaminant controls – development #1 scenario:<br />
Fraction of sediment load (with attached contaminant) passed through controls<br />
1=Hel 2=Luc 3=Par 4=Ran 5=Bri 6=Rar 7=Wai<br />
Period Week Week Events<br />
# start end<br />
silt sand silt sand silt sand silt sand silt sand silt sand silt sand<br />
1 1 52 1,2,3,4 1.00 1.00 0.95 0.95 1.00 1.00 0.86 0.86 0.81 0.81 1.00 1.00 0.90 0.90<br />
2 53 104 1,2,3,4 1.00 1.00 0.91 0.91 0.98 0.98 0.86 0.86 0.80 0.80 1.00 1.00 0.89 0.89<br />
3 105 156 1,2,3,4 1.00 1.00 0.88 0.88 0.97 0.97 0.86 0.86 0.80 0.80 1.00 1.00 0.89 0.89<br />
4 157 208 1,2,3,4 1.00 1.00 0.86 0.86 0.96 0.96 0.86 0.86 0.80 0.80 1.00 1.00 0.89 0.89<br />
5 209 260 1,2,3,4 1.00 1.00 0.83 0.83 0.94 0.94 0.84 0.84 0.74 0.74 1.00 1.00 0.89 0.89<br />
6 261 312 1,2,3,4 1.00 1.00 0.78 0.78 0.93 0.93 0.75 0.75 0.60 0.60 0.99 0.99 0.77 0.77<br />
7 313 364 1,2,3,4 1.00 1.00 0.76 0.76 0.92 0.92 0.74 0.74 0.58 0.58 0.98 0.98 0.72 0.72<br />
8 365 416 1,2,3,4 1.00 1.00 0.74 0.74 0.92 0.92 0.73 0.73 0.56 0.56 0.97 0.97 0.68 0.68<br />
9 417 468 1,2,3,4 1.00 1.00 0.72 0.72 0.91 0.91 0.72 0.72 0.54 0.54 0.97 0.97 0.65 0.65<br />
10 469 520 1,2,3,4 1.00 1.00 0.70 0.70 0.90 0.90 0.72 0.72 0.53 0.53 0.96 0.96 0.63 0.63<br />
11 521 572 1,2,3,4 1.00 1.00 0.69 0.69 0.89 0.89 0.71 0.71 0.52 0.52 0.95 0.95 0.61 0.61<br />
12 573 624 1,2,3,4 1.00 1.00 0.67 0.67 0.89 0.89 0.70 0.70 0.51 0.51 0.94 0.94 0.59 0.59<br />
13 625 676 1,2,3,4 1.00 1.00 0.66 0.66 0.89 0.89 0.69 0.69 0.50 0.50 0.94 0.94 0.58 0.58<br />
14 677 728 1,2,3,4 1.00 1.00 0.65 0.65 0.89 0.89 0.69 0.69 0.49 0.49 0.93 0.93 0.57 0.57<br />
15 729 780 1,2,3,4 1.00 1.00 0.64 0.64 0.89 0.89 0.68 0.68 0.49 0.49 0.92 0.92 0.56 0.56<br />
16 781 832 1,2,3,4 1.00 1.00 0.63 0.63 0.89 0.89 0.68 0.68 0.48 0.48 0.91 0.91 0.55 0.55<br />
17 833 884 1,2,3,4 1.00 1.00 0.62 0.62 0.88 0.88 0.67 0.67 0.48 0.48 0.91 0.91 0.54 0.54<br />
18 885 936 1,2,3,4 1.00 1.00 0.61 0.61 0.88 0.88 0.66 0.66 0.47 0.47 0.90 0.90 0.53 0.53<br />
19 937 988 1,2,3,4 1.00 1.00 0.60 0.60 0.88 0.88 0.66 0.66 0.47 0.47 0.89 0.89 0.52 0.52<br />
20 989 1040 1,2,3,4 1.00 1.00 0.59 0.59 0.88 0.88 0.65 0.65 0.47 0.47 0.89 0.89 0.52 0.52<br />
21 1041 1092 1,2,3,4 1.00 1.00 0.59 0.59 0.88 0.88 0.65 0.65 0.46 0.46 0.88 0.88 0.51 0.51<br />
22 1093 1144 1,2,3,4 1.00 1.00 0.58 0.58 0.88 0.88 0.64 0.64 0.46 0.46 0.87 0.87 0.51 0.51<br />
23 1145 1196 1,2,3,4 1.00 1.00 0.57 0.57 0.88 0.88 0.64 0.64 0.46 0.46 0.87 0.87 0.50 0.50<br />
24 1197 1248 1,2,3,4 1.00 1.00 0.56 0.56 0.88 0.88 0.64 0.64 0.45 0.45 0.86 0.86 0.50 0.50<br />
25 1249 1300 1,2,3,4 1.00 1.00 0.56 0.56 0.88 0.88 0.63 0.63 0.45 0.45 0.86 0.86 0.50 0.50<br />
26 1301 1352 1,2,3,4 1.00 1.00 0.55 0.55 0.88 0.88 0.63 0.63 0.45 0.45 0.86 0.86 0.49 0.49<br />
27 1353 1404 1,2,3,4 1.00 1.00 0.55 0.55 0.88 0.88 0.63 0.63 0.45 0.45 0.85 0.85 0.49 0.49<br />
28 1405 1456 1,2,3,4 1.00 1.00 0.54 0.54 0.88 0.88 0.63 0.63 0.45 0.45 0.85 0.85 0.49 0.49<br />
29 1457 1508 1,2,3,4 1.00 1.00 0.54 0.54 0.88 0.88 0.63 0.63 0.45 0.45 0.85 0.85 0.49 0.49<br />
30 1509 1560 1,2,3,4 1.00 1.00 0.53 0.53 0.87 0.87 0.63 0.63 0.45 0.45 0.85 0.85 0.49 0.49<br />
31 1561 1612 1,2,3,4 1.00 1.00 0.53 0.53 0.87 0.87 0.63 0.63 0.45 0.45 0.85 0.85 0.49 0.49<br />
32 1613 1664 1,2,3,4 1.00 1.00 0.53 0.53 0.87 0.87 0.63 0.63 0.44 0.44 0.85 0.85 0.48 0.48<br />
33 1665 1716 1,2,3,4 1.00 1.00 0.52 0.52 0.87 0.87 0.63 0.63 0.44 0.44 0.85 0.85 0.48 0.48<br />
34 1717 1768 1,2,3,4 1.00 1.00 0.52 0.52 0.87 0.87 0.63 0.63 0.44 0.44 0.85 0.85 0.48 0.48<br />
35 1769 1820 1,2,3,4 1.00 1.00 0.52 0.52 0.87 0.87 0.63 0.63 0.44 0.44 0.85 0.85 0.48 0.48<br />
36 1821 1872 1,2,3,4 1.00 1.00 0.52 0.52 0.87 0.87 0.63 0.63 0.44 0.44 0.85 0.85 0.48 0.48<br />
37 1873 1924 1,2,3,4 1.00 1.00 0.51 0.51 0.87 0.87 0.63 0.63 0.44 0.44 0.85 0.85 0.48 0.48<br />
38 1925 1976 1,2,3,4 1.00 1.00 0.51 0.51 0.87 0.87 0.63 0.63 0.44 0.44 0.85 0.85 0.48 0.48<br />
39 1977 2028 1,2,3,4 1.00 1.00 0.51 0.51 0.87 0.87 0.63 0.63 0.44 0.44 0.85 0.85 0.47 0.47<br />
40 2029 2080 1,2,3,4 1.00 1.00 0.51 0.51 0.87 0.87 0.63 0.63 0.44 0.44 0.85 0.85 0.47 0.47<br />
41 2081 2132 1,2,3,4 1.00 1.00 0.51 0.51 0.87 0.87 0.63 0.63 0.44 0.44 0.85 0.85 0.47 0.47<br />
42 2133 2184 1,2,3,4 1.00 1.00 0.50 0.50 0.87 0.87 0.63 0.63 0.44 0.44 0.85 0.85 0.47 0.47<br />
43 2185 2236 1,2,3,4 1.00 1.00 0.50 0.50 0.87 0.87 0.62 0.62 0.44 0.44 0.85 0.85 0.47 0.47<br />
44 2237 2288 1,2,3,4 1.00 1.00 0.50 0.50 0.86 0.86 0.62 0.62 0.44 0.44 0.85 0.85 0.47 0.47<br />
45 2289 2340 1,2,3,4 1.00 1.00 0.50 0.50 0.86 0.86 0.62 0.62 0.43 0.43 0.85 0.85 0.47 0.47<br />
46 2341 2392 1,2,3,4 1.00 1.00 0.50 0.50 0.86 0.86 0.62 0.62 0.43 0.43 0.85 0.85 0.47 0.47<br />
47 2393 2444 1,2,3,4 1.00 1.00 0.50 0.50 0.86 0.86 0.62 0.62 0.43 0.43 0.85 0.85 0.47 0.47<br />
48 2445 2496 1,2,3,4 1.00 1.00 0.49 0.49 0.86 0.86 0.62 0.62 0.43 0.43 0.85 0.85 0.47 0.47<br />
49 2497 2548 1,2,3,4 1.00 1.00 0.49 0.49 0.86 0.86 0.62 0.62 0.43 0.43 0.85 0.85 0.46 0.46<br />
50 2549 2600 1,2,3,4 1.00 1.00 0.49 0.49 0.86 0.86 0.62 0.62 0.43 0.43 0.85 0.85 0.46 0.46<br />
51 2601 2652 1,2,3,4 1.00 1.00 0.49 0.49 0.86 0.86 0.62 0.62 0.43 0.43 0.85 0.85 0.46 0.46<br />
52 2653 2704 1,2,3,4 1.00 1.00 0.49 0.49 0.86 0.86 0.62 0.62 0.43 0.43 0.85 0.85 0.46 0.46<br />
53 2705 2756 1,2,3,4 1.00 1.00 0.49 0.49 0.86 0.86 0.62 0.62 0.43 0.43 0.85 0.85 0.46 0.46<br />
Prediction of Contaminant Accumulation in the Upper Waitemata Harbour - COPPER TP 259 24
54 2757 2808 1,2,3,4 1.00 1.00 0.49 0.49 0.86 0.86 0.62 0.62 0.43 0.43 0.85 0.85 0.46 0.46<br />
CONTAMINANT CONTROLS IN EACH<br />
SUBCATCHMENT AS A FUNCTION OF TIME<br />
54 years - Development #1 Scenario cgs1pnnn.grf<br />
Silt / contaminant attached to silt<br />
% passed through control<br />
1.0<br />
0.8<br />
0.6<br />
0.4<br />
0.2<br />
0.0<br />
Sand / contaminant attached to sand<br />
Hel<br />
Luc<br />
Par<br />
Rar<br />
Bri<br />
Rar<br />
Wai<br />
1.0<br />
0.8<br />
0.6<br />
0.4<br />
0.2<br />
0.0<br />
0<br />
9<br />
18<br />
27<br />
36<br />
% passed through control<br />
45<br />
54<br />
YEARS FROM 2001<br />
• Stormwater contaminant controls – response-envelope scenario, zero controls:<br />
Fraction of sediment load (with attached contaminant) passed through controls<br />
1=Hel 2=Luc 3=Par 4=Ran 5=Bri 6=Rar 7=Wai<br />
Period Week Week Events<br />
# start end<br />
silt sand silt sand silt sand silt sand silt sand silt sand silt sand<br />
1 1 2808 1,2,3,4 1.00 1.00 1.00 1.00 1.00 1.00 1.00 1.00 1.00 1.00 1.00 1.00 1.00 1.00<br />
Prediction of Contaminant Accumulation in the Upper Waitemata Harbour - COPPER TP 259 25
• Stormwater contaminant controls – response-envelope scenario, maximum<br />
attainable controls:<br />
Fraction of sediment load (with attached contaminant) passed through controls<br />
1=Hel 2=Luc 3=Par 4=Ran 5=Bri 6=Rar 7=Wai<br />
Period Week Week Events<br />
# start end<br />
silt sand silt sand silt sand silt sand silt sand silt sand silt sand<br />
1 1 52 1,2,3,4 0.50 0.50 0.50 0.50 0.50 0.50 0.50 0.50 0.50 0.50 0.50 0.50 0.50 0.50<br />
2 53 104 1,2,3,4 0.50 0.50 0.49 0.49 0.50 0.50 0.50 0.50 0.50 0.50 0.50 0.50 0.50 0.50<br />
3 105 156 1,2,3,4 0.50 0.50 0.49 0.49 0.50 0.50 0.50 0.50 0.50 0.50 0.50 0.50 0.50 0.50<br />
4 157 208 1,2,3,4 0.50 0.50 0.48 0.48 0.49 0.49 0.50 0.50 0.50 0.50 0.50 0.50 0.50 0.50<br />
5 209 260 1,2,3,4 0.50 0.50 0.48 0.48 0.49 0.49 0.50 0.50 0.48 0.48 0.50 0.50 0.50 0.50<br />
6 261 312 1,2,3,4 0.50 0.50 0.45 0.45 0.49 0.49 0.41 0.41 0.38 0.38 0.50 0.50 0.42 0.42<br />
7 313 364 1,2,3,4 0.50 0.50 0.44 0.44 0.49 0.49 0.41 0.41 0.39 0.39 0.50 0.50 0.42 0.42<br />
8 365 416 1,2,3,4 0.50 0.50 0.44 0.44 0.49 0.49 0.41 0.41 0.39 0.39 0.50 0.50 0.41 0.41<br />
9 417 468 1,2,3,4 0.50 0.50 0.44 0.44 0.48 0.48 0.41 0.41 0.39 0.39 0.49 0.49 0.41 0.41<br />
10 469 520 1,2,3,4 0.50 0.50 0.43 0.43 0.48 0.48 0.41 0.41 0.39 0.39 0.49 0.49 0.40 0.40<br />
11 521 572 1,2,3,4 0.50 0.50 0.43 0.43 0.48 0.48 0.41 0.41 0.39 0.39 0.49 0.49 0.40 0.40<br />
12 573 624 1,2,3,4 0.50 0.50 0.43 0.43 0.48 0.48 0.41 0.41 0.39 0.39 0.49 0.49 0.40 0.40<br />
13 625 676 1,2,3,4 0.50 0.50 0.42 0.42 0.48 0.48 0.41 0.41 0.39 0.39 0.49 0.49 0.40 0.40<br />
14 677 728 1,2,3,4 0.50 0.50 0.42 0.42 0.48 0.48 0.41 0.41 0.39 0.39 0.49 0.49 0.40 0.40<br />
15 729 780 1,2,3,4 0.50 0.50 0.42 0.42 0.48 0.48 0.41 0.41 0.39 0.39 0.49 0.49 0.39 0.39<br />
16 781 832 1,2,3,4 0.50 0.50 0.42 0.42 0.48 0.48 0.41 0.41 0.39 0.39 0.49 0.49 0.39 0.39<br />
17 833 884 1,2,3,4 0.50 0.50 0.42 0.42 0.48 0.48 0.40 0.40 0.39 0.39 0.48 0.48 0.39 0.39<br />
18 885 936 1,2,3,4 0.50 0.50 0.42 0.42 0.48 0.48 0.40 0.40 0.39 0.39 0.48 0.48 0.39 0.39<br />
19 937 988 1,2,3,4 0.50 0.50 0.42 0.42 0.48 0.48 0.40 0.40 0.39 0.39 0.48 0.48 0.39 0.39<br />
20 989 1040 1,2,3,4 0.50 0.50 0.41 0.41 0.48 0.48 0.40 0.40 0.39 0.39 0.48 0.48 0.39 0.39<br />
21 1041 1092 1,2,3,4 0.50 0.50 0.41 0.41 0.48 0.48 0.40 0.40 0.39 0.39 0.48 0.48 0.39 0.39<br />
22 1093 1144 1,2,3,4 0.50 0.50 0.41 0.41 0.48 0.48 0.40 0.40 0.39 0.39 0.48 0.48 0.39 0.39<br />
23 1145 1196 1,2,3,4 0.50 0.50 0.41 0.41 0.48 0.48 0.40 0.40 0.39 0.39 0.48 0.48 0.39 0.39<br />
24 1197 1248 1,2,3,4 0.50 0.50 0.41 0.41 0.48 0.48 0.40 0.40 0.39 0.39 0.48 0.48 0.39 0.39<br />
25 1249 1300 1,2,3,4 0.50 0.50 0.41 0.41 0.48 0.48 0.40 0.40 0.39 0.39 0.48 0.48 0.39 0.39<br />
26 1301 1352 1,2,3,4 0.50 0.50 0.41 0.41 0.48 0.48 0.40 0.40 0.39 0.39 0.48 0.48 0.39 0.39<br />
27 1353 1404 1,2,3,4 0.50 0.50 0.41 0.41 0.48 0.48 0.40 0.40 0.39 0.39 0.48 0.48 0.39 0.39<br />
28 1405 1456 1,2,3,4 0.50 0.50 0.41 0.41 0.48 0.48 0.40 0.40 0.39 0.39 0.48 0.48 0.39 0.39<br />
29 1457 1508 1,2,3,4 0.50 0.50 0.41 0.41 0.48 0.48 0.40 0.40 0.39 0.39 0.48 0.48 0.39 0.39<br />
30 1509 1560 1,2,3,4 0.50 0.50 0.41 0.41 0.48 0.48 0.40 0.40 0.39 0.39 0.48 0.48 0.39 0.39<br />
31 1561 1612 1,2,3,4 0.50 0.50 0.41 0.41 0.48 0.48 0.40 0.40 0.39 0.39 0.47 0.47 0.39 0.39<br />
32 1613 1664 1,2,3,4 0.50 0.50 0.41 0.41 0.48 0.48 0.40 0.40 0.39 0.39 0.47 0.47 0.39 0.39<br />
33 1665 1716 1,2,3,4 0.50 0.50 0.41 0.41 0.48 0.48 0.40 0.40 0.39 0.39 0.47 0.47 0.39 0.39<br />
34 1717 1768 1,2,3,4 0.50 0.50 0.41 0.41 0.48 0.48 0.40 0.40 0.39 0.39 0.47 0.47 0.39 0.39<br />
35 1769 1820 1,2,3,4 0.50 0.50 0.41 0.41 0.48 0.48 0.40 0.40 0.39 0.39 0.47 0.47 0.39 0.39<br />
36 1821 1872 1,2,3,4 0.50 0.50 0.41 0.41 0.48 0.48 0.40 0.40 0.39 0.39 0.47 0.47 0.39 0.39<br />
37 1873 1924 1,2,3,4 0.50 0.50 0.41 0.41 0.48 0.48 0.40 0.40 0.39 0.39 0.47 0.47 0.39 0.39<br />
38 1925 1976 1,2,3,4 0.50 0.50 0.41 0.41 0.48 0.48 0.40 0.40 0.39 0.39 0.47 0.47 0.39 0.39<br />
39 1977 2028 1,2,3,4 0.50 0.50 0.41 0.41 0.48 0.48 0.40 0.40 0.39 0.39 0.47 0.47 0.39 0.39<br />
40 2029 2080 1,2,3,4 0.50 0.50 0.41 0.41 0.48 0.48 0.40 0.40 0.39 0.39 0.47 0.47 0.39 0.39<br />
41 2081 2132 1,2,3,4 0.50 0.50 0.40 0.40 0.48 0.48 0.40 0.40 0.39 0.39 0.47 0.47 0.39 0.39<br />
42 2133 2184 1,2,3,4 0.50 0.50 0.40 0.40 0.48 0.48 0.40 0.40 0.39 0.39 0.47 0.47 0.39 0.39<br />
43 2185 2236 1,2,3,4 0.50 0.50 0.40 0.40 0.48 0.48 0.40 0.40 0.39 0.39 0.47 0.47 0.39 0.39<br />
44 2237 2288 1,2,3,4 0.50 0.50 0.40 0.40 0.48 0.48 0.40 0.40 0.39 0.39 0.47 0.47 0.39 0.39<br />
45 2289 2340 1,2,3,4 0.50 0.50 0.40 0.40 0.48 0.48 0.40 0.40 0.39 0.39 0.47 0.47 0.39 0.39<br />
46 2341 2392 1,2,3,4 0.50 0.50 0.40 0.40 0.48 0.48 0.40 0.40 0.39 0.39 0.47 0.47 0.39 0.39<br />
47 2393 2444 1,2,3,4 0.50 0.50 0.40 0.40 0.48 0.48 0.40 0.40 0.39 0.39 0.47 0.47 0.39 0.39<br />
48 2445 2496 1,2,3,4 0.50 0.50 0.40 0.40 0.48 0.48 0.40 0.40 0.39 0.39 0.47 0.47 0.39 0.39<br />
49 2497 2548 1,2,3,4 0.50 0.50 0.40 0.40 0.48 0.48 0.40 0.40 0.39 0.39 0.47 0.47 0.39 0.39<br />
50 2549 2600 1,2,3,4 0.50 0.50 0.40 0.40 0.48 0.48 0.40 0.40 0.39 0.39 0.47 0.47 0.39 0.39<br />
51 2601 2652 1,2,3,4 0.50 0.50 0.40 0.40 0.48 0.48 0.40 0.40 0.39 0.39 0.47 0.47 0.39 0.39<br />
Prediction of Contaminant Accumulation in the Upper Waitemata Harbour - COPPER TP 259 26
52 2653 2704 1,2,3,4 0.50 0.50 0.40 0.40 0.48 0.48 0.40 0.40 0.39 0.39 0.47 0.47 0.39 0.39<br />
53 2705 2756 1,2,3,4 0.50 0.50 0.40 0.40 0.48 0.48 0.40 0.40 0.39 0.39 0.47 0.47 0.39 0.39<br />
54 2757 2808 1,2,3,4 0.50 0.50 0.40 0.40 0.48 0.48 0.39 0.39 0.39 0.39 0.47 0.47 0.39 0.39<br />
/54s3a2/makec2/chs3pnnn.grf<br />
CONTAMINANT CONTROLS IN EACH<br />
SUBCATCHMENT AS A FUNCTION OF TIME<br />
54 years - Response-Envelope Scenario<br />
Maximum Attainable Controls<br />
Silt / contaminant attached to silt<br />
Hel<br />
% passed through control<br />
1.0<br />
0.8<br />
0.6<br />
0.4<br />
0.2<br />
0.0<br />
Luc<br />
Par<br />
Rar<br />
Bri<br />
Rar<br />
Wai<br />
Sand / contaminant attached to sand<br />
% passed through control<br />
1.0<br />
0.8<br />
0.6<br />
0.4<br />
0.2<br />
0.0<br />
0<br />
9<br />
18<br />
27<br />
36<br />
45<br />
54<br />
YEARS FROM 2001<br />
Prediction of Contaminant Accumulation in the Upper Waitemata Harbour - COPPER TP 259 27
3.2 Simulation period: 108 years (5616 weeks)<br />
For the 108-year simulation, the following inputs were used:<br />
• Total area of each subestuary and area of channel and banks/intertidal flats in<br />
each subestuary (Table 4.2 in Methodology Report).<br />
• Bioturbation model – uniform, with a bioturbation depth of 0.11 m.<br />
• Event time series – four different magnitude events (E1, E2, E3, E4; Table 4.3<br />
and Table 4.4 in Methodology Report) spread uniformly throughout simulation<br />
period of 108 years (1–5616 weeks, Figure A.3 in Methodology Report).<br />
• R (Figure 4.6 in Methodology Report).<br />
• R3 (Figure 4.7 in Methodology Report).<br />
• Contaminant partitioning across size fractions: as 54-year simulation.<br />
• Sediment partitioning across size fractions: as 54-year simulation.<br />
• Initial contaminant concentrations in estuarine bed sediments – size fractions: as<br />
54-year simulation.<br />
• Initial split of estuarine bed sediments into size fractions: as 54-year simulation.<br />
• Initial contaminant concentrations in estuarine bed sediments – total: as 54-year<br />
simulation.<br />
• Sediment loads – existing scenario: as 54-year simulation.<br />
• Sediment loads – development #1 scenario and response-envelope scenario: as<br />
54-year simulation.<br />
• Contaminant loads – soil (natural or “background” load): as 54-year simulation.<br />
• Contaminant loads – existing scenario, dwellings, roads, traffic (“urban” load): as<br />
54-year simulation.<br />
Prediction of Contaminant Accumulation in the Upper Waitemata Harbour - COPPER TP 259 28
• Contaminant loads – dwellings, roads, traffic (“urban load”) – development #1<br />
scenario and response-envelope scenario:<br />
Period Week Week<br />
kg copper from each subcatchment<br />
# start end 1=Hel 2=Luc 3=Par 4=Ran 5=Bri 6=Rar 7=Wai<br />
1 1 52 95.45 82.14 2.06 13.78 10.00 14.19 40.23<br />
2 53 104 95.45 87.74 2.11 13.82 10.07 14.20 40.34<br />
3 105 156 95.45 93.33 2.17 13.86 10.13 14.22 40.44<br />
4 157 208 95.45 98.96 2.22 13.89 10.20 14.23 40.58<br />
5 209 260 95.45 104.56 2.27 14.26 12.13 14.24 40.69<br />
6 261 312 95.45 111.32 2.33 14.63 14.05 14.44 46.73<br />
7 313 364 95.45 117.91 2.36 14.99 15.98 14.64 52.69<br />
8 365 416 95.45 124.43 2.40 15.36 17.91 14.84 58.58<br />
9 417 468 95.45 130.88 2.43 15.73 19.83 15.04 64.40<br />
10 469 520 95.45 137.26 2.46 16.09 21.76 15.24 70.15<br />
11 521 572 95.45 143.58 2.50 16.46 23.68 15.44 75.85<br />
12 573 624 95.45 150.77 2.51 16.82 25.61 15.66 81.49<br />
13 625 676 95.45 157.91 2.52 17.19 27.53 15.89 87.08<br />
14 677 728 95.45 164.99 2.52 17.55 29.45 16.12 92.62<br />
15 729 780 95.45 172.03 2.53 17.91 31.37 16.34 98.11<br />
16 781 832 95.45 179.03 2.54 18.28 33.30 16.57 103.56<br />
17 833 884 95.45 185.98 2.55 18.64 35.22 16.79 108.96<br />
18 885 936 95.45 192.89 2.56 19.00 37.14 17.02 114.33<br />
19 937 988 95.45 199.77 2.57 19.37 39.06 17.24 119.66<br />
20 989 1040 95.45 206.61 2.58 19.73 40.98 17.47 124.96<br />
21 1041 1092 95.45 213.43 2.59 20.09 42.89 17.70 130.22<br />
22 1093 1144 95.45 222.65 2.59 20.45 44.81 17.93 134.54<br />
23 1145 1196 95.45 231.86 2.59 20.81 46.73 18.17 138.84<br />
24 1197 1248 95.45 241.03 2.59 21.17 48.65 18.41 143.10<br />
25 1249 1300 95.45 250.18 2.59 21.20 50.56 18.64 147.34<br />
26 1301 1352 95.45 259.30 2.59 21.23 52.18 18.69 149.94<br />
27 1353 1404 95.45 268.40 2.60 21.26 53.09 18.74 152.51<br />
28 1405 1456 95.45 277.49 2.60 21.29 54.01 18.79 155.07<br />
29 1457 1508 95.45 286.55 2.60 21.32 54.92 18.84 157.60<br />
30 1509 1560 95.45 295.59 2.60 21.35 55.84 18.89 160.12<br />
31 1561 1612 95.45 304.62 2.60 21.38 56.75 18.94 162.61<br />
32 1613 1664 95.45 310.72 2.61 21.41 57.67 18.94 165.09<br />
33 1665 1716 95.45 316.81 2.61 21.44 58.58 18.94 167.56<br />
34 1717 1768 95.45 322.88 2.62 21.47 59.49 18.94 170.01<br />
35 1769 1820 95.45 328.94 2.62 21.49 60.41 18.94 172.45<br />
36 1821 1872 95.45 334.99 2.62 21.52 61.32 18.94 174.87<br />
37 1873 1924 95.45 341.02 2.63 21.55 62.23 18.94 177.29<br />
38 1925 1976 95.45 347.04 2.63 21.58 63.14 18.94 179.69<br />
39 1977 2028 95.45 353.06 2.64 21.60 64.05 18.94 182.08<br />
40 2029 2080 95.45 359.06 2.64 21.63 64.96 18.94 184.46<br />
41 2081 2132 95.45 365.05 2.65 21.65 65.87 18.94 186.83<br />
42 2133 2184 95.45 371.06 2.65 21.68 66.78 18.94 189.20<br />
43 2185 2236 95.45 377.07 2.65 21.71 67.69 18.94 191.55<br />
44 2237 2288 95.45 383.06 2.66 21.73 68.60 18.94 193.90<br />
45 2289 2340 95.45 389.05 2.66 21.76 69.51 18.94 196.24<br />
46 2341 2392 95.45 395.03 2.66 21.78 70.42 18.94 198.57<br />
47 2393 2444 95.45 401.00 2.67 21.81 71.33 18.94 200.90<br />
48 2445 2496 95.45 406.97 2.67 21.83 72.23 18.94 203.22<br />
49 2497 2548 95.45 412.93 2.67 21.85 73.14 18.94 205.53<br />
50 2549 2600 95.45 418.89 2.68 21.88 74.04 18.94 207.84<br />
51 2601 2652 95.45 424.84 2.68 21.90 74.95 18.94 210.14<br />
52 2653 2704 95.45 424.91 2.68 21.92 75.86 18.94 212.44<br />
53 2705 2756 95.45 424.98 2.68 21.95 76.76 18.94 214.74<br />
54 2757 2808 95.45 425.05 2.68 21.97 77.67 18.94 217.03<br />
55 2809 2860 95.45 425.11 2.68 21.99 78.57 18.94 219.32<br />
56 2861 2912 95.45 425.17 2.68 22.02 79.47 18.94 219.37<br />
57 2913 2964 95.45 425.22 2.68 22.04 79.51 18.94 219.43<br />
58 2965 3016 95.45 425.28 2.68 22.06 79.55 18.94 219.48<br />
59 3017 3068 95.45 425.32 2.68 22.08 79.59 18.94 219.53<br />
Prediction of Contaminant Accumulation in the Upper Waitemata Harbour - COPPER TP 259 29
60 3069 3120 95.45 425.37 2.68 22.10 79.62 18.94 219.57<br />
61 3121 3172 95.45 425.41 2.68 22.12 79.66 18.94 219.62<br />
62 3173 3224 95.45 425.45 2.68 22.15 79.69 18.94 219.66<br />
63 3225 3276 95.45 425.49 2.68 22.17 79.73 18.94 219.69<br />
64 3277 3328 95.45 425.52 2.68 22.19 79.76 18.94 219.73<br />
65 3329 3380 95.45 425.56 2.68 22.21 79.80 18.94 219.76<br />
66 3381 3432 95.45 425.59 2.68 22.23 79.83 18.94 219.79<br />
67 3433 3484 95.45 425.62 2.68 22.25 79.87 18.94 219.82<br />
68 3485 3536 95.45 425.65 2.68 22.27 79.90 18.94 219.85<br />
69 3537 3588 95.45 425.67 2.68 22.29 79.93 18.94 219.88<br />
70 3589 3640 95.45 425.70 2.68 22.31 79.97 18.94 219.90<br />
71 3641 3692 95.45 425.72 2.68 22.33 80.00 18.94 219.92<br />
72 3693 3744 95.45 425.74 2.68 22.34 80.03 18.94 219.94<br />
73 3745 3796 95.45 425.76 2.68 22.36 80.06 18.94 219.97<br />
74 3797 3848 95.45 425.78 2.68 22.38 80.10 18.94 219.98<br />
75 3849 3900 95.45 425.80 2.68 22.40 80.13 18.94 220.00<br />
76 3901 3952 95.45 425.81 2.68 22.42 80.16 18.94 220.02<br />
77 3953 4004 95.45 425.83 2.68 22.44 80.19 18.94 220.03<br />
78 4005 4056 95.45 425.85 2.68 22.46 80.22 18.94 220.05<br />
79 4057 4108 95.45 425.86 2.68 22.47 80.25 18.94 220.06<br />
80 4109 4160 95.45 425.87 2.68 22.49 80.28 18.94 220.08<br />
81 4161 4212 95.45 425.89 2.68 22.51 80.31 18.94 220.09<br />
82 4213 4264 95.45 425.90 2.68 22.53 80.34 18.94 220.10<br />
83 4265 4316 95.45 425.91 2.68 22.54 80.37 18.94 220.11<br />
84 4317 4368 95.45 425.92 2.68 22.56 80.39 18.94 220.12<br />
85 4369 4420 95.45 425.93 2.68 22.58 80.42 18.94 220.13<br />
86 4421 4472 95.45 425.94 2.68 22.59 80.45 18.94 220.14<br />
87 4473 4524 95.45 425.95 2.68 22.61 80.48 18.94 220.15<br />
88 4525 4576 95.45 425.95 2.68 22.63 80.51 18.94 220.16<br />
89 4577 4628 95.45 425.96 2.68 22.64 80.53 18.94 220.16<br />
90 4629 4680 95.45 425.97 2.68 22.66 80.56 18.94 220.17<br />
91 4681 4732 95.45 425.97 2.68 22.67 80.59 18.94 220.18<br />
92 4733 4784 95.45 425.98 2.68 22.69 80.61 18.94 220.18<br />
93 4785 4836 95.45 425.99 2.68 22.70 80.64 18.94 220.19<br />
94 4837 4888 95.45 425.99 2.68 22.72 80.67 18.94 220.20<br />
95 4889 4940 95.45 426.00 2.68 22.73 80.69 18.94 220.20<br />
96 4941 4992 95.45 426.00 2.68 22.75 80.72 18.94 220.21<br />
97 4993 5044 95.45 426.01 2.68 22.76 80.74 18.94 220.21<br />
98 5045 5096 95.45 426.01 2.68 22.78 80.77 18.94 220.22<br />
99 5097 5148 95.45 426.02 2.68 22.79 80.79 18.94 220.22<br />
100 5149 5200 95.45 426.02 2.68 22.81 80.82 18.94 220.22<br />
101 5201 5252 95.45 426.02 2.68 22.82 80.84 18.94 220.23<br />
102 5253 5304 95.45 426.03 2.68 22.84 80.86 18.94 220.23<br />
103 5305 5356 95.45 426.03 2.68 22.85 80.89 18.94 220.23<br />
104 5357 5408 95.45 426.03 2.68 22.86 80.91 18.94 220.24<br />
105 5409 5460 95.45 426.03 2.68 22.88 80.93 18.94 220.24<br />
106 5461 5512 95.45 426.04 2.68 22.89 80.96 18.94 220.24<br />
107 5513 5564 95.45 426.04 2.68 22.91 80.98 18.94 220.24<br />
108 5565 5616 95.45 426.04 2.68 22.92 81.00 18.94 220.25<br />
The next page shows a<br />
plot, with comparisons to<br />
contaminant loads used<br />
in existing scenario.<br />
Prediction of Contaminant Accumulation in the Upper Waitemata Harbour - COPPER TP 259 30
COPPER LOAD (kg) FROM EACH<br />
SUBCATCHMENT AS A FUNCTION OF TIME<br />
108 years - Development #1 Scenario c18s1c23.grf<br />
Dashed lines show contaminant loads<br />
used in existing scenario<br />
<strong>Copper</strong> load (kg)<br />
100<br />
10<br />
Hel<br />
Luc<br />
Par<br />
Ran<br />
Bri<br />
Rar<br />
Wai<br />
1<br />
0<br />
9<br />
18<br />
27<br />
36<br />
45<br />
54<br />
63<br />
72<br />
81<br />
YEARS FROM 2001<br />
90<br />
99<br />
108<br />
• Stormwater contaminant controls – existing scenario: as 54-year simulation.<br />
• Stormwater contaminant controls – development #1 scenario:<br />
Fraction of sediment load (with attached contaminant) passed through controls<br />
1=Hel 2=Luc 3=Par 4=Ran 5=Bri 6=Rar 7=Wai<br />
Period Week Week Events<br />
# start end<br />
silt sand silt sand silt sand silt sand silt sand silt sand silt sand<br />
1 1 52 1,2,3,4 1.00 1.00 0.95 0.95 1.00 1.00 0.86 0.86 0.81 0.81 1.00 1.00 0.90 0.90<br />
2 53 104 1,2,3,4 1.00 1.00 0.91 0.91 0.98 0.98 0.86 0.86 0.80 0.80 1.00 1.00 0.89 0.89<br />
3 105 156 1,2,3,4 1.00 1.00 0.88 0.88 0.97 0.97 0.86 0.86 0.80 0.80 1.00 1.00 0.89 0.89<br />
4 157 208 1,2,3,4 1.00 1.00 0.86 0.86 0.96 0.96 0.86 0.86 0.80 0.80 1.00 1.00 0.89 0.89<br />
5 209 260 1,2,3,4 1.00 1.00 0.83 0.83 0.94 0.94 0.84 0.84 0.74 0.74 1.00 1.00 0.89 0.89<br />
6 261 312 1,2,3,4 1.00 1.00 0.78 0.78 0.93 0.93 0.75 0.75 0.60 0.60 0.99 0.99 0.77 0.77<br />
7 313 364 1,2,3,4 1.00 1.00 0.76 0.76 0.92 0.92 0.74 0.74 0.58 0.58 0.98 0.98 0.72 0.72<br />
8 365 416 1,2,3,4 1.00 1.00 0.74 0.74 0.92 0.92 0.73 0.73 0.56 0.56 0.97 0.97 0.68 0.68<br />
9 417 468 1,2,3,4 1.00 1.00 0.72 0.72 0.91 0.91 0.72 0.72 0.54 0.54 0.97 0.97 0.65 0.65<br />
10 469 520 1,2,3,4 1.00 1.00 0.70 0.70 0.90 0.90 0.72 0.72 0.53 0.53 0.96 0.96 0.63 0.63<br />
11 521 572 1,2,3,4 1.00 1.00 0.69 0.69 0.89 0.89 0.71 0.71 0.52 0.52 0.95 0.95 0.61 0.61<br />
12 573 624 1,2,3,4 1.00 1.00 0.67 0.67 0.89 0.89 0.70 0.70 0.51 0.51 0.94 0.94 0.59 0.59<br />
13 625 676 1,2,3,4 1.00 1.00 0.66 0.66 0.89 0.89 0.69 0.69 0.50 0.50 0.94 0.94 0.58 0.58<br />
14 677 728 1,2,3,4 1.00 1.00 0.65 0.65 0.89 0.89 0.69 0.69 0.49 0.49 0.93 0.93 0.57 0.57<br />
15 729 780 1,2,3,4 1.00 1.00 0.64 0.64 0.89 0.89 0.68 0.68 0.49 0.49 0.92 0.92 0.56 0.56<br />
16 781 832 1,2,3,4 1.00 1.00 0.63 0.63 0.89 0.89 0.68 0.68 0.48 0.48 0.91 0.91 0.55 0.55<br />
Prediction of Contaminant Accumulation in the Upper Waitemata Harbour - COPPER TP 259 31
17 833 884 1,2,3,4 1.00 1.00 0.62 0.62 0.88 0.88 0.67 0.67 0.48 0.48 0.91 0.91 0.54 0.54<br />
18 885 936 1,2,3,4 1.00 1.00 0.61 0.61 0.88 0.88 0.66 0.66 0.47 0.47 0.90 0.90 0.53 0.53<br />
19 937 988 1,2,3,4 1.00 1.00 0.60 0.60 0.88 0.88 0.66 0.66 0.47 0.47 0.89 0.89 0.52 0.52<br />
20 989 1040 1,2,3,4 1.00 1.00 0.59 0.59 0.88 0.88 0.65 0.65 0.47 0.47 0.89 0.89 0.52 0.52<br />
21 1041 1092 1,2,3,4 1.00 1.00 0.59 0.59 0.88 0.88 0.65 0.65 0.46 0.46 0.88 0.88 0.51 0.51<br />
22 1093 1144 1,2,3,4 1.00 1.00 0.58 0.58 0.88 0.88 0.64 0.64 0.46 0.46 0.87 0.87 0.51 0.51<br />
23 1145 1196 1,2,3,4 1.00 1.00 0.57 0.57 0.88 0.88 0.64 0.64 0.46 0.46 0.87 0.87 0.50 0.50<br />
24 1197 1248 1,2,3,4 1.00 1.00 0.56 0.56 0.88 0.88 0.64 0.64 0.45 0.45 0.86 0.86 0.50 0.50<br />
25 1249 1300 1,2,3,4 1.00 1.00 0.56 0.56 0.88 0.88 0.63 0.63 0.45 0.45 0.86 0.86 0.50 0.50<br />
26 1301 1352 1,2,3,4 1.00 1.00 0.55 0.55 0.88 0.88 0.63 0.63 0.45 0.45 0.86 0.86 0.49 0.49<br />
27 1353 1404 1,2,3,4 1.00 1.00 0.55 0.55 0.88 0.88 0.63 0.63 0.45 0.45 0.85 0.85 0.49 0.49<br />
28 1405 1456 1,2,3,4 1.00 1.00 0.54 0.54 0.88 0.88 0.63 0.63 0.45 0.45 0.85 0.85 0.49 0.49<br />
29 1457 1508 1,2,3,4 1.00 1.00 0.54 0.54 0.88 0.88 0.63 0.63 0.45 0.45 0.85 0.85 0.49 0.49<br />
30 1509 1560 1,2,3,4 1.00 1.00 0.53 0.53 0.87 0.87 0.63 0.63 0.45 0.45 0.85 0.85 0.49 0.49<br />
31 1561 1612 1,2,3,4 1.00 1.00 0.53 0.53 0.87 0.87 0.63 0.63 0.45 0.45 0.85 0.85 0.49 0.49<br />
32 1613 1664 1,2,3,4 1.00 1.00 0.53 0.53 0.87 0.87 0.63 0.63 0.44 0.44 0.85 0.85 0.48 0.48<br />
33 1665 1716 1,2,3,4 1.00 1.00 0.52 0.52 0.87 0.87 0.63 0.63 0.44 0.44 0.85 0.85 0.48 0.48<br />
34 1717 1768 1,2,3,4 1.00 1.00 0.52 0.52 0.87 0.87 0.63 0.63 0.44 0.44 0.85 0.85 0.48 0.48<br />
35 1769 1820 1,2,3,4 1.00 1.00 0.52 0.52 0.87 0.87 0.63 0.63 0.44 0.44 0.85 0.85 0.48 0.48<br />
36 1821 1872 1,2,3,4 1.00 1.00 0.52 0.52 0.87 0.87 0.63 0.63 0.44 0.44 0.85 0.85 0.48 0.48<br />
37 1873 1924 1,2,3,4 1.00 1.00 0.51 0.51 0.87 0.87 0.63 0.63 0.44 0.44 0.85 0.85 0.48 0.48<br />
38 1925 1976 1,2,3,4 1.00 1.00 0.51 0.51 0.87 0.87 0.63 0.63 0.44 0.44 0.85 0.85 0.48 0.48<br />
39 1977 2028 1,2,3,4 1.00 1.00 0.51 0.51 0.87 0.87 0.63 0.63 0.44 0.44 0.85 0.85 0.47 0.47<br />
40 2029 2080 1,2,3,4 1.00 1.00 0.51 0.51 0.87 0.87 0.63 0.63 0.44 0.44 0.85 0.85 0.47 0.47<br />
41 2081 2132 1,2,3,4 1.00 1.00 0.51 0.51 0.87 0.87 0.63 0.63 0.44 0.44 0.85 0.85 0.47 0.47<br />
42 2133 2184 1,2,3,4 1.00 1.00 0.50 0.50 0.87 0.87 0.63 0.63 0.44 0.44 0.85 0.85 0.47 0.47<br />
43 2185 2236 1,2,3,4 1.00 1.00 0.50 0.50 0.87 0.87 0.62 0.62 0.44 0.44 0.85 0.85 0.47 0.47<br />
44 2237 2288 1,2,3,4 1.00 1.00 0.50 0.50 0.86 0.86 0.62 0.62 0.44 0.44 0.85 0.85 0.47 0.47<br />
45 2289 2340 1,2,3,4 1.00 1.00 0.50 0.50 0.86 0.86 0.62 0.62 0.43 0.43 0.85 0.85 0.47 0.47<br />
46 2341 2392 1,2,3,4 1.00 1.00 0.50 0.50 0.86 0.86 0.62 0.62 0.43 0.43 0.85 0.85 0.47 0.47<br />
47 2393 2444 1,2,3,4 1.00 1.00 0.50 0.50 0.86 0.86 0.62 0.62 0.43 0.43 0.85 0.85 0.47 0.47<br />
48 2445 2496 1,2,3,4 1.00 1.00 0.49 0.49 0.86 0.86 0.62 0.62 0.43 0.43 0.85 0.85 0.47 0.47<br />
49 2497 2548 1,2,3,4 1.00 1.00 0.49 0.49 0.86 0.86 0.62 0.62 0.43 0.43 0.85 0.85 0.46 0.46<br />
50 2549 2600 1,2,3,4 1.00 1.00 0.49 0.49 0.86 0.86 0.62 0.62 0.43 0.43 0.85 0.85 0.46 0.46<br />
51 2601 2652 1,2,3,4 1.00 1.00 0.49 0.49 0.86 0.86 0.62 0.62 0.43 0.43 0.85 0.85 0.46 0.46<br />
52 2653 2704 1,2,3,4 1.00 1.00 0.49 0.49 0.86 0.86 0.62 0.62 0.43 0.43 0.85 0.85 0.46 0.46<br />
53 2705 2756 1,2,3,4 1.00 1.00 0.49 0.49 0.86 0.86 0.62 0.62 0.43 0.43 0.85 0.85 0.46 0.46<br />
54 2757 2808 1,2,3,4 1.00 1.00 0.49 0.49 0.86 0.86 0.62 0.62 0.43 0.43 0.85 0.85 0.46 0.46<br />
55 2809 2860 1,2,3,4 1.00 1.00 0.49 0.49 0.86 0.86 0.62 0.62 0.43 0.43 0.85 0.85 0.46 0.46<br />
56 2861 2912 1,2,3,4 1.00 1.00 0.49 0.49 0.86 0.86 0.62 0.62 0.43 0.43 0.85 0.85 0.46 0.46<br />
57 2913 2964 1,2,3,4 1.00 1.00 0.49 0.49 0.86 0.86 0.62 0.62 0.43 0.43 0.85 0.85 0.46 0.46<br />
58 2965 3016 1,2,3,4 1.00 1.00 0.49 0.49 0.86 0.86 0.62 0.62 0.43 0.43 0.85 0.85 0.46 0.46<br />
59 3017 3068 1,2,3,4 1.00 1.00 0.49 0.49 0.86 0.86 0.62 0.62 0.43 0.43 0.85 0.85 0.46 0.46<br />
60 3069 3120 1,2,3,4 1.00 1.00 0.49 0.49 0.86 0.86 0.62 0.62 0.43 0.43 0.85 0.85 0.46 0.46<br />
61 3121 3172 1,2,3,4 1.00 1.00 0.49 0.49 0.86 0.86 0.62 0.62 0.43 0.43 0.85 0.85 0.46 0.46<br />
62 3173 3224 1,2,3,4 1.00 1.00 0.49 0.49 0.86 0.86 0.62 0.62 0.43 0.43 0.85 0.85 0.46 0.46<br />
63 3225 3276 1,2,3,4 1.00 1.00 0.49 0.49 0.86 0.86 0.62 0.62 0.43 0.43 0.85 0.85 0.46 0.46<br />
64 3277 3328 1,2,3,4 1.00 1.00 0.49 0.49 0.86 0.86 0.62 0.62 0.43 0.43 0.85 0.85 0.46 0.46<br />
65 3329 3380 1,2,3,4 1.00 1.00 0.49 0.49 0.86 0.86 0.62 0.62 0.43 0.43 0.85 0.85 0.46 0.46<br />
66 3381 3432 1,2,3,4 1.00 1.00 0.49 0.49 0.86 0.86 0.61 0.61 0.43 0.43 0.85 0.85 0.46 0.46<br />
67 3433 3484 1,2,3,4 1.00 1.00 0.49 0.49 0.86 0.86 0.61 0.61 0.43 0.43 0.85 0.85 0.46 0.46<br />
68 3485 3536 1,2,3,4 1.00 1.00 0.49 0.49 0.86 0.86 0.61 0.61 0.43 0.43 0.85 0.85 0.46 0.46<br />
69 3537 3588 1,2,3,4 1.00 1.00 0.49 0.49 0.86 0.86 0.61 0.61 0.43 0.43 0.85 0.85 0.46 0.46<br />
70 3589 3640 1,2,3,4 1.00 1.00 0.49 0.49 0.86 0.86 0.61 0.61 0.43 0.43 0.85 0.85 0.46 0.46<br />
71 3641 3692 1,2,3,4 1.00 1.00 0.49 0.49 0.86 0.86 0.61 0.61 0.43 0.43 0.85 0.85 0.46 0.46<br />
72 3693 3744 1,2,3,4 1.00 1.00 0.49 0.49 0.86 0.86 0.61 0.61 0.43 0.43 0.85 0.85 0.46 0.46<br />
73 3745 3796 1,2,3,4 1.00 1.00 0.49 0.49 0.86 0.86 0.61 0.61 0.43 0.43 0.85 0.85 0.46 0.46<br />
74 3797 3848 1,2,3,4 1.00 1.00 0.49 0.49 0.86 0.86 0.61 0.61 0.43 0.43 0.85 0.85 0.46 0.46<br />
75 3849 3900 1,2,3,4 1.00 1.00 0.49 0.49 0.86 0.86 0.61 0.61 0.43 0.43 0.85 0.85 0.46 0.46<br />
76 3901 3952 1,2,3,4 1.00 1.00 0.49 0.49 0.86 0.86 0.61 0.61 0.43 0.43 0.85 0.85 0.46 0.46<br />
77 3953 4004 1,2,3,4 1.00 1.00 0.49 0.49 0.86 0.86 0.61 0.61 0.43 0.43 0.85 0.85 0.46 0.46<br />
78 4005 4056 1,2,3,4 1.00 1.00 0.49 0.49 0.86 0.86 0.61 0.61 0.43 0.43 0.85 0.85 0.46 0.46<br />
79 4057 4108 1,2,3,4 1.00 1.00 0.49 0.49 0.86 0.86 0.61 0.61 0.43 0.43 0.85 0.85 0.46 0.46<br />
Prediction of Contaminant Accumulation in the Upper Waitemata Harbour - COPPER TP 259 32
80 4109 4160 1,2,3,4 1.00 1.00 0.49 0.49 0.86 0.86 0.61 0.61 0.43 0.43 0.85 0.85 0.46 0.46<br />
81 4161 4212 1,2,3,4 1.00 1.00 0.49 0.49 0.86 0.86 0.61 0.61 0.43 0.43 0.85 0.85 0.46 0.46<br />
82 4213 4264 1,2,3,4 1.00 1.00 0.49 0.49 0.86 0.86 0.61 0.61 0.43 0.43 0.85 0.85 0.46 0.46<br />
83 4265 4316 1,2,3,4 1.00 1.00 0.49 0.49 0.86 0.86 0.61 0.61 0.43 0.43 0.85 0.85 0.46 0.46<br />
84 4317 4368 1,2,3,4 1.00 1.00 0.49 0.49 0.86 0.86 0.61 0.61 0.43 0.43 0.85 0.85 0.46 0.46<br />
85 4369 4420 1,2,3,4 1.00 1.00 0.49 0.49 0.86 0.86 0.61 0.61 0.43 0.43 0.85 0.85 0.46 0.46<br />
86 4421 4472 1,2,3,4 1.00 1.00 0.49 0.49 0.86 0.86 0.61 0.61 0.43 0.43 0.85 0.85 0.46 0.46<br />
87 4473 4524 1,2,3,4 1.00 1.00 0.49 0.49 0.86 0.86 0.61 0.61 0.43 0.43 0.85 0.85 0.46 0.46<br />
88 4525 4576 1,2,3,4 1.00 1.00 0.49 0.49 0.86 0.86 0.61 0.61 0.43 0.43 0.85 0.85 0.46 0.46<br />
89 4577 4628 1,2,3,4 1.00 1.00 0.49 0.49 0.86 0.86 0.61 0.61 0.43 0.43 0.85 0.85 0.46 0.46<br />
90 4629 4680 1,2,3,4 1.00 1.00 0.49 0.49 0.86 0.86 0.61 0.61 0.43 0.43 0.85 0.85 0.46 0.46<br />
91 4681 4732 1,2,3,4 1.00 1.00 0.49 0.49 0.86 0.86 0.61 0.61 0.43 0.43 0.85 0.85 0.46 0.46<br />
92 4733 4784 1,2,3,4 1.00 1.00 0.49 0.49 0.86 0.86 0.61 0.61 0.43 0.43 0.85 0.85 0.46 0.46<br />
93 4785 4836 1,2,3,4 1.00 1.00 0.49 0.49 0.86 0.86 0.61 0.61 0.43 0.43 0.85 0.85 0.46 0.46<br />
94 4837 4888 1,2,3,4 1.00 1.00 0.49 0.49 0.86 0.86 0.61 0.61 0.43 0.43 0.85 0.85 0.46 0.46<br />
95 4889 4940 1,2,3,4 1.00 1.00 0.49 0.49 0.86 0.86 0.61 0.61 0.43 0.43 0.85 0.85 0.46 0.46<br />
96 4941 4992 1,2,3,4 1.00 1.00 0.49 0.49 0.86 0.86 0.61 0.61 0.43 0.43 0.85 0.85 0.46 0.46<br />
97 4993 5044 1,2,3,4 1.00 1.00 0.49 0.49 0.86 0.86 0.61 0.61 0.43 0.43 0.85 0.85 0.46 0.46<br />
98 5045 5096 1,2,3,4 1.00 1.00 0.49 0.49 0.86 0.86 0.60 0.60 0.43 0.43 0.85 0.85 0.46 0.46<br />
99 5097 5148 1,2,3,4 1.00 1.00 0.49 0.49 0.86 0.86 0.60 0.60 0.43 0.43 0.85 0.85 0.46 0.46<br />
100 5149 5200 1,2,3,4 1.00 1.00 0.49 0.49 0.86 0.86 0.60 0.60 0.43 0.43 0.85 0.85 0.46 0.46<br />
101 5201 5252 1,2,3,4 1.00 1.00 0.49 0.49 0.86 0.86 0.60 0.60 0.43 0.43 0.85 0.85 0.46 0.46<br />
102 5253 5304 1,2,3,4 1.00 1.00 0.49 0.49 0.86 0.86 0.60 0.60 0.43 0.43 0.85 0.85 0.46 0.46<br />
103 5305 5356 1,2,3,4 1.00 1.00 0.49 0.49 0.86 0.86 0.60 0.60 0.43 0.43 0.85 0.85 0.46 0.46<br />
104 5357 5408 1,2,3,4 1.00 1.00 0.49 0.49 0.86 0.86 0.60 0.60 0.43 0.43 0.85 0.85 0.46 0.46<br />
105 5409 5460 1,2,3,4 1.00 1.00 0.49 0.49 0.86 0.86 0.60 0.60 0.43 0.43 0.85 0.85 0.46 0.46<br />
106 5461 5512 1,2,3,4 1.00 1.00 0.49 0.49 0.86 0.86 0.60 0.60 0.43 0.43 0.85 0.85 0.46 0.46<br />
107 5513 5564 1,2,3,4 1.00 1.00 0.49 0.49 0.86 0.86 0.60 0.60 0.43 0.43 0.85 0.85 0.46 0.46<br />
108 5565 5616 1,2,3,4 1.00 1.00 0.49 0.49 0.86 0.86 0.60 0.60 0.43 0.43 0.85 0.85 0.46 0.46<br />
The next page shows a plot.<br />
Prediction of Contaminant Accumulation in the Upper Waitemata Harbour - COPPER TP 259 33
CONTAMINANT CONTROLS IN EACH<br />
SUBCATCHMENT AS A FUNCTION OF TIME<br />
108 years - Development #1 Scenario cgs2pnnn.grf<br />
Silt / contaminant attached to silt<br />
Hel<br />
% passed through control<br />
1.0<br />
0.8<br />
0.6<br />
0.4<br />
0.2<br />
0.0<br />
Sand / contaminant attached to sand<br />
Luc<br />
Par<br />
Rar<br />
Bri<br />
Rar<br />
Wai<br />
1.0<br />
0.8<br />
0.6<br />
0.4<br />
0.2<br />
0.0<br />
0<br />
9<br />
18<br />
27<br />
% passed through control<br />
36<br />
45<br />
54<br />
63<br />
72<br />
81<br />
90<br />
99<br />
108<br />
YEARS FROM 2001<br />
• Stormwater contaminant controls – response-envelope scenario, zero controls:<br />
as 54-year simulation.<br />
Prediction of Contaminant Accumulation in the Upper Waitemata Harbour - COPPER TP 259 34
• Stormwater contaminant controls – response-envelope scenario, maximum<br />
attainable controls:<br />
Fraction of sediment load (with attached contaminant) passed through controls<br />
1=Hel 2=Luc 3=Par 4=Ran 5=Bri 6=Rar 7=Wai<br />
Period Week Week Events<br />
# start end<br />
silt sand silt sand silt sand silt sand silt sand silt sand silt sand<br />
1 1 52 1,2,3,4 0.50 0.50 0.50 0.50 0.50 0.50 0.50 0.50 0.50 0.50 0.50 0.50 0.50 0.50<br />
2 53 104 1,2,3,4 0.50 0.50 0.49 0.49 0.50 0.50 0.50 0.50 0.50 0.50 0.50 0.50 0.50 0.50<br />
3 105 156 1,2,3,4 0.50 0.50 0.49 0.49 0.50 0.50 0.50 0.50 0.50 0.50 0.50 0.50 0.50 0.50<br />
4 157 208 1,2,3,4 0.50 0.50 0.48 0.48 0.49 0.49 0.50 0.50 0.50 0.50 0.50 0.50 0.50 0.50<br />
5 209 260 1,2,3,4 0.50 0.50 0.48 0.48 0.49 0.49 0.50 0.50 0.48 0.48 0.50 0.50 0.50 0.50<br />
6 261 312 1,2,3,4 0.50 0.50 0.45 0.45 0.49 0.49 0.41 0.41 0.38 0.38 0.50 0.50 0.42 0.42<br />
7 313 364 1,2,3,4 0.50 0.50 0.44 0.44 0.49 0.49 0.41 0.41 0.39 0.39 0.50 0.50 0.42 0.42<br />
8 365 416 1,2,3,4 0.50 0.50 0.44 0.44 0.49 0.49 0.41 0.41 0.39 0.39 0.50 0.50 0.41 0.41<br />
9 417 468 1,2,3,4 0.50 0.50 0.44 0.44 0.48 0.48 0.41 0.41 0.39 0.39 0.49 0.49 0.41 0.41<br />
10 469 520 1,2,3,4 0.50 0.50 0.43 0.43 0.48 0.48 0.41 0.41 0.39 0.39 0.49 0.49 0.40 0.40<br />
11 521 572 1,2,3,4 0.50 0.50 0.43 0.43 0.48 0.48 0.41 0.41 0.39 0.39 0.49 0.49 0.40 0.40<br />
12 573 624 1,2,3,4 0.50 0.50 0.43 0.43 0.48 0.48 0.41 0.41 0.39 0.39 0.49 0.49 0.40 0.40<br />
13 625 676 1,2,3,4 0.50 0.50 0.42 0.42 0.48 0.48 0.41 0.41 0.39 0.39 0.49 0.49 0.40 0.40<br />
14 677 728 1,2,3,4 0.50 0.50 0.42 0.42 0.48 0.48 0.41 0.41 0.39 0.39 0.49 0.49 0.40 0.40<br />
15 729 780 1,2,3,4 0.50 0.50 0.42 0.42 0.48 0.48 0.41 0.41 0.39 0.39 0.49 0.49 0.39 0.39<br />
16 781 832 1,2,3,4 0.50 0.50 0.42 0.42 0.48 0.48 0.41 0.41 0.39 0.39 0.49 0.49 0.39 0.39<br />
17 833 884 1,2,3,4 0.50 0.50 0.42 0.42 0.48 0.48 0.40 0.40 0.39 0.39 0.48 0.48 0.39 0.39<br />
18 885 936 1,2,3,4 0.50 0.50 0.42 0.42 0.48 0.48 0.40 0.40 0.39 0.39 0.48 0.48 0.39 0.39<br />
19 937 988 1,2,3,4 0.50 0.50 0.42 0.42 0.48 0.48 0.40 0.40 0.39 0.39 0.48 0.48 0.39 0.39<br />
20 989 1040 1,2,3,4 0.50 0.50 0.41 0.41 0.48 0.48 0.40 0.40 0.39 0.39 0.48 0.48 0.39 0.39<br />
21 1041 1092 1,2,3,4 0.50 0.50 0.41 0.41 0.48 0.48 0.40 0.40 0.39 0.39 0.48 0.48 0.39 0.39<br />
22 1093 1144 1,2,3,4 0.50 0.50 0.41 0.41 0.48 0.48 0.40 0.40 0.39 0.39 0.48 0.48 0.39 0.39<br />
23 1145 1196 1,2,3,4 0.50 0.50 0.41 0.41 0.48 0.48 0.40 0.40 0.39 0.39 0.48 0.48 0.39 0.39<br />
24 1197 1248 1,2,3,4 0.50 0.50 0.41 0.41 0.48 0.48 0.40 0.40 0.39 0.39 0.48 0.48 0.39 0.39<br />
25 1249 1300 1,2,3,4 0.50 0.50 0.41 0.41 0.48 0.48 0.40 0.40 0.39 0.39 0.48 0.48 0.39 0.39<br />
26 1301 1352 1,2,3,4 0.50 0.50 0.41 0.41 0.48 0.48 0.40 0.40 0.39 0.39 0.48 0.48 0.39 0.39<br />
27 1353 1404 1,2,3,4 0.50 0.50 0.41 0.41 0.48 0.48 0.40 0.40 0.39 0.39 0.48 0.48 0.39 0.39<br />
28 1405 1456 1,2,3,4 0.50 0.50 0.41 0.41 0.48 0.48 0.40 0.40 0.39 0.39 0.48 0.48 0.39 0.39<br />
29 1457 1508 1,2,3,4 0.50 0.50 0.41 0.41 0.48 0.48 0.40 0.40 0.39 0.39 0.48 0.48 0.39 0.39<br />
30 1509 1560 1,2,3,4 0.50 0.50 0.41 0.41 0.48 0.48 0.40 0.40 0.39 0.39 0.48 0.48 0.39 0.39<br />
31 1561 1612 1,2,3,4 0.50 0.50 0.41 0.41 0.48 0.48 0.40 0.40 0.39 0.39 0.47 0.47 0.39 0.39<br />
32 1613 1664 1,2,3,4 0.50 0.50 0.41 0.41 0.48 0.48 0.40 0.40 0.39 0.39 0.47 0.47 0.39 0.39<br />
33 1665 1716 1,2,3,4 0.50 0.50 0.41 0.41 0.48 0.48 0.40 0.40 0.39 0.39 0.47 0.47 0.39 0.39<br />
34 1717 1768 1,2,3,4 0.50 0.50 0.41 0.41 0.48 0.48 0.40 0.40 0.39 0.39 0.47 0.47 0.39 0.39<br />
35 1769 1820 1,2,3,4 0.50 0.50 0.41 0.41 0.48 0.48 0.40 0.40 0.39 0.39 0.47 0.47 0.39 0.39<br />
36 1821 1872 1,2,3,4 0.50 0.50 0.41 0.41 0.48 0.48 0.40 0.40 0.39 0.39 0.47 0.47 0.39 0.39<br />
37 1873 1924 1,2,3,4 0.50 0.50 0.41 0.41 0.48 0.48 0.40 0.40 0.39 0.39 0.47 0.47 0.39 0.39<br />
38 1925 1976 1,2,3,4 0.50 0.50 0.41 0.41 0.48 0.48 0.40 0.40 0.39 0.39 0.47 0.47 0.39 0.39<br />
39 1977 2028 1,2,3,4 0.50 0.50 0.41 0.41 0.48 0.48 0.40 0.40 0.39 0.39 0.47 0.47 0.39 0.39<br />
40 2029 2080 1,2,3,4 0.50 0.50 0.41 0.41 0.48 0.48 0.40 0.40 0.39 0.39 0.47 0.47 0.39 0.39<br />
41 2081 2132 1,2,3,4 0.50 0.50 0.40 0.40 0.48 0.48 0.40 0.40 0.39 0.39 0.47 0.47 0.39 0.39<br />
42 2133 2184 1,2,3,4 0.50 0.50 0.40 0.40 0.48 0.48 0.40 0.40 0.39 0.39 0.47 0.47 0.39 0.39<br />
43 2185 2236 1,2,3,4 0.50 0.50 0.40 0.40 0.48 0.48 0.40 0.40 0.39 0.39 0.47 0.47 0.39 0.39<br />
44 2237 2288 1,2,3,4 0.50 0.50 0.40 0.40 0.48 0.48 0.40 0.40 0.39 0.39 0.47 0.47 0.39 0.39<br />
45 2289 2340 1,2,3,4 0.50 0.50 0.40 0.40 0.48 0.48 0.40 0.40 0.39 0.39 0.47 0.47 0.39 0.39<br />
46 2341 2392 1,2,3,4 0.50 0.50 0.40 0.40 0.48 0.48 0.40 0.40 0.39 0.39 0.47 0.47 0.39 0.39<br />
47 2393 2444 1,2,3,4 0.50 0.50 0.40 0.40 0.48 0.48 0.40 0.40 0.39 0.39 0.47 0.47 0.39 0.39<br />
48 2445 2496 1,2,3,4 0.50 0.50 0.40 0.40 0.48 0.48 0.40 0.40 0.39 0.39 0.47 0.47 0.39 0.39<br />
49 2497 2548 1,2,3,4 0.50 0.50 0.40 0.40 0.48 0.48 0.40 0.40 0.39 0.39 0.47 0.47 0.39 0.39<br />
50 2549 2600 1,2,3,4 0.50 0.50 0.40 0.40 0.48 0.48 0.40 0.40 0.39 0.39 0.47 0.47 0.39 0.39<br />
51 2601 2652 1,2,3,4 0.50 0.50 0.40 0.40 0.48 0.48 0.40 0.40 0.39 0.39 0.47 0.47 0.39 0.39<br />
Prediction of Contaminant Accumulation in the Upper Waitemata Harbour - COPPER TP 259 35
52 2653 2704 1,2,3,4 0.50 0.50 0.40 0.40 0.48 0.48 0.40 0.40 0.39 0.39 0.47 0.47 0.39 0.39<br />
53 2705 2756 1,2,3,4 0.50 0.50 0.40 0.40 0.48 0.48 0.40 0.40 0.39 0.39 0.47 0.47 0.39 0.39<br />
54 2757 2808 1,2,3,4 0.50 0.50 0.40 0.40 0.48 0.48 0.39 0.39 0.39 0.39 0.47 0.47 0.39 0.39<br />
55 2809 2860 1,2,3,4 0.50 0.50 0.40 0.40 0.48 0.48 0.39 0.39 0.39 0.39 0.47 0.47 0.39 0.39<br />
56 2861 2912 1,2,3,4 0.50 0.50 0.40 0.40 0.48 0.48 0.39 0.39 0.39 0.39 0.47 0.47 0.39 0.39<br />
57 2913 2964 1,2,3,4 0.50 0.50 0.40 0.40 0.48 0.48 0.39 0.39 0.39 0.39 0.47 0.47 0.39 0.39<br />
58 2965 3016 1,2,3,4 0.50 0.50 0.40 0.40 0.48 0.48 0.39 0.39 0.39 0.39 0.47 0.47 0.39 0.39<br />
59 3017 3068 1,2,3,4 0.50 0.50 0.40 0.40 0.48 0.48 0.39 0.39 0.39 0.39 0.47 0.47 0.39 0.39<br />
60 3069 3120 1,2,3,4 0.50 0.50 0.40 0.40 0.48 0.48 0.39 0.39 0.39 0.39 0.47 0.47 0.39 0.39<br />
61 3121 3172 1,2,3,4 0.50 0.50 0.40 0.40 0.48 0.48 0.39 0.39 0.39 0.39 0.47 0.47 0.39 0.39<br />
62 3173 3224 1,2,3,4 0.50 0.50 0.40 0.40 0.48 0.48 0.39 0.39 0.39 0.39 0.47 0.47 0.39 0.39<br />
63 3225 3276 1,2,3,4 0.50 0.50 0.40 0.40 0.48 0.48 0.39 0.39 0.39 0.39 0.47 0.47 0.39 0.39<br />
64 3277 3328 1,2,3,4 0.50 0.50 0.40 0.40 0.48 0.48 0.39 0.39 0.39 0.39 0.47 0.47 0.39 0.39<br />
65 3329 3380 1,2,3,4 0.50 0.50 0.40 0.40 0.48 0.48 0.39 0.39 0.39 0.39 0.47 0.47 0.39 0.39<br />
66 3381 3432 1,2,3,4 0.50 0.50 0.40 0.40 0.48 0.48 0.39 0.39 0.39 0.39 0.47 0.47 0.39 0.39<br />
67 3433 3484 1,2,3,4 0.50 0.50 0.40 0.40 0.48 0.48 0.39 0.39 0.39 0.39 0.47 0.47 0.39 0.39<br />
68 3485 3536 1,2,3,4 0.50 0.50 0.40 0.40 0.48 0.48 0.39 0.39 0.39 0.39 0.47 0.47 0.39 0.39<br />
69 3537 3588 1,2,3,4 0.50 0.50 0.40 0.40 0.48 0.48 0.39 0.39 0.39 0.39 0.47 0.47 0.39 0.39<br />
70 3589 3640 1,2,3,4 0.50 0.50 0.40 0.40 0.48 0.48 0.39 0.39 0.39 0.39 0.47 0.47 0.39 0.39<br />
71 3641 3692 1,2,3,4 0.50 0.50 0.40 0.40 0.48 0.48 0.39 0.39 0.39 0.39 0.47 0.47 0.39 0.39<br />
72 3693 3744 1,2,3,4 0.50 0.50 0.40 0.40 0.48 0.48 0.39 0.39 0.39 0.39 0.47 0.47 0.39 0.39<br />
73 3745 3796 1,2,3,4 0.50 0.50 0.40 0.40 0.48 0.48 0.39 0.39 0.39 0.39 0.47 0.47 0.39 0.39<br />
74 3797 3848 1,2,3,4 0.50 0.50 0.40 0.40 0.48 0.48 0.39 0.39 0.39 0.39 0.47 0.47 0.39 0.39<br />
75 3849 3900 1,2,3,4 0.50 0.50 0.40 0.40 0.48 0.48 0.39 0.39 0.39 0.39 0.47 0.47 0.39 0.39<br />
76 3901 3952 1,2,3,4 0.50 0.50 0.40 0.40 0.48 0.48 0.39 0.39 0.39 0.39 0.47 0.47 0.39 0.39<br />
77 3953 4004 1,2,3,4 0.50 0.50 0.40 0.40 0.48 0.48 0.39 0.39 0.39 0.39 0.47 0.47 0.39 0.39<br />
78 4005 4056 1,2,3,4 0.50 0.50 0.40 0.40 0.48 0.48 0.39 0.39 0.39 0.39 0.47 0.47 0.39 0.39<br />
79 4057 4108 1,2,3,4 0.50 0.50 0.40 0.40 0.48 0.48 0.39 0.39 0.39 0.39 0.47 0.47 0.39 0.39<br />
80 4109 4160 1,2,3,4 0.50 0.50 0.40 0.40 0.48 0.48 0.39 0.39 0.39 0.39 0.47 0.47 0.39 0.39<br />
81 4161 4212 1,2,3,4 0.50 0.50 0.40 0.40 0.48 0.48 0.39 0.39 0.39 0.39 0.47 0.47 0.39 0.39<br />
82 4213 4264 1,2,3,4 0.50 0.50 0.40 0.40 0.48 0.48 0.39 0.39 0.39 0.39 0.47 0.47 0.39 0.39<br />
83 4265 4316 1,2,3,4 0.50 0.50 0.40 0.40 0.48 0.48 0.39 0.39 0.39 0.39 0.47 0.47 0.39 0.39<br />
84 4317 4368 1,2,3,4 0.50 0.50 0.40 0.40 0.48 0.48 0.39 0.39 0.39 0.39 0.47 0.47 0.39 0.39<br />
85 4369 4420 1,2,3,4 0.50 0.50 0.40 0.40 0.48 0.48 0.39 0.39 0.39 0.39 0.47 0.47 0.39 0.39<br />
86 4421 4472 1,2,3,4 0.50 0.50 0.40 0.40 0.48 0.48 0.39 0.39 0.39 0.39 0.47 0.47 0.39 0.39<br />
87 4473 4524 1,2,3,4 0.50 0.50 0.40 0.40 0.48 0.48 0.39 0.39 0.39 0.39 0.47 0.47 0.39 0.39<br />
88 4525 4576 1,2,3,4 0.50 0.50 0.40 0.40 0.48 0.48 0.39 0.39 0.39 0.39 0.47 0.47 0.39 0.39<br />
89 4577 4628 1,2,3,4 0.50 0.50 0.40 0.40 0.48 0.48 0.39 0.39 0.39 0.39 0.47 0.47 0.39 0.39<br />
90 4629 4680 1,2,3,4 0.50 0.50 0.40 0.40 0.48 0.48 0.39 0.39 0.39 0.39 0.47 0.47 0.39 0.39<br />
91 4681 4732 1,2,3,4 0.50 0.50 0.40 0.40 0.48 0.48 0.39 0.39 0.39 0.39 0.47 0.47 0.39 0.39<br />
92 4733 4784 1,2,3,4 0.50 0.50 0.40 0.40 0.48 0.48 0.39 0.39 0.39 0.39 0.47 0.47 0.39 0.39<br />
93 4785 4836 1,2,3,4 0.50 0.50 0.40 0.40 0.48 0.48 0.39 0.39 0.39 0.39 0.47 0.47 0.39 0.39<br />
94 4837 4888 1,2,3,4 0.50 0.50 0.40 0.40 0.48 0.48 0.39 0.39 0.39 0.39 0.47 0.47 0.39 0.39<br />
95 4889 4940 1,2,3,4 0.50 0.50 0.40 0.40 0.48 0.48 0.39 0.39 0.39 0.39 0.47 0.47 0.39 0.39<br />
96 4941 4992 1,2,3,4 0.50 0.50 0.40 0.40 0.48 0.48 0.39 0.39 0.39 0.39 0.47 0.47 0.39 0.39<br />
97 4993 5044 1,2,3,4 0.50 0.50 0.40 0.40 0.48 0.48 0.39 0.39 0.39 0.39 0.47 0.47 0.39 0.39<br />
98 5045 5096 1,2,3,4 0.50 0.50 0.40 0.40 0.48 0.48 0.39 0.39 0.39 0.39 0.47 0.47 0.39 0.39<br />
99 5097 5148 1,2,3,4 0.50 0.50 0.40 0.40 0.48 0.48 0.39 0.39 0.39 0.39 0.47 0.47 0.39 0.39<br />
100 5149 5200 1,2,3,4 0.50 0.50 0.40 0.40 0.48 0.48 0.39 0.39 0.39 0.39 0.47 0.47 0.39 0.39<br />
101 5201 5252 1,2,3,4 0.50 0.50 0.40 0.40 0.48 0.48 0.39 0.39 0.39 0.39 0.47 0.47 0.39 0.39<br />
102 5253 5304 1,2,3,4 0.50 0.50 0.40 0.40 0.48 0.48 0.39 0.39 0.39 0.39 0.47 0.47 0.39 0.39<br />
103 5305 5356 1,2,3,4 0.50 0.50 0.40 0.40 0.48 0.48 0.39 0.39 0.39 0.39 0.47 0.47 0.39 0.39<br />
104 5357 5408 1,2,3,4 0.50 0.50 0.40 0.40 0.48 0.48 0.39 0.39 0.39 0.39 0.47 0.47 0.39 0.39<br />
105 5409 5460 1,2,3,4 0.50 0.50 0.40 0.40 0.48 0.48 0.39 0.39 0.39 0.39 0.47 0.47 0.39 0.39<br />
106 5461 5512 1,2,3,4 0.50 0.50 0.40 0.40 0.48 0.48 0.39 0.39 0.39 0.39 0.47 0.47 0.39 0.39<br />
107 5513 5564 1,2,3,4 0.50 0.50 0.40 0.40 0.48 0.48 0.39 0.39 0.39 0.39 0.47 0.47 0.39 0.39<br />
108 5565 5616 1,2,3,4 0.50 0.50 0.40 0.40 0.48 0.48 0.39 0.39 0.39 0.39 0.47 0.47 0.39 0.39<br />
The next page shows a plot.<br />
Prediction of Contaminant Accumulation in the Upper Waitemata Harbour - COPPER TP 259 36
54s3a2/makec2/chs4pnnn.grf<br />
CONTAMINANT CONTROLS IN EACH<br />
SUBCATCHMENT AS A FUNCTION OF TIME<br />
108 years - Response-Envelope Scenario<br />
Maximum Attainable Controls<br />
% passed through control<br />
1.0<br />
0.8<br />
0.6<br />
0.4<br />
0.2<br />
0.0<br />
Silt / contaminant attached to silt<br />
Hel<br />
Luc<br />
Par<br />
Rar<br />
Bri<br />
Rar<br />
Wai<br />
Sand / contaminant attached to sand<br />
% passed through control<br />
1.0<br />
0.8<br />
0.6<br />
0.4<br />
0.2<br />
0.0<br />
0<br />
9<br />
18<br />
27<br />
36<br />
45<br />
54<br />
63<br />
72<br />
81<br />
90<br />
99<br />
108<br />
YEARS FROM 2001<br />
Prediction of Contaminant Accumulation in the Upper Waitemata Harbour - COPPER TP 259 37
4. <strong>Results</strong><br />
A range of results is presented in this section, for both 54-year and 108-year simulations,<br />
including:<br />
• Contaminant concentrations in the harbour:<br />
(a) Existing scenario versus development #1 scenario<br />
(b) Response envelope around development #1 scenario<br />
• Time for total-sediment concentrations to reach “traffic lights”:<br />
(a) Existing scenario versus development #1 scenario<br />
(b) Response envelope around development #1 scenario<br />
• Sedimentation 2 in the harbour:<br />
(a) Existing scenario versus development #1 scenario<br />
(b) Response envelope around development #1 scenario<br />
• Origin of sediments 2 2 / contaminants that deposit in harbour (%):<br />
(a) Existing scenario versus development #1 scenario<br />
• Origin of sediments 2 / contaminants that deposit in harbour (mass):<br />
(a) Existing scenario versus development #1 scenario<br />
• Fate of sediments 2 / contaminants that derive from land (%):<br />
(a) Existing scenario versus development #1 scenario<br />
• Fate of sediments 2 / contaminants that derive from land (mass):<br />
(a) Existing scenario versus development #1 scenario<br />
2 Refer to the zinc results report (NIWA Client Report HAM2003-087/2 – <strong>Results</strong>: Zinc) for sediment results.<br />
Prediction of Contaminant Accumulation in the Upper Waitemata Harbour - COPPER TP 259 38
4.1 Simulation period: 54 years<br />
Prediction of Contaminant Accumulation in the Upper Waitemata Harbour - COPPER TP 259 39
4.1.2 Contaminant concentrations in the harbour<br />
(a) Existing scenario versus development #1 scenario<br />
CONTAMINANT CONCENTRATION (mg/kg) IN SURFACE LAYER<br />
(expressed as mass of contaminant per mass of sediment)<br />
mass of contaminant<br />
attached to silt<br />
per total mass of silt<br />
( Existing scenario)<br />
<strong>Copper</strong> - 54 years - Existing vs. Development #1 Scenario<br />
bbbp01a.grf<br />
( Existing scenario)<br />
Development #1 scenario<br />
Existing scenario<br />
60<br />
SE#1 (Hel)<br />
40<br />
20<br />
0<br />
60<br />
Red traffic light<br />
(34 mg/kg)<br />
SE#2 (Luc)<br />
40<br />
20<br />
Subestuary<br />
SE#3 (Par)<br />
0<br />
60<br />
40<br />
20<br />
Amber traffic light<br />
(19 mg/kg)<br />
0<br />
60<br />
SE#4 (Ran)<br />
40<br />
20<br />
0<br />
60<br />
SE#5 (Bri)<br />
40<br />
20<br />
0<br />
0<br />
9<br />
18<br />
27<br />
36<br />
45<br />
54<br />
YEARS FROM 2001<br />
Prediction of Contaminant Accumulation in the Upper Waitemata Harbour - COPPER TP 259 40
CONTAMINANT CONCENTRATION (mg/kg) IN SURFACE LAYER<br />
(expressed as mass of contaminant per mass of sediment)<br />
mass of contaminant<br />
<strong>Copper</strong> - 54 years - Existing vs. Development<br />
attached to silt<br />
#1 Scenario<br />
per total mass of silt<br />
bbbp01b.grf<br />
( Existing scenario) ( Existing scenario)<br />
Development #1 scenario<br />
Existing scenario<br />
60<br />
SE#6 (Rar)<br />
40<br />
20<br />
0<br />
60<br />
Red traffic light<br />
(34 mg/kg)<br />
Subestuary<br />
SE#7 (Wai)<br />
SE#9 (Upp)<br />
40<br />
20<br />
0<br />
60<br />
40<br />
20<br />
0<br />
60<br />
Amber traffic light<br />
(19 mg/kg)<br />
SE#10 (Mid)<br />
40<br />
20<br />
0<br />
60<br />
SE#11 (Low)<br />
40<br />
20<br />
0<br />
0<br />
9<br />
18<br />
27<br />
36<br />
45<br />
54<br />
YEARS FROM 2001<br />
Prediction of Contaminant Accumulation in the Upper Waitemata Harbour - COPPER TP 259 41
(b) Response envelope around development #1 scenario<br />
CONTAMINANT CONCENTRATION (mg/kg) IN SURFACE LAYER<br />
(expressed as mass of contaminant per mass of sediment)<br />
<strong>Copper</strong> - 54 years<br />
cccp01a.grf<br />
mass of contaminant mass of contaminant<br />
Response envelope around Development attached to silt #1 Scenario attached to sand<br />
per total mass of silt per total mass of sand<br />
(bracketed by zero and maximum attainable controls)<br />
60<br />
( Existing scenario)<br />
( Existing scenario)<br />
Zero controls<br />
Development #1 scenario<br />
Maximum attainable controls<br />
SE#1 (Hel)<br />
40<br />
20<br />
0<br />
60<br />
SE#2 (Luc)<br />
40<br />
20<br />
Subestuary<br />
SE#3 (Par)<br />
0<br />
60<br />
40<br />
20<br />
Red traffic light<br />
(34 mg/kg)<br />
0<br />
60<br />
Amber traffic light<br />
(19 mg/kg)<br />
SE#4 (Ran)<br />
40<br />
20<br />
0<br />
60<br />
SE#5 (Bri)<br />
40<br />
20<br />
0<br />
0<br />
9<br />
18<br />
27<br />
36<br />
45<br />
54<br />
YEARS FROM 2001<br />
Prediction of Contaminant Accumulation in the Upper Waitemata Harbour - COPPER TP 259 42
CONTAMINANT CONCENTRATION (mg/kg) IN SURFACE LAYER<br />
(expressed as mass of contaminant per mass of sediment)<br />
<strong>Copper</strong> - 54 years<br />
Response envelope around Development<br />
mass of contaminant<br />
#1 Scenario<br />
(bracketed by zero and maximum attainable attached to silt controls)<br />
cccp01b.grf<br />
mass of contaminant<br />
attached to sand<br />
per total mass of silt per total mass of sand<br />
( Existing scenario) ( Existing scenario)<br />
Zero controls<br />
Development #1 scenario<br />
Maximum attainable controls<br />
60<br />
SE#6 (Rar)<br />
40<br />
20<br />
0<br />
60<br />
Red traffic light<br />
(34 mg/kg)<br />
Subestuary<br />
SE#7 (Wai)<br />
SE#9 (Upp)<br />
40<br />
20<br />
0<br />
60<br />
40<br />
20<br />
0<br />
60<br />
Amber traffic light<br />
(19 mg/kg)<br />
SE#10 (Mid)<br />
40<br />
20<br />
0<br />
60<br />
SE#11 (Low)<br />
40<br />
20<br />
0<br />
0<br />
9<br />
18<br />
27<br />
36<br />
45<br />
54<br />
YEARS FROM 2001<br />
Prediction of Contaminant Accumulation in the Upper Waitemata Harbour - COPPER TP 259 43
4.1.3 Time for total-sediment concentrations to reach “traffic lights”<br />
(a) Existing scenario versus development #1 scenario<br />
<strong>Results</strong> from<br />
development<br />
#1 scenario.<br />
Subestuary<br />
Years to Amber Years to Red<br />
(19 mg/kg) (34 mg/kg)<br />
1=Hellyers * 24.35<br />
2=Lucas * 28.85<br />
3=Paremoremo * 0<br />
4=Rangitopuni 7.98 0<br />
5=Brighams * 0<br />
6=Rarawaru * 0<br />
7=Waiarohia 47.27 0<br />
9=Upper main body of UWH * 44.81<br />
10=Middle main body of UWH 19.48 47.1<br />
11=Lower main body of UWH 18.9 0<br />
“*” signifies initial concentration exceeds traffic light<br />
“0” signifies traffic light is not exceeded within 54 years<br />
It takes 47.1 years from 2001 for<br />
contaminant concentrations to pass<br />
through the red traffic light in the<br />
Middle main body.<br />
<strong>Results</strong> from<br />
existing<br />
scenario.<br />
Subestuary<br />
Years to Amber<br />
(19 mg/kg)<br />
Years to Red (34<br />
mg/kg)<br />
1=Hellyers * 24.35<br />
2=Lucas * 0<br />
3=Paremoremo * 0<br />
4=Rangitopuni 6.92 0<br />
5=Brighams * 0<br />
6=Rarawaru * 0<br />
7=Waiarohia 0 0<br />
9=Upper main body of UWH * 0<br />
10=Middle main body of UWH 20.44 0<br />
11=Lower main body of UWH 18.9 0<br />
“*” signifies initial concentration exceeds traffic light<br />
“0” signifies traffic light is not exceeded within 54 years<br />
Prediction of Contaminant Accumulation in the Upper Waitemata Harbour - COPPER TP 259 44
(b) Response envelope around development #1 scenario<br />
Subestuary<br />
Years to Amber (19 mg/kg)<br />
No controls Development<br />
#1 scenario<br />
Maximum<br />
attainable controls<br />
1=Hellyers * * *<br />
2=Lucas * * *<br />
3=Paremoremo * * *<br />
4=Rangitopuni 6.75 7.98 14.13<br />
5=Brighams * * *<br />
6=Rarawaru * * *<br />
7=Waiarohia 31.67 47.27 0<br />
9=Upper main body<br />
of UWH<br />
* * *<br />
10=Middle main body<br />
of UWH 16.25 19.48 30.13<br />
11=Lower main body<br />
of UWH 14.13 18.9 26.42<br />
“*” signifies initial concentration exceeds traffic light<br />
“0” signifies traffic light is not exceeded within 54 years<br />
Subestuary<br />
Years to Red (34 mg/kg)<br />
No controls Development<br />
#1 scenario<br />
Maximum<br />
attainable controls<br />
1=Hellyers 24.25 24.35 48.52<br />
2=Lucas 22.71 28.85 34.98<br />
3=Paremoremo 0 0 0<br />
4=Rangitopuni 0 0 0<br />
5=Brighams 0 0 0<br />
6=Rarawaru 47.75 0 0<br />
7=Waiarohia 0 0 0<br />
9=Upper main body<br />
of UWH 38.65 44.81 50.33<br />
10=Middle main body<br />
of UWH 34.87 47.1 0<br />
11=Lower main body<br />
of UWH 38.38 0 0<br />
“*” signifies initial concentration exceeds traffic light<br />
“0” signifies traffic light is not exceeded within 54 years<br />
It takes 47.1 years from 2001 for<br />
contaminant concentrations to pass<br />
through the red traffic light in the<br />
Middle main body under<br />
development #1 scenario.<br />
Prediction of Contaminant Accumulation in the Upper Waitemata Harbour - COPPER TP 259 45
4.1.4 Sedimentation in the harbour<br />
(a) Existing scenario versus development #1 scenario<br />
See report showing zinc results (NIWA Client Report<br />
HAM2003-087/2) for annual-average sediment deposition<br />
rate for each subestuary predicted by the model.<br />
Prediction of Contaminant Accumulation in the Upper Waitemata Harbour - COPPER TP 259 46
See report showing zinc results (NIWA Client Report<br />
HAM2003-087/2) for evolution of bed sediment in each<br />
subestuary (% silt/sand, height of bed surface) predicted<br />
by the model.<br />
Prediction of Contaminant Accumulation in the Upper Waitemata Harbour - COPPER TP 259 47
4.1.5 Origin of sediments / contaminants that deposit in harbour (%)<br />
(a) Existing scenario versus development #1 scenario<br />
<strong>Results</strong> from<br />
development<br />
#1 scenario.<br />
See report showing zinc results (NIWA Client Report HAM2003-<br />
087/2) for percentage of the total amount of sediment (i.e., from<br />
all subcatchments) deposited in each subestuary.<br />
Percentage of the total amount of contaminant (i.e., from all subcatchments) deposited in each<br />
subestuary.<br />
Subcatchment<br />
Subestuary 1=Hel 2=Luc 3=Par 4=Ran 5=Bri 6=Rar 7=Wai<br />
1=Hellyers 99.6 0.1 0 0.1 0 0 0.2<br />
2=Lucas 2.1 95.2 0.6 0.2 0 0.3 1.5<br />
3=Paremoremo 3 0.5 91.3 3.6 0 0.4 1.1<br />
4=Rangitopuni 1.6 0.1 0.2 96.7 0.3 0.4 0.7<br />
5=Brighams 0.6 0 0.4 46.4 48.9 3.6 0.2<br />
6=Rarawaru 0.8 4.9 0 5.6 29.8 58.1 0.8<br />
7=Waiarohia 5.5 0 0 0 0 0.9 93.5<br />
8=Middle WH 8.8 11.2 5.9 16.2 3.7 1.6 52.5<br />
9=Upper main body of<br />
UWH 12.4 8.9 7.6 40.6 16.3 7.1 7.1<br />
10=Middle main body<br />
of UWH 11.4 49.5 19.2 2.2 0.8 4.3 12.5<br />
11=Lower main body<br />
of UWH 3.6 80.5 2.2 5.8 0.4 0.3 7.1<br />
<strong>Results</strong> from<br />
existing<br />
scenario are<br />
shown on<br />
next page for<br />
comparison.<br />
19.2% of the contaminant<br />
that gets deposited in the<br />
Middle main body comes<br />
from Paremoremo<br />
subcatchment<br />
Prediction of Contaminant Accumulation in the Upper Waitemata Harbour - COPPER TP 259 48
These are the<br />
results from<br />
the existing<br />
scenario for<br />
comparison.<br />
See report showing zinc results (NIWA Client Report HAM2003-<br />
087/2) for percentage of the total amount of sediment (i.e., from<br />
all subcatchments) deposited in each subestuary.<br />
Percentage of the total amount of contaminant (i.e., from all subcatchments) deposited in each<br />
subestuary.<br />
Subcatchment<br />
Subestuary 1=Hel 2=Luc 3=Par 4=Ran 5=Bri 6=Rar 7=Wai<br />
1=Hellyers 99.6 0.1 0 0.1 0 0 0.1<br />
2=Lucas 1.5 96.9 0.4 0.3 0 0.2 0.7<br />
3=Paremoremo 3.3 0.8 88.4 6.2 0 0.4 0.9<br />
4=Rangitopuni 1 0 0.1 98.1 0.2 0.2 0.3<br />
5=Brighams 0.5 0 0.3 63.3 32.9 2.9 0.1<br />
6=Rarawaru 0.8 7.4 0 9.2 24.4 57.6 0.6<br />
7=Waiarohia 8 0 0 0 0 1.3 90.7<br />
8=Middle WH 9.2 17.5 5.6 26.8 3.1 1.5 36.3<br />
9=Upper main body of<br />
UWH 10.4 10.5 5.6 53.4 10.6 5.5 4.1<br />
10=Middle main body<br />
of UWH 9.9 61 14.6 3 0.6 3.5 7.3<br />
11=Lower main body<br />
of UWH 2.7 84.9 1.5 6.9 0.3 0.2 3.5<br />
Prediction of Contaminant Accumulation in the Upper Waitemata Harbour - COPPER TP 259 49
4.1.6 Origin of sediments / contaminants that deposit in harbour (mass)<br />
(a) Existing scenario versus development #1 scenario<br />
<strong>Results</strong> from<br />
development<br />
#1 scenario.<br />
See report showing zinc results (NIWA Client Report HAM2003-<br />
087/2) for mass of sediment deposited in each subestuary.<br />
Mass (kg) of contaminant deposited in each subestuary.<br />
Subcatchment<br />
1=Hel 2=Luc 3=Par 4=Ran 5=Bri 6=Rar 7=Wai<br />
Subestuary<br />
1=Hellyers 3.94E+03 2.73E+00 1.88E+00 2.57E+00 3.20E-01 5.19E-01 8.37E+00<br />
2=Lucas 1.55E+02 7.07E+03 4.15E+01 1.75E+01 1.95E+00 2.60E+01 1.11E+02<br />
3=Paremoremo 7.69E+01 1.34E+01 2.36E+03 9.30E+01 1.61E-01 1.11E+01 2.94E+01<br />
4=Rangitopuni 1.30E+02 4.54E+00 1.76E+01 7.89E+03 2.46E+01 3.20E+01 5.73E+01<br />
5=Brighams 1.61E+01 5.23E-01 1.00E+01 1.27E+03 1.34E+03 9.85E+01 5.88E+00<br />
6=Rarawaru 1.56E+00 1.02E+01 1.27E-02 1.15E+01 6.14E+01 1.20E+02 1.64E+00<br />
7=Waiarohia 5.94E+01 1.70E-01 1.06E-01 1.17E-01 1.68E-02 1.03E+01 1.02E+03<br />
8=Middle WH 3.36E+02 4.30E+02 2.27E+02 6.21E+02 1.43E+02 6.16E+01 2.01E+03<br />
9=Upper main body of<br />
UWH 7.90E+02 5.65E+02 4.83E+02 2.58E+03 1.04E+03 4.50E+02 4.54E+02<br />
10=Middle main body of<br />
UWH 4.28E+02 1.86E+03 7.20E+02 8.34E+01 3.19E+01 1.62E+02 4.71E+02<br />
11=Lower main body of<br />
UWH 5.15E+01 1.15E+03 3.21E+01 8.33E+01 6.34E+00 3.90E+00 1.02E+02<br />
<strong>Results</strong> from<br />
existing<br />
scenario are<br />
shown on<br />
next page for<br />
comparison.<br />
Of the contaminant that<br />
gets deposited in the<br />
Middle main body,<br />
7.20x10^2 kg comes from<br />
Paremoremo subcatchment<br />
Prediction of Contaminant Accumulation in the Upper Waitemata Harbour - COPPER TP 259 50
These are the<br />
results from<br />
the existing<br />
scenario for<br />
comparison.<br />
See report showing zinc results (NIWA Client Report HAM2003-<br />
087/2) for mass of sediment deposited in each subestuary.<br />
Mass (kg) of contaminant deposited in each subestuary.<br />
Subcatchment<br />
1=Hel 2=Luc 3=Par 4=Ran 5=Bin 6=Rar 7=Wai<br />
Subestuary<br />
1=Hellyers 3.94E+03 4.58E+00 1.72E+00 4.07E+00 2.62E-01 4.81E-01 5.64E+00<br />
2=Lucas 1.55E+02 9.99E+03 3.69E+01 2.77E+01 1.61E+00 2.42E+01 7.55E+01<br />
3=Paremoremo 7.69E+01 1.92E+01 2.08E+03 1.47E+02 1.30E-01 1.03E+01 2.01E+01<br />
4=Rangitopuni 1.30E+02 6.06E+00 1.57E+01 1.24E+04 1.91E+01 2.98E+01 3.96E+01<br />
5=Brighams 1.61E+01 7.58E-01 8.84E+00 2.01E+03 1.05E+03 9.29E+01 4.14E+00<br />
6=Rarawaru 1.56E+00 1.44E+01 1.32E-02 1.81E+01 4.78E+01 1.13E+02 1.20E+00<br />
7=Waiarohia 5.94E+01 2.85E-01 9.52E-02 1.83E-01 1.14E-02 9.35E+00 6.73E+02<br />
8=Middle WH 3.36E+02 6.42E+02 2.04E+02 9.82E+02 1.12E+02 5.62E+01 1.33E+03<br />
9=Upper main body of<br />
UWH 7.90E+02 7.99E+02 4.25E+02 4.07E+03 8.06E+02 4.22E+02 3.10E+02<br />
10=Middle main body of<br />
UWH 4.28E+02 2.65E+03 6.35E+02 1.32E+02 2.50E+01 1.52E+02 3.17E+02<br />
11=Lower main body of<br />
UWH 5.15E+01 1.63E+03 2.85E+01 1.32E+02 5.60E+00 3.62E+00 6.78E+01<br />
Prediction of Contaminant Accumulation in the Upper Waitemata Harbour - COPPER TP 259 51
4.1.7 Fate of sediments / contaminants that derive from land (%)<br />
<strong>Results</strong> from<br />
development<br />
#1 scenario.<br />
(a) Existing scenario versus development #1 scenario<br />
See report showing zinc results (NIWA Client Report HAM2003-087/2) for<br />
percentage of the total amount of sediment originating in each subcatchment and<br />
passing through controls and entering each subestuary.<br />
Percentage of the total amount of contaminant originating in each subcatchment and passing through controls<br />
and entering each subestuary.<br />
Subestuary<br />
Subcatchment 1=Hel 2=Luc 3=Par 4=Ran 5=Bri 6=Rar 7=Wai 8 =<br />
MWH<br />
9 =<br />
Upp<br />
10 =<br />
Mid<br />
11 =<br />
Low<br />
1=Hellyers 65.8 2.6 1.3 2.2 0.3 0 1 5.6 13.2 7.2 0.9<br />
2=Lucas 0 63.7 0.1 0 0 0.1 0 3.9 5.1 16.7 10.4<br />
3=Paremoremo 0 1.1 60.6 0.5 0.3 0 0 5.8 12.4 18.5 0.8<br />
4=Rangitopuni 0 0.1 0.7 62.3 10.1 0.1 0 4.9 20.4 0.7 0.7<br />
5=Brighams 0 0.1 0 0.9 50.7 2.3 0 5.4 39.1 1.2 0.2<br />
6=Rarawaru 0.1 2.7 1.1 3.3 10.1 12.3 1.1 6.3 46.1 16.6 0.4<br />
7=Waiarohia 0.2 2.6 0.7 1.3 0.1 0 23.8 47.1 10.6 11 2.4<br />
<strong>Results</strong> from<br />
existing<br />
scenario are<br />
shown on<br />
next page for<br />
comparison.<br />
2.7% of the contaminant<br />
that originates in Rarawaru<br />
subcatchment gets<br />
deposited in Lucas<br />
subestuary<br />
Prediction of Contaminant Accumulation in the Upper Waitemata Harbour - COPPER TP 259 52
These are the<br />
results from<br />
the existing<br />
scenario for<br />
comparison.<br />
See report showing zinc results (NIWA Client Report HAM2003-087/2) for<br />
percentage of the total amount of sediment originating in each subcatchment and<br />
passing through controls and entering each subestuary.<br />
Percentage of the total amount of contaminant originating in each subcatchment and passing through controls<br />
and entering each subestuary.<br />
Subestuary<br />
Subcatchment 1=Hel 2=Luc 3=Par 4=Ran 5=Bri 6=Rar 7=Wai 8 =<br />
MWH<br />
9 =<br />
Upp<br />
10 =<br />
Mid<br />
11 =<br />
Low<br />
1=Hellyers 65.8 2.6 1.3 2.2 0.3 0 1 5.6 13.2 7.2 0.9<br />
2=Lucas 0 63.4 0.1 0 0 0.1 0 4.1 5.1 16.8 10.3<br />
3=Paremoremo 0 1.1 60.5 0.5 0.3 0 0 5.9 12.4 18.5 0.8<br />
4=Rangitopuni 0 0.1 0.7 62.3 10.1 0.1 0 4.9 20.4 0.7 0.7<br />
5=Brighams 0 0.1 0 0.9 50.7 2.3 0 5.4 39.1 1.2 0.3<br />
6=Rarawaru 0.1 2.6 1.1 3.3 10.2 12.3 1 6.2 46.2 16.7 0.4<br />
7=Waiarohia 0.2 2.7 0.7 1.4 0.1 0 23.7 46.8 10.9 11.2 2.4<br />
Prediction of Contaminant Accumulation in the Upper Waitemata Harbour - COPPER TP 259 53
4.1.8 Fate of sediments / contaminants that derive from land (mass)<br />
<strong>Results</strong> from<br />
development<br />
#1 scenario.<br />
(a) Existing scenario versus development #1 scenario<br />
See report showing zinc results (NIWA Client Report HAM2003-087/2) for mass<br />
of sediment originating in each subcatchment.<br />
Subcatchment<br />
1=Hellyers<br />
2=Lucas<br />
3=Paremoremo<br />
4=Rangitopuni<br />
5=Brighams<br />
6=Rarawaru<br />
7=Waiarohia<br />
Mass (kg) of contaminant originating in each subcatchment.<br />
Subestuary<br />
1=Hel 2=Luc 3=Par 4=Ran 5=Bri 6=Rar 7=Wai 8 = 9 =<br />
MWH Upp<br />
3.94E 1.55E 7.69E 1.30E 1.61E 1.56E 5.94E 3.36E 7.90E<br />
+03 +02 +01 +02 +01 +00 +01 +02 +02<br />
2.73E 7.07E 1.34E 4.54E 5.23E- 1.02E 1.70E- 4.30E 5.65E<br />
+00 +03 +01 +00 01 +01 01 +02 +02<br />
1.88E 4.15E 2.36E 1.76E 1.00E 1.27E- 1.06E- 2.27E 4.83E<br />
+00 +01 +03 +01 +01 02 01 +02 +02<br />
2.57E 1.75E 9.30E 7.89E 1.27E 1.15E 1.17E- 6.21E 2.58E<br />
+00 +01 +01 +03 +03 +01 01 +02 +03<br />
3.20E- 1.95E 1.61E- 2.46E 1.34E 6.14E 1.68E- 1.43E 1.04E<br />
01 +00 01 +01 +03 +01 02 +02 +03<br />
5.19E- 2.60E 1.11E 3.20E 9.85E 1.20E 1.03E 6.16E 4.50E<br />
01 +01 +01 +01 +01 +02 +01 +01 +02<br />
8.37E 1.11E 2.94E 5.73E 5.88E 1.64E 1.02E 2.01E 4.54E<br />
+00 +02 +01 +01 +00 +00 +03 +03 +02<br />
10 =<br />
Mid<br />
4.28E<br />
+02<br />
1.86E<br />
+03<br />
7.20E<br />
+02<br />
8.34E<br />
+01<br />
3.19E<br />
+01<br />
1.62E<br />
+02<br />
4.71E<br />
+02<br />
11 =<br />
Low<br />
5.15E<br />
+01<br />
1.15E<br />
+03<br />
3.21E<br />
+01<br />
8.33E<br />
+01<br />
6.34E<br />
+00<br />
3.90E<br />
+00<br />
1.02E<br />
+02<br />
<strong>Results</strong> from<br />
existing<br />
scenario are<br />
shown on<br />
next page for<br />
comparison.<br />
Of the contaminant that<br />
originates in Rarawaru<br />
subcatchment, 2.60x10^1<br />
kg gets deposited in Lucas<br />
subestuary<br />
Prediction of Contaminant Accumulation in the Upper Waitemata Harbour - COPPER TP 259 54
These are the<br />
results from<br />
the existing<br />
scenario for<br />
comparison.<br />
See report showing zinc results (NIWA Client Report HAM2003-087/2) for mass<br />
of sediment originating in each subcatchment.<br />
Subcatchment<br />
Mass (kg) of contaminant originating in each subcatchment.<br />
Subestuary<br />
1=Hel 2=Luc 3=Par 4=Ran 5=Bri 6=Rar 7=Wai 8 = 9 =<br />
MWH Upp<br />
10 =<br />
Mid<br />
11 =<br />
Low<br />
1=Hellyers<br />
2=Lucas<br />
3=Paremoremo<br />
4=Rangitopuni<br />
5=Brighams<br />
6=Rarawaru<br />
7=Waiarohia<br />
1.55E<br />
+02<br />
9.99E<br />
+03<br />
3.69E<br />
+01<br />
2.77E<br />
+01<br />
1.61E<br />
+00<br />
2.42E<br />
+01<br />
7.55E<br />
+01<br />
3.94E<br />
+03<br />
4.58E<br />
+00<br />
1.72E<br />
+00<br />
4.07E<br />
+00<br />
2.62E-<br />
01<br />
4.81E-<br />
01<br />
5.64E<br />
+00<br />
7.69E<br />
+01<br />
1.92E<br />
+01<br />
2.08E<br />
+03<br />
1.47E<br />
+02<br />
1.30E-<br />
01<br />
1.03E<br />
+01<br />
2.01E<br />
+01<br />
1.30E<br />
+02<br />
6.06E<br />
+00<br />
1.57E<br />
+01<br />
1.24E<br />
+04<br />
1.91E<br />
+01<br />
2.98E<br />
+01<br />
3.96E<br />
+01<br />
5.94E<br />
+01<br />
2.85E-<br />
01<br />
9.52E-<br />
02<br />
1.83E-<br />
01<br />
1.14E-<br />
02<br />
9.35E<br />
+00<br />
6.73E<br />
+02<br />
1.56E<br />
+00<br />
1.44E<br />
+01<br />
1.32E-<br />
02<br />
1.81E<br />
+01<br />
4.78E<br />
+01<br />
1.13E<br />
+02<br />
1.20E<br />
+00<br />
1.61E<br />
+01<br />
7.58E-<br />
01<br />
8.84E<br />
+00<br />
2.01E<br />
+03<br />
1.05E<br />
+03<br />
9.29E<br />
+01<br />
4.14E<br />
+00<br />
3.36E<br />
+02<br />
6.42E<br />
+02<br />
2.04E<br />
+02<br />
9.82E<br />
+02<br />
1.12E<br />
+02<br />
5.62E<br />
+01<br />
1.33E<br />
+03<br />
7.90E<br />
+02<br />
7.99E<br />
+02<br />
4.25E<br />
+02<br />
4.07E<br />
+03<br />
8.06E<br />
+02<br />
4.22E<br />
+02<br />
3.10E<br />
+02<br />
4.28E<br />
+02<br />
2.65E<br />
+03<br />
6.35E<br />
+02<br />
1.32E<br />
+02<br />
2.50E<br />
+01<br />
1.52E<br />
+02<br />
3.17E<br />
+02<br />
5.15E<br />
+01<br />
1.63E<br />
+03<br />
2.85E<br />
+01<br />
1.32E<br />
+02<br />
5.60E<br />
+00<br />
3.62E<br />
+00<br />
6.78E<br />
+01<br />
Prediction of Contaminant Accumulation in the Upper Waitemata Harbour - COPPER TP 259 55
4.2 Simulation period: 108 years<br />
Prediction of Contaminant Accumulation in the Upper Waitemata Harbour - COPPER TP 259 56
4.2.2 Contaminant concentrations in the harbour<br />
(a) Existing scenario versus development #1 scenario<br />
CONTAMINANT CONCENTRATION (mg/kg) IN SURFACE LAYER<br />
(expressed as mass of contaminant per mass of sediment)<br />
mass of contaminant<br />
attached to silt<br />
per total mass of silt<br />
( Existing scenario)<br />
<strong>Copper</strong> - 108 years - Existing vs. Development #1 Scenario<br />
bbbp01a.grf<br />
( Existing scenario)<br />
Development #1 scenario<br />
Existing scenario<br />
60<br />
SE#1 (Hel)<br />
40<br />
20<br />
0<br />
60<br />
Red traffic light<br />
(34 mg/kg)<br />
SE#2 (Luc)<br />
40<br />
20<br />
Subestuary<br />
SE#3 (Par)<br />
0<br />
60<br />
40<br />
20<br />
Amber traffic light<br />
(19 mg/kg)<br />
0<br />
60<br />
SE#4 (Ran)<br />
40<br />
20<br />
0<br />
60<br />
SE#5 (Bri)<br />
40<br />
20<br />
0<br />
0<br />
9<br />
18<br />
27<br />
36<br />
45<br />
54<br />
63<br />
72<br />
81<br />
90<br />
99<br />
108<br />
YEARS FROM 2001<br />
Prediction of Contaminant Accumulation in the Upper Waitemata Harbour - COPPER TP 259 57
CONTAMINANT CONCENTRATION (mg/kg) IN SURFACE LAYER<br />
(expressed as mass of contaminant per mass of sediment)<br />
mass of contaminant<br />
<strong>Copper</strong> - 108 years - Existing vs. Development<br />
attached to silt<br />
#1 Scenario<br />
per total mass of silt<br />
bbbp01b.grf<br />
( Existing scenario) ( Existing scenario)<br />
Development #1 scenario<br />
Existing scenario<br />
60<br />
SE#6 (Rar)<br />
40<br />
20<br />
0<br />
60<br />
SE#7 (Wai)<br />
40<br />
20<br />
Subestuary<br />
SE#9 (Upp)<br />
0<br />
60<br />
40<br />
20<br />
Red traffic light<br />
(34 mg/kg)<br />
0<br />
60<br />
Amber traffic light<br />
(19 mg/kg)<br />
SE#10 (Mid)<br />
40<br />
20<br />
0<br />
60<br />
SE#11 (Low)<br />
40<br />
20<br />
0<br />
0<br />
9<br />
18<br />
27<br />
36<br />
45<br />
54<br />
63<br />
72<br />
81<br />
90<br />
99<br />
108<br />
YEARS FROM 2001<br />
Prediction of Contaminant Accumulation in the Upper Waitemata Harbour - COPPER TP 259 58
(b) Response envelope around development #1 scenario<br />
CONTAMINANT CONCENTRATION (mg/kg) IN SURFACE LAYER<br />
(expressed as mass of contaminant per mass of sediment)<br />
<strong>Copper</strong> - 108 years<br />
cccp01a.grf<br />
mass of contaminant mass of contaminant<br />
Response envelope around Development attached to silt #1 Scenario attached to sand<br />
per total mass of silt per total mass of sand<br />
(bracketed by zero and maximum attainable controls)<br />
60<br />
( Existing scenario)<br />
( Existing scenario)<br />
Zero controls<br />
Development #1 scenario<br />
Maximum attainable controls<br />
SE#1 (Hel)<br />
40<br />
20<br />
0<br />
60<br />
Red traffic light<br />
(34 mg/kg)<br />
SE#2 (Luc)<br />
40<br />
20<br />
Subestuary<br />
SE#3 (Par)<br />
0<br />
60<br />
40<br />
20<br />
Amber traffic light<br />
(19 mg/kg)<br />
0<br />
60<br />
SE#4 (Ran)<br />
40<br />
20<br />
0<br />
60<br />
SE#5 (Bri)<br />
40<br />
20<br />
0<br />
0<br />
9<br />
18<br />
27<br />
36<br />
45<br />
54<br />
63<br />
72<br />
81<br />
90<br />
99<br />
108<br />
YEARS FROM 2001<br />
Prediction of Contaminant Accumulation in the Upper Waitemata Harbour - COPPER TP 259 59
CONTAMINANT CONCENTRATION (mg/kg) IN SURFACE LAYER<br />
(expressed as mass of contaminant per mass of sediment)<br />
<strong>Copper</strong> - 108 years<br />
cccp01b.grf<br />
Response envelope around Development<br />
mass of contaminant<br />
#1 Scenario<br />
mass of contaminant<br />
(bracketed by zero and maximum attainable attached to silt controls) attached to sand<br />
per total mass of silt per total mass of sand<br />
( Existing scenario) ( Existing scenario)<br />
Zero controls<br />
Development #1 scenario<br />
Maximum attainable controls<br />
60<br />
SE#6 (Rar)<br />
40<br />
20<br />
0<br />
60<br />
SE#7 (Wai)<br />
40<br />
20<br />
Subestuary<br />
SE#9 (Upp)<br />
0<br />
60<br />
40<br />
20<br />
Red traffic light<br />
(34 mg/kg)<br />
0<br />
60<br />
Amber traffic light<br />
(19 mg/kg)<br />
SE#10 (Mid)<br />
40<br />
20<br />
0<br />
60<br />
SE#11 (Low)<br />
40<br />
20<br />
0<br />
0<br />
9<br />
18<br />
27<br />
36<br />
45<br />
54<br />
63<br />
72<br />
81<br />
90<br />
99<br />
108<br />
YEARS FROM 2001<br />
Prediction of Contaminant Accumulation in the Upper Waitemata Harbour - COPPER TP 259 60
4.2.3 Time for total-sediment concentrations to reach “traffic lights”<br />
(a) Existing scenario versus development #1 scenario<br />
<strong>Results</strong> from<br />
development<br />
#1 scenario.<br />
Subestuary<br />
Years to Amber Years to Red<br />
(19 mg/kg) (34 mg/kg)<br />
1=Hellyers * 24.35<br />
2=Lucas * 28.85<br />
3=Paremoremo * 0<br />
4=Rangitopuni 7.98 0<br />
5=Brighams * 0<br />
6=Rarawaru * 58.02<br />
7=Waiarohia 47.27 0<br />
9=Upper main body of UWH * 44.81<br />
10=Middle main body of UWH 19.48 47.1<br />
11=Lower main body of UWH 18.9 54.62<br />
“*” signifies initial concentration exceeds traffic light<br />
“0” signifies traffic light is not exceeded within 108 years<br />
It takes 47.27 years from 2001 for<br />
contaminant concentrations to pass<br />
through the amber traffic light in the<br />
Waiarohia subestuary.<br />
<strong>Results</strong> from<br />
existing<br />
scenario.<br />
Subestuary<br />
Years to Amber<br />
(19 mg/kg)<br />
Years to Red<br />
(34 mg/kg)<br />
1=Hellyers * 24.35<br />
2=Lucas * 0<br />
3=Paremoremo * 0<br />
4=Rangitopuni 6.92 0<br />
5=Brighams * 0<br />
6=Rarawaru * 91.42<br />
7=Waiarohia 75.52 0<br />
9=Upper main body of UWH * 0<br />
10=Middle main body of UWH 20.44 0<br />
11=Lower main body of UWH 18.9 0<br />
“*” signifies initial concentration exceeds traffic light<br />
“0” signifies traffic light is not exceeded within 108 years<br />
Prediction of Contaminant Accumulation in the Upper Waitemata Harbour - COPPER TP 259 61
(b) Response envelope around development #1 scenario<br />
Subestuary<br />
Years to Amber (19 mg/kg)<br />
No controls Development Maximum<br />
#1 scenario attainable controls<br />
1=Hellyers * * *<br />
2=Lucas * * *<br />
3=Paremoremo * * *<br />
4=Rangitopuni 6.75 7.98 14.13<br />
5=Brighams * * *<br />
6=Rarawaru * * *<br />
7=Waiarohia 31.67 47.27 57.44<br />
9=Upper main body<br />
of UWH * * *<br />
10=Middle main body<br />
of UWH 16.25 19.48 30.13<br />
11=Lower main body<br />
of UWH 14.13 18.9 26.42<br />
“*” signifies initial concentration exceeds traffic light<br />
“0” signifies traffic light is not exceeded within 108 years<br />
It takes 19.48 years from 2001 for<br />
contaminant concentrations to pass<br />
through the amber traffic light in the<br />
Middle main body under<br />
development #1 scenario.<br />
Subestuary<br />
Years to Red (34 mg/kg)<br />
No controls Development<br />
#1 scenario<br />
Maximum<br />
attainable controls<br />
1=Hellyers 24.25 24.35 48.52<br />
2=Lucas 22.71 28.85 34.98<br />
3=Paremoremo 0 0 0<br />
4=Rangitopuni 0 0 0<br />
5=Brighams 77.63 0 0<br />
6=Rarawaru 47.75 58.02 88.23<br />
7=Waiarohia 74.27 0 0<br />
9=Upper main body<br />
of UWH 38.65 44.81 50.33<br />
10=Middle main body<br />
of UWH 34.87 47.1 60.75<br />
11=Lower main body<br />
of UWH 38.38 54.62 66.88<br />
“*” signifies initial concentration exceeds traffic light<br />
“0” signifies traffic light is not exceeded within 108 years<br />
Prediction of Contaminant Accumulation in the Upper Waitemata Harbour - COPPER TP 259 62
4.2.4 Sedimentation in the harbour<br />
(a) Existing scenario versus development #1 scenario<br />
See report showing zinc results (NIWA Client Report<br />
HAM2003-087/2) for annual-average sediment deposition<br />
rate for each subestuary predicted by the model.<br />
Prediction of Contaminant Accumulation in the Upper Waitemata Harbour - COPPER TP 259 63
See report showing zinc results (NIWA Client Report<br />
HAM2003-087/2) for evolution of bed sediment in each<br />
subestuary (% silt/sand, height of bed surface) predicted<br />
by the model.<br />
Prediction of Contaminant Accumulation in the Upper Waitemata Harbour - COPPER TP 259 64
4.2.5 Origin of sediments / contaminants that deposit in harbour (%)<br />
(a) Existing scenario versus development #1 scenario<br />
<strong>Results</strong> from<br />
development<br />
#1 scenario.<br />
See report showing zinc results (NIWA Client Report HAM2003-<br />
087/2) for percentage of the total amount of sediment (i.e., from<br />
all subcatchments) deposited in each subestuary.<br />
Percentage of the total amount of contaminant (i.e., from all subcatchments) deposited in each<br />
subestuary.<br />
Subcatchment<br />
Subestuary 1=Hel 2=Luc 3=Par 4=Ran 5=Bri 6=Rar 7=Wai<br />
1=Hellyers 99.6 0.1 0 0.1 0 0 0.2<br />
2=Lucas 1.9 95.5 0.4 0.2 0 0.3 1.6<br />
3=Paremoremo 3.7 0.7 89.1 4.3 0 0.5 1.6<br />
4=Rangitopuni 1.7 0.1 0.2 96.5 0.4 0.4 0.9<br />
5=Brighams 0.6 0 0.3 42.8 52.6 3.5 0.2<br />
6=Rarawaru 0.7 5.2 0 5.1 31.9 56.3 0.9<br />
7=Waiarohia 4.7 0 0 0 0 0.8 94.5<br />
8=Middle WH 8.1 11.1 4.3 14.3 3.8 1.5 56.9<br />
9=Upper main body of<br />
UWH 12.4 9.6 5.9 38.6 18.1 7.1 8.3<br />
10=Middle main body<br />
of UWH 11.2 52.5 14.7 2.1 0.9 4.3 14.4<br />
11=Lower main body<br />
of UWH 3.4 81.3 1.7 5.2 0.4 0.3 7.8<br />
<strong>Results</strong> from<br />
existing<br />
scenario are<br />
shown on<br />
next page for<br />
comparison.<br />
14.7% of the contaminant<br />
that gets deposited in the<br />
Middle main body comes<br />
from Paremoremo<br />
subcatchment<br />
Prediction of Contaminant Accumulation in the Upper Waitemata Harbour - COPPER TP 259 65
These are the<br />
results from<br />
the existing<br />
scenario for<br />
comparison.<br />
See report showing zinc results (NIWA Client Report HAM2003-<br />
087/2) for percentage of the total amount of sediment (i.e., from<br />
all subcatchments) deposited in each subestuary.<br />
Percentage of the total amount of contaminant (i.e., from all subcatchments) deposited in each<br />
subestuary.<br />
Subcatchment<br />
Subestuary 1=Hel 2=Luc 3=Par 4=Ran 5=Bri 6=Rar 7=Wai<br />
1=Hellyers 99.6 0.1 0 0.1 0 0 0.1<br />
2=Lucas 1.5 96.9 0.4 0.3 0 0.2 0.7<br />
3=Paremoremo 3.3 0.8 88.4 6.2 0 0.4 0.9<br />
4=Rangitopuni 1 0 0.1 98.1 0.2 0.2 0.3<br />
5=Brighams 0.5 0 0.3 63.3 32.9 2.9 0.1<br />
6=Rarawaru 0.8 7.4 0 9.2 24.4 57.6 0.6<br />
7=Waiarohia 8 0 0 0 0 1.3 90.7<br />
8=Middle WH 9.2 17.5 5.6 26.8 3.1 1.5 36.3<br />
9=Upper main body of<br />
UWH 10.4 10.5 5.6 53.4 10.6 5.5 4.1<br />
10=Middle main body<br />
of UWH 9.9 61 14.6 3 0.6 3.5 7.3<br />
11=Lower main body<br />
of UWH 2.7 84.9 1.5 6.9 0.3 0.2 3.5<br />
Prediction of Contaminant Accumulation in the Upper Waitemata Harbour - COPPER TP 259 66
4.2.6 Origin of sediments / contaminants that deposit in harbour (mass)<br />
<strong>Results</strong> from<br />
development<br />
#1 scenario.<br />
(a) Existing scenario versus development #1 scenario<br />
See report showing zinc results (NIWA Client Report HAM2003-<br />
087/2) for mass of sediment deposited in each subestuary.<br />
Mass (kg) of contaminant deposited in each subestuary.<br />
Subcatchment<br />
1=Hel 2=Luc 3=Par 4=Ran 5=Bri 6=Rar 7=Wai<br />
Subestuary<br />
1=Hellyers 7.88E+03 5.71E+00 3.02E+00 4.90E+00 6.99E-01 1.04E+00 1.96E+01<br />
2=Lucas 3.09E+02 1.53E+04 6.54E+01 3.34E+01 4.23E+00 5.22E+01 2.60E+02<br />
3=Paremoremo 1.54E+02 2.90E+01 3.70E+03 1.78E+02 3.54E-01 2.24E+01 6.85E+01<br />
4=Rangitopuni 2.60E+02 1.00E+01 2.76E+01 1.51E+04 5.47E+01 6.43E+01 1.33E+02<br />
5=Brighams 3.21E+01 1.14E+00 1.58E+01 2.43E+03 2.99E+03 1.98E+02 1.36E+01<br />
6=Rarawaru 3.13E+00 2.21E+01 2.15E-02 2.19E+01 1.37E+02 2.41E+02 3.75E+00<br />
7=Waiarohia 1.19E+02 3.56E-01 1.71E-01 2.22E-01 3.86E-02 2.08E+01 2.39E+03<br />
8=Middle WH 6.71E+02 9.23E+02 3.59E+02 1.18E+03 3.16E+02 1.24E+02 4.72E+03<br />
9=Upper main body of<br />
UWH 1.58E+03 1.23E+03 7.57E+02 4.92E+03 2.31E+03 9.06E+02 1.06E+03<br />
10=Middle main body of<br />
UWH 8.57E+02 4.02E+03 1.13E+03 1.59E+02 7.06E+01 3.27E+02 1.10E+03<br />
11=Lower main body of<br />
UWH 1.03E+02 2.49E+03 5.19E+01 1.59E+02 1.34E+01 7.83E+00 2.39E+02<br />
<strong>Results</strong> from<br />
existing<br />
scenario are<br />
shown on<br />
next page for<br />
comparison.<br />
Of the contaminant that<br />
gets deposited in the<br />
Middle main body,<br />
1.13x10^3 kg comes from<br />
Paremoremo subcatchment<br />
Prediction of Contaminant Accumulation in the Upper Waitemata Harbour - COPPER TP 259 67
These are the<br />
results from<br />
the existing<br />
scenario for<br />
comparison.<br />
See report showing zinc results (NIWA Client Report HAM2003-<br />
087/2) for mass of sediment deposited in each subestuary.<br />
Mass (kg) of contaminant deposited in each subestuary.<br />
Subcatchment<br />
1=Hel 2=Luc 3=Par 4=Ran 5=Bri 6=Rar 7=Wai<br />
Subestuary<br />
1=Hellyers 7.88E+03 9.16E+00 3.43E+00 8.14E+00 5.23E-01 9.61E-01 1.13E+01<br />
2=Lucas 3.09E+02 2.00E+04 7.38E+01 5.55E+01 3.22E+00 4.83E+01 1.51E+02<br />
3=Paremoremo 1.54E+02 3.85E+01 4.16E+03 2.94E+02 2.60E-01 2.07E+01 4.03E+01<br />
4=Rangitopuni 2.60E+02 1.21E+01 3.13E+01 2.49E+04 3.82E+01 5.95E+01 7.91E+01<br />
5=Brighams 3.21E+01 1.52E+00 1.77E+01 4.02E+03 2.09E+03 1.86E+02 8.28E+00<br />
6=Rarawaru 3.13E+00 2.88E+01 2.64E-02 3.62E+01 9.55E+01 2.26E+02 2.41E+00<br />
7=Waiarohia 1.19E+02 5.70E-01 1.90E-01 3.67E-01 2.28E-02 1.87E+01 1.35E+03<br />
8=Middle WH 6.71E+02 1.28E+03 4.08E+02 1.96E+03 2.24E+02 1.12E+02 2.66E+03<br />
9=Upper main body of<br />
UWH 1.58E+03 1.60E+03 8.51E+02 8.14E+03 1.61E+03 8.44E+02 6.20E+02<br />
10=Middle main body of<br />
UWH 8.57E+02 5.30E+03 1.27E+03 2.64E+02 5.01E+01 3.05E+02 6.35E+02<br />
11=Lower main body of<br />
UWH 1.03E+02 3.25E+03 5.70E+01 2.64E+02 1.12E+01 7.24E+00 1.36E+02<br />
Prediction of Contaminant Accumulation in the Upper Waitemata Harbour - COPPER TP 259 68
4.2.7 Fate of sediments / contaminants that derive from land (%)<br />
<strong>Results</strong> from<br />
development<br />
#1 scenario.<br />
(a) Existing scenario versus development #1 scenario<br />
See report showing zinc results (NIWA Client Report HAM2003-087/2) for<br />
percentage of the total amount of sediment originating in each subcatchment and<br />
passing through controls and entering each subestuary.<br />
Percentage of the total amount of contaminant originating in each subcatchment and passing through controls<br />
and entering each subestuary.<br />
Subestuary<br />
Subcatchment 1=Hel 2=Luc 3=Par 4=Ran 5=Bri 6=Rar 7=Wai 8 =<br />
MWH<br />
9 =<br />
Upp<br />
10 =<br />
Mid<br />
11 =<br />
Low<br />
1=Hellyers 65.8 2.6 1.3 2.2 0.3 0 1 5.6 13.2 7.2 0.9<br />
2=Lucas 0 63.7 0.1 0 0 0.1 0 3.8 5.1 16.7 10.4<br />
3=Paremoremo 0 1.1 60.6 0.5 0.3 0 0 5.9 12.4 18.5 0.8<br />
4=Rangitopuni 0 0.1 0.7 62.3 10.1 0.1 0 4.9 20.4 0.7 0.7<br />
5=Brighams 0 0.1 0 0.9 50.7 2.3 0 5.4 39.1 1.2 0.2<br />
6=Rarawaru 0.1 2.7 1.1 3.3 10.1 12.3 1.1 6.3 46.1 16.6 0.4<br />
7=Waiarohia 0.2 2.6 0.7 1.3 0.1 0 23.9 47.2 10.6 11 2.4<br />
<strong>Results</strong> from<br />
existing<br />
scenario are<br />
shown on<br />
next page for<br />
comparison.<br />
2.7% of the contaminant<br />
that originates in Rarawaru<br />
subcatchment gets<br />
deposited in Lucas<br />
subestuary<br />
Prediction of Contaminant Accumulation in the Upper Waitemata Harbour - COPPER TP 259 69
These are the<br />
results from<br />
the existing<br />
scenario for<br />
comparison.<br />
See report showing zinc results (NIWA Client Report HAM2003-087/2) for<br />
percentage of the total amount of sediment originating in each subcatchment and<br />
passing through controls and entering each subestuary.<br />
Percentage of the total amount of contaminant originating in each subcatchment and passing through controls<br />
and entering each subestuary.<br />
Subestuary<br />
Subcatchment 1=Hel 2=Luc 3=Par 4=Ran 5=Bri 6=Rar 7=Wai 8 =<br />
MWH<br />
9 =<br />
Upp<br />
10 =<br />
Mid<br />
11 =<br />
Low<br />
1=Hellyers 65.8 2.6 1.3 2.2 0.3 0 1 5.6 13.2 7.2 0.9<br />
2=Lucas 0 63.4 0.1 0 0 0.1 0 4.1 5.1 16.8 10.3<br />
3=Paremoremo 0 1.1 60.5 0.5 0.3 0 0 5.9 12.4 18.5 0.8<br />
4=Rangitopuni 0 0.1 0.7 62.3 10.1 0.1 0 4.9 20.4 0.7 0.7<br />
5=Brighams 0 0.1 0 0.9 50.7 2.3 0 5.4 39.1 1.2 0.3<br />
6=Rarawaru 0.1 2.6 1.1 3.3 10.2 12.3 1 6.2 46.2 16.7 0.4<br />
7=Waiarohia 0.2 2.7 0.7 1.4 0.1 0 23.7 46.8 10.9 11.2 2.4<br />
Prediction of Contaminant Accumulation in the Upper Waitemata Harbour - COPPER TP 259 70
4.2.8 Fate of sediments / contaminants that derive from land (mass)<br />
<strong>Results</strong> from<br />
development<br />
#1 scenario.<br />
(a) Existing scenario versus development #1 scenario<br />
See report showing zinc results (NIWA Client Report HAM2003-087/2) for mass<br />
of sediment originating in each subcatchment.<br />
Subcatchment<br />
1=Hellyers<br />
2=Lucas<br />
3=Paremoremo<br />
4=Rangitopuni<br />
5=Brighams<br />
6=Rarawaru<br />
7=Waiarohia<br />
Mass (kg) of contaminant originating in each subcatchment.<br />
Subestuary<br />
1=Hel 2=Luc 3=Par 4=Ran 5=Bri 6=Rar 7=Wai 8 = 9 =<br />
MWH Upp<br />
7.88E 3.09E 1.54E 2.60E 3.21E 3.13E 1.19E 6.71E 1.58E<br />
+03 +02 +02 +02 +01 +00 +02 +02 +03<br />
5.71E 1.53E 2.90E 1.00E 1.14E 2.21E 3.56E- 9.23E 1.23E<br />
+00 +04 +01 +01 +00 +01 01 +02 +03<br />
3.02E 6.54E 3.70E 2.76E 1.58E 2.15E- 1.71E- 3.59E 7.57E<br />
+00 +01 +03 +01 +01 02 01 +02 +02<br />
4.90E 3.34E 1.78E 1.51E 2.43E 2.19E 2.22E- 1.18E 4.92E<br />
+00 +01 +02 +04 +03 +01 01 +03 +03<br />
6.99E- 4.23E 3.54E- 5.47E 2.99E 1.37E 3.86E- 3.16E 2.31E<br />
01 +00 01 +01 +03 +02 02 +02 +03<br />
1.04E 5.22E 2.24E 6.43E 1.98E 2.41E 2.08E 1.24E 9.06E<br />
+00 +01 +01 +01 +02 +02 +01 +02 +02<br />
1.96E 2.60E 6.85E 1.33E 1.36E 3.75E 2.39E 4.72E 1.06E<br />
+01 +02 +01 +02 +01 +00 +03 +03 +03<br />
10 =<br />
Mid<br />
8.57E<br />
+02<br />
4.02E<br />
+03<br />
1.13E<br />
+03<br />
1.59E<br />
+02<br />
7.06E<br />
+01<br />
3.27E<br />
+02<br />
1.10E<br />
+03<br />
11 =<br />
Low<br />
1.03E<br />
+02<br />
2.49E<br />
+03<br />
5.19E<br />
+01<br />
1.59E<br />
+02<br />
1.34E<br />
+01<br />
7.83E<br />
+00<br />
2.39E<br />
+02<br />
<strong>Results</strong> from<br />
existing<br />
scenario are<br />
shown on<br />
next page for<br />
comparison.<br />
Of the contaminant that<br />
originates in Rarawaru<br />
subcatchment, 5.22x10^1<br />
kg gets deposited in Lucas<br />
subestuary<br />
Prediction of Contaminant Accumulation in the Upper Waitemata Harbour - COPPER TP 259 71
These are the<br />
results from<br />
the existing<br />
scenario for<br />
comparison.<br />
See report showing zinc results (NIWA Client Report HAM2003-087/2) for mass<br />
of sediment originating in each subcatchment.<br />
Subcatchment<br />
Mass (kg) of contaminant originating in each subcatchment.<br />
Subestuary<br />
1=Hel 2=Luc 3=Par 4=Ran 5=Bri 6=Rar 7=Wai 8 = 9 =<br />
MWH Upp<br />
10 =<br />
Mid<br />
11 =<br />
Low<br />
1=Hellyers<br />
2=Lucas<br />
3=Paremoremo<br />
4=Rangitopuni<br />
5=Brighams<br />
6=Rarawaru<br />
7=Waiarohia<br />
3.09E<br />
+02<br />
2.00E<br />
+04<br />
7.38E<br />
+01<br />
5.55E<br />
+01<br />
3.22E<br />
+00<br />
4.83E<br />
+01<br />
1.51E<br />
+02<br />
7.88E<br />
+03<br />
9.16E<br />
+00<br />
3.43E<br />
+00<br />
8.14E<br />
+00<br />
5.23E-<br />
01<br />
9.61E-<br />
01<br />
1.13E<br />
+01<br />
1.54E<br />
+02<br />
3.85E<br />
+01<br />
4.16E<br />
+03<br />
2.94E<br />
+02<br />
2.60E-<br />
01<br />
2.07E<br />
+01<br />
4.03E<br />
+01<br />
2.60E<br />
+02<br />
1.21E<br />
+01<br />
3.13E<br />
+01<br />
2.49E<br />
+04<br />
3.82E<br />
+01<br />
5.95E<br />
+01<br />
7.91E<br />
+01<br />
3.21E<br />
+01<br />
1.52E<br />
+00<br />
1.77E<br />
+01<br />
4.02E<br />
+03<br />
2.09E<br />
+03<br />
1.86E<br />
+02<br />
8.28E<br />
+00<br />
1.19E<br />
+02<br />
5.70E-<br />
01<br />
1.90E-<br />
01<br />
3.67E-<br />
01<br />
2.28E-<br />
02<br />
1.87E<br />
+01<br />
1.35E<br />
+03<br />
3.13E<br />
+00<br />
2.88E<br />
+01<br />
2.64E-<br />
02<br />
3.62E<br />
+01<br />
9.55E<br />
+01<br />
2.26E<br />
+02<br />
2.41E<br />
+00<br />
6.71E<br />
+02<br />
1.28E<br />
+03<br />
4.08E<br />
+02<br />
1.96E<br />
+03<br />
2.24E<br />
+02<br />
1.12E<br />
+02<br />
2.66E<br />
+03<br />
1.58E<br />
+03<br />
1.60E<br />
+03<br />
8.51E<br />
+02<br />
8.14E<br />
+03<br />
1.61E<br />
+03<br />
8.44E<br />
+02<br />
6.20E<br />
+02<br />
8.57E<br />
+02<br />
5.30E<br />
+03<br />
1.27E<br />
+03<br />
2.64E<br />
+02<br />
5.01E<br />
+01<br />
3.05E<br />
+02<br />
6.35E<br />
+02<br />
1.03E<br />
+02<br />
3.25E<br />
+03<br />
5.70E<br />
+01<br />
2.64E<br />
+02<br />
1.12E<br />
+01<br />
7.24E<br />
+00<br />
1.36E<br />
+02<br />
Prediction of Contaminant Accumulation in the Upper Waitemata Harbour - COPPER TP 259 72
Prediction of Contaminant Accumulation in the Upper Waitemata Harbour - COPPER TP 259 73
5. Discussion<br />
5.1 Validation of predictions<br />
It has proven to be impossible to validate the estimated urban loads for copper by using the<br />
copper concentration profile in the sediment core from the Lucas Creek estuary as was<br />
done for zinc. As can be seen from the table of initial sediment copper concentrations given<br />
earlier in this report, at all sites sampled throughout the harbour (about 70 sites) the surface<br />
sediment concentration of copper is similar despite the known loads from urban activities.<br />
This observation implies that the copper loads relative to the sediment loads are similar for<br />
all catchments and that, therefore, natural copper loads are of similar magnitude to urban<br />
copper loads. The accuracy of this implication has not been verified.<br />
The apparent similarity of natural and urban loads for copper does not explain the copper<br />
concentration depth profile in the Lucas cores. Below a depth of about 30 cm the silt copper<br />
concentration is about 10 g m -3 and this increases sensibly over the period of urban<br />
development to about 20 to 25 g m -3 at the sediment surface. However, starting with a preurban<br />
sediment copper concentration of 10 g m -3 then adding the highest credible copper<br />
loads from development in the Lucas subcatchment over the period 1950 to 2001 as was<br />
done for zinc, produces a surface silt concentration of copper in 2001 only half of that<br />
observed. Present-day surface silt concentrations can be accurately predicted only by<br />
assuming a background concentration of about 20 g m -3 ; an assumption apparently in<br />
conflict with the observed concentration of 10 g m -3 at depth in the Lucas core. On the other<br />
hand, a background concentration of about 20 g m -3 is consistent with concentrations of<br />
between 18 and 25 g m -3 found in stream sediments in the relatively undeveloped (in an<br />
urban sense) Rangitopuni, Brighams and Paremoremo subcatchments.<br />
Similar sediment concentrations in all parts of the harbour was also seen to some extent for<br />
zinc as is discussed in the zinc report. For zinc, however, it was necessary to assume a<br />
higher background load only for the catchments with low amounts of urban development,<br />
i.e., Rangitopuni, Brighams and Paremoremo, in order to produce a sensible equilibrium<br />
situation for the existing scenario. This high background load was not assumed for the<br />
urbanised catchments because the urban zinc loads are high enough to swamp the<br />
background. This does mean, of course, that our estimates of urban zinc loads are possibly a<br />
little high but this error is small.<br />
We suspect that adsorption of copper leached from catchment soils onto stream sediments<br />
might be the cause of the relatively high background copper concentrations and that<br />
remobilisation of copper in estuarine sediments subsequent to deposition could be moving<br />
copper from depth towards the surface. Confirming these suspicions would require a<br />
substantial investigation well beyond the scope of this project.<br />
Faced with our lack of understanding of the mechanisms leading to the high background<br />
concentrations and the apparent inconsistencies in the Lucas core, we have modelled the<br />
fate of future copper loads on the basis of the following assumptions:<br />
1. That all inputs up to 2001 are adequately described by the background load (the<br />
background concentration multiplied by the predicted sediment load).<br />
2. That future urban copper loads will add on top of this background load.<br />
Prediction of Contaminant Accumulation in the Upper Waitemata Harbour - COPPER TP 259 74
This approach probably produces worst-case predictions of future sediment copper<br />
concentrations but until we better understand the behaviour of copper in catchment<br />
drainage and estuarine sediments we cannot improve on these predictions.<br />
Bearing in mind these assumptions, the results produced in this report for the existing<br />
scenario can be interpreted in exactly the same way as was explained for zinc. For<br />
catchments with only small amounts of urban development, the estuarine copper<br />
concentrations would be expected to be in near-equilibrium with catchment loads, i.e. the<br />
estuarine sediment concentrations should show very little increase over the modelled<br />
period, whereas for catchments with high urban copper loads the sediment concentrations<br />
would be expected to increase over several years before reaching equilibrium with the<br />
catchment loads.<br />
5.2 Examples of how to interrogate and interpret results<br />
Examples of how to interpret and interrogate results are given in the zinc results report<br />
(NIWA Client Report HAM2003-087/2 – <strong>Results</strong>: Zinc). The following example questions are<br />
addressed:<br />
• Where does contaminant deposited in each part of the harbour come from?<br />
• Which subestuary is most at risk?<br />
• Why is that?<br />
• How might this risk be lessened?<br />
• Will there be other benefits associated with source control in particular<br />
subcatchments?<br />
• Which subestuary is least at risk?<br />
• Why are these subestuaries at least risk?<br />
The traffic lights represent an environmental target or goal. For instance, one may decide<br />
that the red traffic light should not be exceeded for at least 30 years in the future in a<br />
particular estuarine habitat. (Note: 30 years is chosen arbitrarily here as an example and is<br />
not a recommended time frame, nor does it represent current thinking in the ARC).<br />
Inspection of the response-envelope plots will show how this may be achieved.<br />
• For instance, the response envelope for the subestuary in which the habitat of<br />
concern is located may show that, even under zero stormwater controls, the red<br />
light will not be exceeded within 30 years. Hence, the desired environmental<br />
target will be achieved with no management intervention.<br />
• Or, the response-envelope plots may show that, even under the maximum<br />
attainable stormwater controls, the time to red traffic light is, say, 15 years. In<br />
that case, there is no practicable stormwater control that can be implemented<br />
that will achieve the desired outcome. In that case, attention should turn to<br />
reducing the contaminant source (generation) to achieve the environmental<br />
outcome (viz., stretching the traffic light exceedance out to at least 30 years).<br />
Prediction of Contaminant Accumulation in the Upper Waitemata Harbour - COPPER TP 259 75
Furthermore, efforts at source control must, of course, focus on the<br />
subcatchment that supplies the majority of the contaminant that deposits in the<br />
subestuary in question.<br />
• Or, the response envelope might bracket the time of 30 years to the red light.<br />
This means that there will be some finite, attainable control level that will put the<br />
traffic light exceedance right on 30 years. One may estimate what that control<br />
level is by visually interpolating the response enveloped, or a series of trial-anderror<br />
simulations could be conducted to determine a more precise estimate.<br />
The response-envelope simulations may also be examined to address points such as:<br />
• Are there parts of the harbour where contaminant concentrations still exceed<br />
traffic lights even under the maximum attainable controls?<br />
• Are there subestuaries where significant gains in time-to-traffic-light can be had<br />
for modest control improvements?<br />
• What subcatchments are the main polluters?<br />
• Would maximum possible controls in these subcatchments have significant<br />
benefits throughout the whole harbour (which might justify the expense of<br />
maximum possible controls in those subcatchments)?<br />
Answers to these kinds of questions are also demonstrated in the zinc results report (NIWA<br />
Client Report HAM2003-087/2 – <strong>Results</strong>: Zinc).<br />
Prediction of Contaminant Accumulation in the Upper Waitemata Harbour - COPPER TP 259 76
Prediction of Contaminant Accumulation in the Upper Waitemata Harbour - COPPER TP 259 77
6. Conclusions<br />
The existing scenario extrapolates the “current-day” (i.e., 2001) landuse into the future<br />
based on the assumption that landuse does not change. The results from this scenario<br />
provide a baseline for comparison against a realistic development scenario developed in<br />
consultation with the Working Party. In addition, the same realistic development scenario is<br />
bracketed by two extremes (zero stormwater contaminant controls, and maximum<br />
attainable stormwater controls) to give an envelope of responses in the harbour.<br />
A range of results is presented, for both 54-year and 108-year simulations, including:<br />
• Contaminant concentrations in the harbour:<br />
(a) Existing scenario versus development #1 scenario<br />
(b) Response envelope around development #1 scenario<br />
• Time for total-sediment concentrations to reach “traffic lights”:<br />
(a) Existing scenario versus development #1 scenario<br />
(b) Response envelope around development #1 scenario<br />
• Sedimentation 3 in the harbour:<br />
(a) Existing scenario versus development #1 scenario<br />
(b) Response envelope around development #1 scenario<br />
• Origin of sediments 3 / contaminants that deposit in harbour (%):<br />
(a) Existing scenario versus development #1 scenario<br />
• Origin of sediments 3 / contaminants that deposit in harbour (mass):<br />
(a) Existing scenario versus development #1 scenario<br />
• Fate of sediments 3 / contaminants that derive from land (%):<br />
(a) Existing scenario versus development #1 scenario<br />
• Fate of sediments 3 / contaminants that derive from land (mass):<br />
(a) Existing scenario versus development #1 scenario<br />
3 Refer to the zinc results report (NIWA Client Report HAM2003-087/2 – <strong>Results</strong>: Zinc) for sediment results.<br />
Prediction of Contaminant Accumulation in the Upper Waitemata Harbour - COPPER TP 259 78
The various results presented herein can be used to investigate a number of questions<br />
concerning management of the Upper Waitemata Harbour catchment with a view to<br />
achieving environment targets in the receiving waters of the harbour.<br />
Prediction of Contaminant Accumulation in the Upper Waitemata Harbour - COPPER TP 259 79
7. References<br />
Herald, J.R. (1989). Hydrological Impact of Urban Development in the Albany Basin,<br />
<strong>Auckland</strong>. <strong>Auckland</strong>, New Zealand. Unpublished Ph.D. thesis, University of<br />
<strong>Auckland</strong>.<br />
Macaskill J.B., Williamson, R.B. (1994) Water Quality Impacts of Road Runoff. NIWA<br />
Client Report MTR001.<br />
Williamson, R. B. (1991) Urban Runoff Handbook. Water Quality Centre Publication<br />
No. 20.<br />
Prediction of Contaminant Accumulation in the Upper Waitemata Harbour - COPPER TP 259 80
Prediction of Contaminant Accumulation in the Upper Waitemata Harbour - COPPER TP 259 81
APPENDIX A1. Programme Control Information<br />
A1.1 54-year simulation – existing scenario<br />
0. Construct database – contam [clcontam.bat to compile/link]<br />
SUBDIRECTORY<br />
54EA2<br />
Batfile<br />
b54ea2.dat<br />
Output<br />
x54ea2.dat<br />
1. Build estuary sediments – builde [clbuilde.bat to compile/link] event-by-event output to one file per ESTUARY<br />
Prefix = aaa<br />
For tracking origin of sediments: seq=’q1’<br />
For recording buildup of contconcs: seq2=’c1’<br />
a. Average deposition rate over 54 years Read from screen at end<br />
b. % sed/cont seq=’q1’ aaaq1e01–e11.dat Last line of each file. Compile with<br />
extract1 --- sedt.dat/cont.dat<br />
c. Cumulative (%) sed/cont seq=’q1’ aaaq1e01–e11.dat *plots deleted*<br />
f. surface layer cont concs seq2=’c1’ aaac1e01–e11.dat aaap01a.grf, aaap01b.grf<br />
g. bed sediment evolution seq2=’c1’ aaac1e01–e11.dat aaat01.grf<br />
h. time to reach traffic lights seq=’c1’ aaac1e01–e11.dat Compile with extract3 --- traffic.dat<br />
Prefix = aaa<br />
For tracking origin of sediments: seq=’q2’<br />
For recording buildup of contconcs: seq2=’xx’<br />
d. kg sed/cont seq=’q2’ aaaq2e01–e11.dat Last line of each file. Compile with<br />
extract1 --- sedt.dat/cont.dat<br />
e. Cumulative (kg) sed/cont seq=’q2’ aaaq2e01–e11.dat *plots deleted*<br />
2. Track catchment sediments – buildc [clbuildc.bat to compile/link] event-by-event output to one file per CATCHMENT<br />
Prefix = aaa / seq=’q1’<br />
a. % sediment/contaminant seq=’q1’ aaaq1c01–c07.dat Last line of each file.<br />
Compile with extract2 ---<br />
sedm.dat/conm.dat<br />
b. Cumulative (%) sediment/contaminant seq=’q1’ aaaq1c01–c07.dat *plots deleted*<br />
Prefix = aaa / seq=’q2’<br />
c. kg sediment/contaminant seq=’q2’ aaaq2c01–c07.dat Last line of each file.<br />
Compile with extract2 ---<br />
sedm.dat/conm.dat<br />
d. Cumulative (kg) sediment/contaminant seq=’q2’ aaaq2c01–c07.dat *plots deleted*<br />
Prediction of Contaminant Accumulation in the Upper Waitemata Harbour - COPPER TP 259 82
A1.2 108-year simulation – existing scenario<br />
0. Construct database – contam [clcontam.bat to compile/link]<br />
SUBDIRECTORY<br />
108EA2<br />
Batfile<br />
b108ea2.dat<br />
Output<br />
x108ea2.dat<br />
1. Build estuary sediments – builde [clbuilde.bat to compile/link] event-by-event output to one file per ESTUARY<br />
Prefix = aaa<br />
For tracking origin of sediments: seq=’q1’<br />
For recording buildup of contconcs: seq2=’c1’<br />
a. Average deposition rate over 54 years Read from screen at end<br />
b. % sed/cont seq=’q1’ aaaq1e01–e11.dat Last line of each file. Compile with<br />
extract1 --- sedt.dat/cont.dat<br />
c. Cumulative (%) sed/cont seq=’q1’ aaaq1e01–e11.dat *plots deleted*<br />
f. surface layer cont concs seq2=’c1’ aaac1e01–e11.dat aaap01a.grf, aaap01b.grf<br />
g. bed sediment evolution seq2=’c1’ aaac1e01–e11.dat aaat01.grf<br />
h. time to reach traffic lights seq2=’c1’ aaac1e01–e11.dat Compile with extrac3 --- traffic.dat<br />
Prefix = aaa<br />
For tracking origin of sediments: seq=’q2’<br />
For recording buildup of contconcs: seq2=’xx’<br />
d. kg sed/cont seq=’q2’ aaaq2e01–e11.dat Last line of each file. Compile with<br />
extract1 --- sedt.dat/cont.dat<br />
e. Cumulative (kg) sed/cont seq=’q2’ aaaq2e01–e11.dat *plots deleted*<br />
2. Track catchment sediments – buildc [clbuildc.bat to compile/link] event-by-event output to one file per CATCHMENT<br />
Prefix = aaa / seq=’q1’<br />
a. % sediment/contaminant seq=’q1’ aaaq1c01–c07.dat Last line of each file.<br />
Compile with extract2 ---<br />
sedm.dat/conm.dat<br />
b. Cumulative (%) sediment/contaminant seq=’q1’ aaaq1c01–c07.dat *plots deleted*<br />
Prefix = aaa / seq=’q2’<br />
c. kg sediment/contaminant seq=’q2’ aaaq2c01–c07.dat Last line of each file.<br />
Compile with extract2 ---<br />
sedm.dat/conm.dat<br />
d. Cumulative (kg) sediment/contaminant seq=’q2’ aaaq2c01–c07.dat *plots deleted*<br />
Prediction of Contaminant Accumulation in the Upper Waitemata Harbour - COPPER TP 259 83
A1.3 54-year simulation – development #1 scenario<br />
0. Construct database – contam [clcontam.bat to compile/link]<br />
SUBDIRECTORY<br />
54S1A2<br />
Batfile<br />
b54s1a2.dat<br />
Output<br />
x54s1a2.dat<br />
1. Build estuary sediments – builde [clbuilde.bat to compile/link] event-by-event output to one file per ESTUARY<br />
Prefix = bbb<br />
For tracking origin of sediments: seq=’q1’<br />
For recording buildup of contconcs: seq2=’c1’<br />
a. Average deposition rate over 54 years Read from screen at end<br />
b. % sed/cont seq=’q1’ bbbq1e01–e11.dat Last line of each file. Compile with<br />
extract1 --- sedt.dat/cont.dat<br />
c. Cumulative (%) sed/cont seq=’q1’ bbbq1e01–e11.dat *plots deleted*<br />
f. surface layer cont concs seq2=’c1’ bbbc1e01–e11.dat bbbp01a.grf, bbbp01b.grf<br />
g. bed sediment evolution seq2=’c1’ bbbc1e01–e11.dat bbbt01.grf<br />
h. time to reach traffic lights seq=’c1’ bbbc1e01–e11.dat Compile with extract3 --- traffic.dat<br />
Prefix = bbb<br />
For tracking origin of sediments: seq=’q2’<br />
For recording buildup of contconcs: seq2=’xx’<br />
d. kg sed/cont seq=’q2’ bbbq2e01–e11.dat Last line of each file. Compile with<br />
extract1 --- sedt.dat/cont.dat<br />
e. Cumulative (kg) sed/cont seq=’q2’ bbbq2e01–e11.dat *plots deleted*<br />
2. Track catchment sediments – buildc [clbuildc.bat to compile/link] event-by-event output to one file per CATCHMENT<br />
Prefix = bbb / seq=’q1’<br />
a. % sediment/contaminant seq=’q1’ bbbq1c01–c07.dat Last line of each file.<br />
Compile with extract2 ---<br />
sedm.dat/conm.dat<br />
b. Cumulative (%) sediment/contaminant seq=’q1’ bbbq1c01–c07.dat *plots deleted*<br />
Prefix = bbb / seq=’q2’<br />
c. kg sediment/contaminant seq=’q2’ bbbq2c01–c07.dat Last line of each file.<br />
Compile with extract2 ---<br />
sedm.dat/conm.dat<br />
d. Cumulative (kg) sediment/contaminant seq=’q2’ bbbq2c01–c07.dat *plots deleted*<br />
Prediction of Contaminant Accumulation in the Upper Waitemata Harbour - COPPER TP 259 84
A1.4 108-year simulation – development #1 scenario<br />
0. Construct database – contam [clcontam.bat to compile/link]<br />
SUBDIRECTORY<br />
108S1A2<br />
Batfile<br />
b108s1a2.dat<br />
Output<br />
x108s1a2.dat<br />
1. Build estuary sediments – builde [clbuilde.bat to compile/link] event-by-event output to one file per ESTUARY<br />
Prefix = bbb<br />
For tracking origin of sediments: seq=’q1’<br />
For recording buildup of contconcs: seq2=’c1’<br />
a. Average deposition rate over 54 years Read from screen at end<br />
b. % sed/cont seq=’q1’ bbbq1e01–e11.dat Last line of each file. Compile with<br />
extract1 --- sedt.dat/cont.dat<br />
c. Cumulative (%) sed/cont seq=’q1’ bbbq1e01–e11.dat *plots deleted*<br />
f. surface layer cont concs seq2=’c1’ bbbc1e01–e11.dat bbbp01a.grf, bbbp01b.grf<br />
g. bed sediment evolution seq2=’c1’ bbbc1e01–e11.dat bbbt01.grf<br />
h. time to reach traffic lights seq2=’c1’ bbbc1e01–e11.dat Compile with extrac3 --- traffic.dat<br />
Prefix = bbb<br />
For tracking origin of sediments: seq=’q2’<br />
For recording buildup of contconcs: seq2=’xx’<br />
d. kg sed/cont seq=’q2’ bbbq2e01–e11.dat Last line of each file. Compile with<br />
extract1 --- sedt.dat/cont.dat<br />
e. Cumulative (kg) sed/cont seq=’q2’ bbbq2e01–e11.dat *plots deleted*<br />
2. Track catchment sediments – buildc [clbuildc.bat to compile/link] event-by-event output to one file per CATCHMENT<br />
Prefix = bbb / seq=’q1’<br />
a. % sediment/contaminant seq=’q1’ bbbq1c01–c07.dat Last line of each file.<br />
Compile with extract2 ---<br />
sedm.dat/conm.dat<br />
b. Cumulative (%) sediment/contaminant seq=’q1’ bbbq1c01–c07.dat *plots deleted*<br />
Prefix = bbb / seq=’q2’<br />
c. kg sediment/contaminant seq=’q2’ bbbq2c01–c07.dat Last line of each file.<br />
Compile with extract2 ---<br />
sedm.dat/conm.dat<br />
d. Cumulative (kg) sediment/contaminant seq=’q2’ bbbq2c01–c07.dat *plots deleted*<br />
Prediction of Contaminant Accumulation in the Upper Waitemata Harbour - COPPER TP 259 85
A1.5 54-year simulation – response envelope – no controls<br />
0. Construct database – contam [clcontam.bat to compile/link]<br />
SUBDIRECTORY<br />
54S2A2<br />
Batfile<br />
b54s2a2.dat<br />
Output<br />
x54s2a2.dat<br />
1. Build estuary sediments – builde [clbuilde.bat to compile/link] event-by-event output to one file per ESTUARY<br />
Prefix = ccc<br />
For tracking origin of sediments: seq=’q1’<br />
For recording buildup of contconcs: seq2=’c1’<br />
a. Average deposition rate over 54 years Read from screen at end<br />
b. % sed/cont seq=’q1’ cccq1e01–e11.dat Last line of each file. Compile with<br />
extract1 --- sedt.dat/cont.dat<br />
c. Cumulative (%) sed/cont seq=’q1’ cccq1e01–e11.dat *plots deleted*<br />
f. surface layer cont concs seq2=’c1’ cccc1e01–e11.dat cccp01a.grf, cccp01b.grf<br />
g. bed sediment evolution seq2=’c1’ cccc1e01–e11.dat ccct01.grf<br />
h. time to reach traffic lights seq=’c1’ cccc1e01–e11.dat<br />
bbb1e01–e11.dat<br />
dddc1e01–e11.dat<br />
Compile with extract4 --- traffic.dat<br />
Prefix = ccc<br />
For tracking origin of sediments: seq=’q2’<br />
For recording buildup of contconcs: seq2=’xx’<br />
d. kg sed/cont seq=’q2’ cccq2e01–e11.dat Last line of each file. Compile with<br />
extract1 --- sedt.dat/cont.dat<br />
e. Cumulative (kg) sed/cont seq=’q2’ cccq2e01–e11.dat *plots deleted*<br />
2. Track catchment sediments – buildc [clbuildc.bat to compile/link] event-by-event output to one file per CATCHMENT<br />
Prefix = ccc / seq=’q1’<br />
a. % sediment/contaminant seq=’q1’ cccq1c01–c07.dat Last line of each file.<br />
Compile with extract2 ---<br />
sedm.dat/conm.dat<br />
b. Cumulative (%) sediment/contaminant seq=’q1’ cccq1c01–c07.dat *plots deleted*<br />
Prefix = ccc / seq=’q2’<br />
c. kg sediment/contaminant seq=’q2’ cccq2c01–c07.dat Last line of each file.<br />
Compile with extract2 ---<br />
sedm.dat/conm.dat<br />
d. Cumulative (kg) sediment/contaminant seq=’q2’ cccq2c01–c07.dat *plots deleted*<br />
Prediction of Contaminant Accumulation in the Upper Waitemata Harbour - COPPER TP 259 86
A1.6 108-year simulation – response envelope – no controls<br />
0. Construct database – contam [clcontam.bat to compile/link]<br />
SUBDIRECTORY<br />
108S2A2<br />
Batfile<br />
b108s2a2.dat<br />
Output<br />
x108s2a2.dat<br />
1. Build estuary sediments – builde [clbuilde.bat to compile/link] event-by-event output to one file per ESTUARY<br />
Prefix = ccc<br />
For tracking origin of sediments: seq=’q1’<br />
For recording buildup of contconcs: seq2=’c1’<br />
a. Average deposition rate over 54 years Read from screen at end<br />
b. % sed/cont seq=’q1’ cccq1e01–e11.dat Last line of each file. Compile with<br />
extract1 --- sedt.dat/cont.dat<br />
c. Cumulative (%) sed/cont seq=’q1’ cccq1e01–e11.dat *plots deleted*<br />
f. surface layer cont concs seq2=’c1’ cccc1e01–e11.dat cccp01a.grf, cccp01b.grf<br />
g. bed sediment evolution seq2=’c1’ cccc1e01–e11.dat ccct01.grf<br />
h. time to reach traffic lights seq=’c1’ cccc1e01–e11.dat<br />
bbbc1e01–e11.dat<br />
dddc1e01–e11.dat<br />
Compile with extract4 --- traffic.dat<br />
Prefix = ccc<br />
For tracking origin of sediments: seq=’q2’<br />
For recording buildup of contconcs: seq2=’xx’<br />
d. kg sed/cont seq=’q2’ cccq2e01–e11.dat Last line of each file. Compile with<br />
extract1 --- sedt.dat/cont.dat<br />
e. Cumulative (kg) sed/cont seq=’q2’ cccq2e01–e11.dat *plots deleted*<br />
2. Track catchment sediments – buildc [clbuildc.bat to compile/link] event-by-event output to one file per CATCHMENT<br />
Prefix = ccc / seq=’q1’<br />
a. % sediment/contaminant seq=’q1’ cccq1c01–c07.dat Last line of each file.<br />
Compile with extract2 ---<br />
sedm.dat/conm.dat<br />
b. Cumulative (%) sediment/contaminant seq=’q1’ cccq1c01–c07.dat *plots deleted*<br />
Prefix = ccc / seq=’q2’<br />
c. kg sediment/contaminant seq=’q2’ cccq2c01–c07.dat Last line of each file.<br />
Compile with extract2 ---<br />
sedm.dat/conm.dat<br />
d. Cumulative (kg) sediment/contaminant seq=’q2’ cccq2c01–c07.dat *plots deleted*<br />
Prediction of Contaminant Accumulation in the Upper Waitemata Harbour - COPPER TP 259 87
A1.7 54-year simulation – response envelope – maximum attainable controls<br />
0. Construct database – contam [clcontam.bat to compile/link]<br />
SUBDIRECTORY<br />
54S3A2<br />
Batfile<br />
b54s3a2.dat<br />
Output<br />
x54s3a2.dat<br />
1. Build estuary sediments – builde [clbuilde.bat to compile/link] event-by-event output to one file per ESTUARY<br />
Prefix = ddd<br />
For tracking origin of sediments: seq=’q1’<br />
For recording buildup of contconcs: seq2=’c1’<br />
a. Average deposition rate over 54 years Read from screen at end<br />
b. % sed/cont seq=’q1’ cccq1e01–e11.dat Last line of each file. Compile with<br />
extract1 --- sedt.dat/cont.dat<br />
c. Cumulative (%) sed/cont seq=’q1’ cccq1e01–e11.dat *plots deleted*<br />
f. surface layer cont concs seq2=’c1’ cccc1e01–e11.dat cccp01a.grf, cccp01b.grf<br />
g. bed sediment evolution seq2=’c1’ cccc1e01–e11.dat ccct01.grf<br />
h. time to reach traffic lights seq=’c1’ cccc1e01–e11.dat<br />
bbb1e01–e11.dat<br />
dddc1e01–e11.dat<br />
Compile with extract4 --- traffic.dat<br />
Prefix = ddd<br />
For tracking origin of sediments: seq=’q2’<br />
For recording buildup of contconcs: seq2=’xx’<br />
d. kg sed/cont seq=’q2’ cccq2e01–e11.dat Last line of each file. Compile with<br />
extract1 --- sedt.dat/cont.dat<br />
e. Cumulative (kg) sed/cont seq=’q2’ cccq2e01–e11.dat *plots deleted*<br />
2. Track catchment sediments – buildc [clbuildc.bat to compile/link] event-by-event output to one file per CATCHMENT<br />
Prefix = ddd / seq=’q1’<br />
a. % sediment/contaminant seq=’q1’ cccq1c01–c07.dat Last line of each file.<br />
Compile with extract2 ---<br />
sedm.dat/conm.dat<br />
b. Cumulative (%) sediment/contaminant seq=’q1’ cccq1c01–c07.dat *plots deleted*<br />
Prefix = ddd / seq=’q2’<br />
c. kg sediment/contaminant seq=’q2’ cccq2c01–c07.dat Last line of each file.<br />
Compile with extract2 ---<br />
sedm.dat/conm.dat<br />
d. Cumulative (kg) sediment/contaminant seq=’q2’ cccq2c01–c07.dat *plots deleted*<br />
Prediction of Contaminant Accumulation in the Upper Waitemata Harbour - COPPER TP 259 88
A1.8 108-year simulation – response envelope – maximum attainable controls<br />
0. Construct database – contam [clcontam.bat to compile/link]<br />
SUBDIRECTORY<br />
108S3A2<br />
Batfile<br />
b108s3a2.dat<br />
Output<br />
x108s3a2.dat<br />
1. Build estuary sediments – builde [clbuilde.bat to compile/link] event-by-event output to one file per ESTUARY<br />
Prefix = ddd<br />
For tracking origin of sediments: seq=’q1’<br />
For recording buildup of contconcs: seq2=’c1’<br />
a. Average deposition rate over 54 years Read from screen at end<br />
b. % sed/cont seq=’q1’ cccq1e01–e11.dat Last line of each file. Compile with<br />
extract1 --- sedt.dat/cont.dat<br />
c. Cumulative (%) sed/cont seq=’q1’ cccq1e01–e11.dat *plots deleted*<br />
f. surface layer cont concs seq2=’c1’ cccc1e01–e11.dat cccp01a.grf, cccp01b.grf<br />
g. bed sediment evolution seq2=’c1’ cccc1e01–e11.dat ccct01.grf<br />
h. time to reach traffic lights seq=’c1’ cccc1e01–e11.dat<br />
bbbc1e01–e11.dat<br />
dddc1e01–e11.dat<br />
Compile with extract4 --- traffic.dat<br />
Prefix = ddd<br />
For tracking origin of sediments: seq=’q2’<br />
For recording buildup of contconcs: seq2=’xx’<br />
d. kg sed/cont seq=’q2’ cccq2e01–e11.dat Last line of each file. Compile with<br />
extract1 --- sedt.dat/cont.dat<br />
e. Cumulative (kg) sed/cont seq=’q2’ cccq2e01–e11.dat *plots deleted*<br />
2. Track catchment sediments – buildc [clbuildc.bat to compile/link] event-by-event output to one file per CATCHMENT<br />
Prefix = ddd / seq=’q1’<br />
a. % sediment/contaminant seq=’q1’ cccq1c01–c07.dat Last line of each file.<br />
Compile with extract2 ---<br />
sedm.dat/conm.dat<br />
b. Cumulative (%) sediment/contaminant seq=’q1’ cccq1c01–c07.dat *plots deleted*<br />
Prefix = ddd / seq=’q2’<br />
c. kg sediment/contaminant seq=’q2’ cccq2c01–c07.dat Last line of each file.<br />
Compile with extract2 ---<br />
sedm.dat/conm.dat<br />
d. Cumulative (kg) sediment/contaminant seq=’q2’ cccq2c01–c07.dat *plots deleted*<br />
Prediction of Contaminant Accumulation in the Upper Waitemata Harbour - COPPER TP 259 89