Greenhouse Effect and Atmospheric Chemistry
Greenhouse Effect and Atmospheric Chemistry
Greenhouse Effect and Atmospheric Chemistry

You also want an ePaper? Increase the reach of your titles
YUMPU automatically turns print PDFs into web optimized ePapers that Google loves.
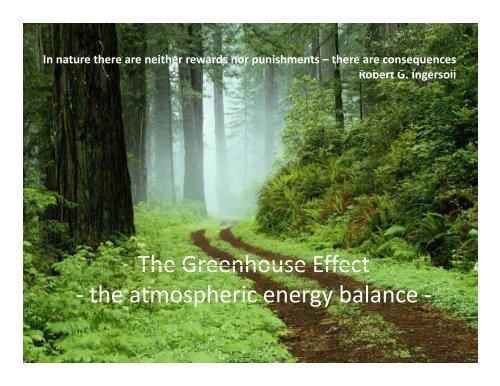
In nature there are neither rewards nor punishments –there are consequences<br />
Robert tG G. Ingersoll<br />
The <strong>Greenhouse</strong> <strong>Effect</strong><br />
‐ the atmospheric energy balance ‐
Organic Carbon Cycle<br />
The pre‐industrial (1800) amount of CO 2 in the<br />
atmosphere was 600Gt, balanced by equilibrium<br />
between absorption by photosynthesis <strong>and</strong><br />
sequestration <strong>and</strong> emission through respiration<br />
<strong>and</strong> release.<br />
d(<br />
CO2)<br />
dt<br />
d(<br />
CO2)<br />
dt<br />
d(<br />
CO2)<br />
dt<br />
abs<br />
abs<br />
ems<br />
d(<br />
CO2)<br />
<br />
dt<br />
Gt<br />
74<br />
y<br />
atm<br />
atm<br />
ems<br />
0<br />
ocean<br />
Gt<br />
74.6<br />
y<br />
ocean<br />
0.6<br />
Gt<br />
y<br />
Gt<br />
50<br />
y<br />
soil<br />
soil<br />
100<br />
Gt<br />
y<br />
Gt<br />
50<br />
y<br />
photosynth.<br />
respiration<br />
Each process has its own time scale depending<br />
on the conversion rate which in turn depend on<br />
environmental conditions such as light, water,<br />
temperature. The conversion rate is proportional<br />
to the product of CO 2 abundance in the reservoir,<br />
the conversion cross section <strong>and</strong> the<br />
leaf area A.<br />
R<br />
conv<br />
N ,<br />
CO<br />
2<br />
<br />
L,<br />
H T A
Photosynthesis<br />
<br />
<br />
chlorophyll<br />
<br />
sunlight<br />
<br />
<br />
C<br />
6<br />
H<br />
O 6<br />
O<br />
6<br />
CO2<br />
<br />
6<br />
H<br />
2<br />
O<br />
12 6<br />
6<br />
2<br />
<strong>and</strong> respiration<br />
C 6 H12 O6<br />
<br />
6<br />
O2<br />
<br />
6<br />
CO2<br />
<br />
6<br />
H<br />
2<br />
O<br />
Chemical reaction takes place<br />
on a pico‐second timescale<br />
which translates into a high<br />
reaction probability or crosssection.<br />
The absorption yield<br />
depends on the cross section<br />
integrated over the spectrum of<br />
the incoming light <strong>and</strong> the<br />
luminosity the actual light<br />
absorption <strong>and</strong> conversion<br />
cross section depends on the<br />
wavelength, the leaf structure,<br />
t<br />
the pigment composition <strong>and</strong><br />
the cell conversion mechanism.<br />
The timescale for CO 2 absorption is fast, making<br />
photosynthesis an extremely efficient absorption<br />
process if sufficient leaf surface area is available!
Change of balance<br />
Increase of CO 2 emission <strong>and</strong> increase of deforestation since the 19 th century!
Drastic increase of the anthropogenic<br />
CO 2 production due to fossil fuel<br />
consumption by growing<br />
industrialization<br />
Impact on CO 2 equilibrium conditions, which<br />
maintain the present status quo in climate !
Observational evidence, CO 2<br />
YEAR<br />
The dashed red line with diamond symbols represents the monthly mean values,<br />
centeredonthemiddleofeachmonth.Theblack line with the square symbols<br />
represents the same, after correction for the average seasonal cycle. The curve shows<br />
a continuous increase of the CO 2 level in Earth’s atmosphere .
CO 2 Global Distribution<br />
2
Strong seasonal variations<br />
due to climate variances<br />
between the northern <strong>and</strong><br />
the southern hemisphere<br />
<strong>and</strong> feed back correlations<br />
over the year.<br />
CO 2 observations from Mauna<br />
Loa reflect medium location in<br />
northern hemisphere, but the<br />
observations reflect consistently<br />
the seasonal variations in CO 2 emission
Other <strong>Greenhouse</strong> Gases<br />
N 2 O nitrous oxide level was stable<br />
for the last 3000 years according to<br />
ice core analysis. The present<br />
annual increase in emission i by 0.2%<br />
to 0.3% is due to widespread <strong>and</strong><br />
rapidly increasing applications of<br />
nitrogen based fertilizers, tropical<br />
deforestation, <strong>and</strong> conversion of<br />
forest to pasture <strong>and</strong> farml<strong>and</strong>.<br />
CH 4 methane increases at an annual rate of 0.8% to<br />
1%. Thistrackswell with ihpopulation growth. Naturally<br />
occurring from wetl<strong>and</strong>s such as bog <strong>and</strong> swamp<br />
emissions the increase is associated with rice<br />
cultivation, l<strong>and</strong>fills, biomass burning, mining, natural<br />
gas venting, <strong>and</strong> pipeline leaks. Release of CH 4 from<br />
Alaskan <strong>and</strong> Siberian permafrost regions could result<br />
in an sudden increase by 500Gt within next century.<br />
CFC chlorofluorocarbons have been<br />
developed in the 1920ies for<br />
cleaning solvents, refrigerants, <strong>and</strong><br />
propellants spray cans. Industrial<br />
mass production after 1950 caused<br />
an unprecedented increase. Inert to<br />
chemical processes expected to<br />
occur in the troposphere, p CFCs<br />
accumulate in the stratosphere,<br />
where photodissociation breaks up<br />
molecules, releasing halogen gases.
Anthropogenic sources of CO 2
Alternative World Views<br />
http://www.worldmapper.org/display.php?selected=295<br />
Territory size shows the proportion of carbon dioxide emissions in 1980, 2000, 2006.<br />
CO 2 emission 1980 CO 2 emission 2000<br />
>17t/p<br />
>2t/p<br />
~8t/p<br />
~6t/p<br />
>2t/p<br />
~3t/p<br />
CO CO emission 2006 per capita<br />
2 emission 2006 2<br />
"... the world need[s] to differentiate between the survival emissions of<br />
the poor <strong>and</strong> luxury emissions of [the] rich." Sunita Narain, 2002
<strong>Greenhouse</strong> gases<br />
<strong>Greenhouse</strong>gasestraptheemittedinfraredradiationfromearthsurfaceinthe<br />
lower troposphere by atomic or molecular absorption processes, causing a<br />
gradual heating of the lower atmosphere layer.<br />
H 2 O is the most natural occurring greenhouse gas (humidity, clouds). CO 2 is<br />
2 2<br />
primarily an anthropogenic greenhouse gas (industry, traffic). Additional<br />
anthropogenic greenhouse gases are industry produced Chlorofluorcarbons<br />
(CFCs) <strong>and</strong> Hydrofluorcarbons (HCFCs).
Single layer <strong>Greenhouse</strong> model<br />
Infrared radiation from theearth surface of emission i temperaturet<br />
T e is completely absorbed in atmosphere <strong>and</strong> radiates into space<br />
<strong>and</strong> back to earth surface increasing surface temperature T s .<br />
F 0<br />
( 1<br />
)<br />
F<br />
Incoming net solar flux:<br />
0<br />
F avg<br />
<br />
F 0 4<br />
( 1 ) F<br />
i<br />
4 0<br />
Emission temperature: T e<br />
<br />
F<br />
Flux A ↑ radiated to space<br />
depends on atmospheric<br />
temperature T a :<br />
A<br />
<br />
T<br />
4 <br />
4<br />
a<br />
<br />
A<br />
<br />
F<br />
F ↑<br />
Flux S ↑ radiated from<br />
<br />
F <br />
surface with terrestrial<br />
<br />
T<br />
A 0<br />
F T<br />
s<br />
surface temperature T <br />
<br />
in <br />
s<br />
4 F<br />
Ts<br />
<br />
2<br />
4<br />
s<br />
( 1 )<br />
0<br />
4<br />
4<br />
Te<br />
<br />
Te<br />
4<br />
T 2 T<br />
1. 19 T<br />
e<br />
e<br />
Emission temperature<br />
T =255K=‐18 o e C<br />
Surface temperature:<br />
T s =303K=30 o C<br />
4
Considering a change in albedo <br />
<strong>and</strong> an atmospheric absorption <br />
T e<br />
T<br />
s<br />
<br />
<br />
4<br />
4<br />
<br />
1<br />
<br />
<br />
F<br />
<br />
<br />
<br />
4 <br />
0<br />
<br />
<br />
<br />
<br />
<br />
1<br />
<br />
F0<br />
<br />
2 T<br />
4<br />
e<br />
<br />
2 <br />
<br />
Earth’s surface temperature depends on<br />
the albedo . Increasing the albedo<br />
(reflection of incoming radiation) reduces<br />
the emission temperature T e <strong>and</strong> therefore<br />
also the temperature T s of the earth<br />
surface. Enhanced cloud coverage would<br />
cause a temperature reduction.<br />
T<br />
T<br />
2 <br />
of the emitted radiation is absorbed by the<br />
<br />
<br />
2 <br />
atmosphere (full absorption =1) reduces<br />
s<br />
4 T e<br />
a<br />
<br />
4<br />
1 1<br />
T<br />
4<br />
<br />
e<br />
2 <br />
<br />
2<br />
T<br />
No absorption: 0 ≤ ≤ 1 full absorption<br />
s<br />
A leaky greenhouse where only a fraction <br />
the greenhouse effect <strong>and</strong> lowers the<br />
surface temperature T s (This corresponds to<br />
a reduction of greenhouse gases) <strong>and</strong> also<br />
the atmospheric temperature T a .
Examples<br />
320<br />
T<br />
s<br />
2 <br />
1 1<br />
T T<br />
T<br />
<br />
<br />
<br />
<br />
2 <br />
<br />
2 <br />
<br />
2<br />
4 <br />
e a<br />
4 4<br />
e<br />
T<br />
s<br />
Tempe erature [K]<br />
300<br />
280<br />
260<br />
240<br />
220<br />
200<br />
0 0.2 0.4 0.6 0.8 1 1.2<br />
The globally averaged solar incident<br />
(or emitted) flux F e on the surface is<br />
only a fraction f≈0.16 (for =0.35)<br />
of the incoming total flux F o .<br />
<br />
Te<br />
Ts<br />
Ta<br />
T e<br />
<br />
4<br />
<br />
<br />
<br />
<br />
<br />
1<br />
F<br />
4 <br />
Emission temperature depends<br />
on the amount of incoming solar<br />
radiation flux, the insolation F o !<br />
4 1 <br />
Fe<br />
Te<br />
F<br />
4<br />
<br />
W 1 0.35 W<br />
1 6<br />
2 <br />
m 4 m<br />
0<br />
<br />
<br />
0<br />
2
Climate feed‐backs<br />
<strong>Greenhouse</strong> models have to account for several potential positive or<br />
negative feedbacks that can occur, if the equilibrium of the climate system is<br />
perturbed by an additional energy input or energy loss dQ (in units W/m 2 ).<br />
The impact can be expressed in terms of surface temperature change dT s .<br />
dTs<br />
Ts<br />
<br />
dQ QQ<br />
<br />
is a measure for climate sensitivity<br />
<br />
4<br />
3<br />
QBB Te<br />
4 Te<br />
Te<br />
4<br />
Te<br />
since const<br />
T<br />
T<br />
Q<br />
s<br />
BB<br />
<br />
s<br />
K<br />
Wm<br />
T<br />
3<br />
e<br />
T<br />
<br />
3<br />
1<br />
4 <br />
<br />
<br />
T <br />
0.26<br />
for<br />
T<br />
<br />
255<br />
K<br />
2<br />
e<br />
For every Q=1 Wm ‐2 increase in the forcing of energy balance at the earth’s<br />
surface, the surface temperature T s will change by 0.25K ! Each such change<br />
requires altering total insolation by 6 Wm ‐2 due to albedo or geometrical shifts!<br />
<br />
s<br />
e
Climate feedback from water vapor in the atmosphere depends on the<br />
saturated vapor pressure SVP. If the temperature increases the amount<br />
of water at saturation ti increases, enhancing the greenhouse effect of<br />
water <strong>and</strong> raising the temperature (humid <strong>and</strong> hot weather conditions).<br />
SVP<br />
<br />
A<br />
<br />
e<br />
0.06706<br />
T<br />
A 6.11mbar<br />
<br />
0<br />
C<br />
<br />
1<br />
A change by 1 o C leads to a 7% change in SVP<br />
Ts K<br />
0.5<br />
for Te<br />
255K<br />
2<br />
Q<br />
Wm<br />
BBH<br />
2<br />
O<br />
See lecture 7.1.<br />
<br />
d SVP<br />
SVP<br />
<br />
dT s<br />
Taking into account the water vapor for every Q=1 Wm ‐2 increase in the<br />
forcingofenergybalancethesurfacetemperatureT s will change by 0.5K !<br />
This is a positive feedback of water vapor formation. However, water<br />
vapor will favor cloud formation which increases albedo, reduces<br />
insolation <strong>and</strong> therefore reduces temperature as negative feedback.
Observed annual global temperature<br />
trends compared with the simulated<br />
global mean surface temperatures,<br />
considering separately the natural <strong>and</strong><br />
anthropogenic forcing contributions.<br />
The observed trend suggests an<br />
increasing dominance of anthropogenic<br />
based forcing contributions. This<br />
conclusion is still heavily contested!
Temperature increase predictions as<br />
a function of future CO 2 emission
Predictions IPCC 2001 for the development<br />
of mean temperatures in Europe until 2080 Reality in summer 2010<br />
Comparison with 2003<br />
Science 332 (2011)
Conclusions by the intergovernmental Panel on Climate Change (IPCC)<br />
Possible consequences<br />
predicted by theoretical<br />
model dl studies of the<br />
IPCC <strong>and</strong> other research<br />
institutions or research<br />
groups.<br />
Detailed analyses <strong>and</strong><br />
study are summarized<br />
in a number of different<br />
reports by the National<br />
Academies <strong>and</strong> are<br />
available on‐line:<br />
www.nap.edu/topics.php?topic=367
Counterstrategies: how to cool the<br />
earth by climate‐ or geoengineering<br />
g g