Statistics of redshift periodicities
Statistics of redshift periodicities
Statistics of redshift periodicities

You also want an ePaper? Increase the reach of your titles
YUMPU automatically turns print PDFs into web optimized ePapers that Google loves.
210 Current Issues in Cosmology<br />
8<br />
Count<br />
6<br />
4<br />
2<br />
0<br />
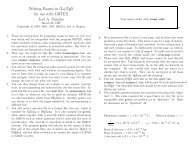
0 112.5 225 337.5 450 562.5 675<br />
dV (km/sec)<br />
Figure 17.2 Differential <strong>redshift</strong>s dV <strong>of</strong> 97 spiral galaxies in the Local Supercluster<br />
with systemic <strong>redshift</strong>s measured to σ ≤ 3s −1 . Data are plotted in the frame <strong>of</strong><br />
reference V ⊙ = 216 km s −1 ,l ⊙ = 96 ◦ ,b ⊙ =−11 ◦ and smoothed with a cut<strong>of</strong>f<br />
13 s −1 . The vertical lines are the best-fit periodicity <strong>of</strong> 37.5 s −1 . The first 21 cycles<br />
are shown, but in fact the periodicity is detectable out to at least 90 cycles within<br />
the LSC.<br />
synthetic data sets and exploration <strong>of</strong> the power they generate by chance. The<br />
hypothesis <strong>of</strong> non-periodicity is thereby rejected at a significance level ∼10 −5 .<br />
In this case, since the galaxies are scattered over the sky, individual corrections<br />
for the solar motion vary considerably and so the peak powers generated vary<br />
strongly with the adopted solar apex. A real periodic signal occurring in the frame<br />
<strong>of</strong> reference <strong>of</strong> a single velocity generates signals at other velocity vectors and<br />
identifying the “real” signal is not a trivial exercise. To find the “true” solar vector,<br />
the sensitivity <strong>of</strong> the signal to variations in the vector must be decreased. This can<br />
be done in a number <strong>of</strong> ways, but the following approach is particularly instructive.<br />
About half the galaxies in the sample belonged to small groups or associations<br />
containing two to six companions. By looking for periodicity in the differential<br />
<strong>redshift</strong>s within these groups, the sensitivity <strong>of</strong> the signal to V ⊙ may be decreased.<br />
The resulting data set is small (50 galaxies) and so was enhanced by adding galaxies<br />
obtained from a catalog by Tifft (1976) with measured signal-to-noise ratios greater<br />
than 10 and which also belonged to cataloged groups. This enhanced data set<br />
contained 80 galaxies in 28 groups scattered throughout the Local Supercluster.<br />
The power distribution in these 28 LSC groups turns out to have a well-defined<br />
maximum at ∼37.5kms −1 for a solar vector (remarkably!)<br />
V ⊙ = 220 km s −1 , l ⊙ = 90.0 ◦ , b ⊙ = 0.0 ◦


![More Effective C++ [Meyers96]](https://img.yumpu.com/25323611/1/184x260/more-effective-c-meyers96.jpg?quality=85)