Fertilizer Markets and Agricultural Production Incentives - Tegemeo ...
Fertilizer Markets and Agricultural Production Incentives - Tegemeo ...
Fertilizer Markets and Agricultural Production Incentives - Tegemeo ...

Create successful ePaper yourself
Turn your PDF publications into a flip-book with our unique Google optimized e-Paper software.
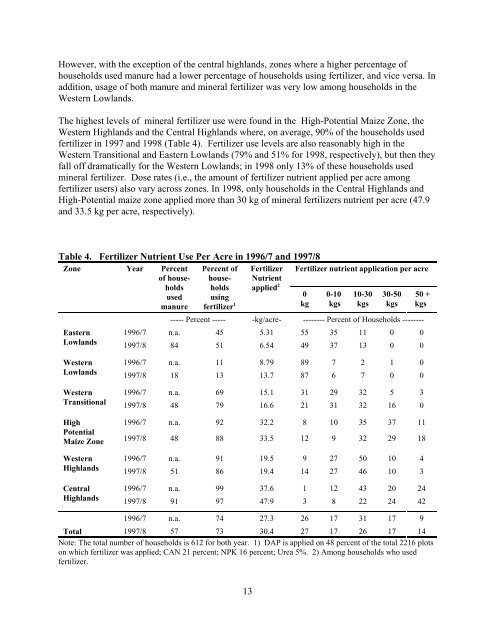
However, with the exception of the central highl<strong>and</strong>s, zones where a higher percentage of<br />
households used manure had a lower percentage of households using fertilizer, <strong>and</strong> vice versa. In<br />
addition, usage of both manure <strong>and</strong> mineral fertilizer was very low among households in the<br />
Western Lowl<strong>and</strong>s.<br />
The highest levels of mineral fertilizer use were found in the High-Potential Maize Zone, the<br />
Western Highl<strong>and</strong>s <strong>and</strong> the Central Highl<strong>and</strong>s where, on average, 90% of the households used<br />
fertilizer in 1997 <strong>and</strong> 1998 (Table 4). <strong>Fertilizer</strong> use levels are also reasonably high in the<br />
Western Transitional <strong>and</strong> Eastern Lowl<strong>and</strong>s (79% <strong>and</strong> 51% for 1998, respectively), but then they<br />
fall off dramatically for the Western Lowl<strong>and</strong>s; in 1998 only 13% of these households used<br />
mineral fertilizer. Dose rates (i.e., the amount of fertilizer nutrient applied per acre among<br />
fertilizer users) also vary across zones. In 1998, only households in the Central Highl<strong>and</strong>s <strong>and</strong><br />
High-Potential maize zone applied more than 30 kg of mineral fertilizers nutrient per acre (47.9<br />
<strong>and</strong> 33.5 kg per acre, respectively).<br />
Table 4. <strong>Fertilizer</strong> Nutrient Use Per Acre in 1996/7 <strong>and</strong> 1997/8<br />
Zone Year Percent Percent of <strong>Fertilizer</strong> <strong>Fertilizer</strong> nutrient application per acre<br />
of householdholds<br />
house-<br />
Nutrient<br />
applied 2<br />
used using<br />
0 0-10 10-30 30-50 50 +<br />
manure fertilizer 1<br />
kg kgs kgs kgs kgs<br />
----- Percent ----- -kg/acre- -------- Percent of Households --------<br />
Eastern 1996/7 n.a. 45 5.31 55 35 11 0 0<br />
Lowl<strong>and</strong>s<br />
1997/8 84 51 6.54 49 37 13 0 0<br />
Western<br />
Lowl<strong>and</strong>s<br />
Western<br />
Transitional<br />
High<br />
Potential<br />
Maize Zone<br />
Western<br />
Highl<strong>and</strong>s<br />
Central<br />
Highl<strong>and</strong>s<br />
1996/7 n.a. 11 8.79 89 7 2 1 0<br />
1997/8 18 13 13.7 87 6 7 0 0<br />
1996/7 n.a. 69 15.1 31 29 32 5 3<br />
1997/8 48 79 16.6 21 31 32 16 0<br />
1996/7 n.a. 92 32.2 8 10 35 37 11<br />
1997/8 48 88 33.5 12 9 32 29 18<br />
1996/7 n.a. 91 19.5 9 27 50 10 4<br />
1997/8 51 86 19.4 14 27 46 10 3<br />
1996/7 n.a. 99 37.6 1 12 43 20 24<br />
1997/8 91 97 47.9 3 8 22 24 42<br />
1996/7 n.a. 74 27.3 26 17 31 17 9<br />
Total 1997/8 57 73 30.4 27 17 26 17 14<br />
Note: The total number of households is 612 for both year. 1) DAP is applied on 48 percent of the total 2216 plots<br />
on which fertilizer was applied; CAN 21 percent; NPK 16 percent; Urea 5%. 2) Among households who used<br />
fertilizer.<br />
13