Improving Kenya's Domestic Horticultural Production and Marketing
Improving Kenya's Domestic Horticultural Production and Marketing
Improving Kenya's Domestic Horticultural Production and Marketing

Create successful ePaper yourself
Turn your PDF publications into a flip-book with our unique Google optimized e-Paper software.
Egerton University<br />
˚<br />
Tegemeo Institute of Agricultural<br />
Policy <strong>and</strong> Development<br />
Working Paper No. 08A/2004<br />
IMPROVING KENYA'S DOMESTIC HORTICULTURAL PRODUCTION AND<br />
MARKETING SYSTEM: CURRENT COMPETITIVENESS, FORCES OF CHANGE,<br />
AND CHALLENGES FOR THE FUTURE<br />
VOLUME I:<br />
HORTICULTURAL PRODUCTION<br />
By<br />
Kavoi Mutuku Muendo <strong>and</strong> David Tschirley<br />
Tegemeo Institute Of Agricultural Policy <strong>and</strong> Development, Egerton University.<br />
P.O Box 20498 Nairobi.<br />
Tel: (020) 2717818<br />
Email: egerton@tegemeo.org <strong>and</strong>/or tschirle@msu.edu<br />
Support for this research has been provided by the Tegemeo Agricultural Monitoring <strong>and</strong><br />
Policy Analysis Project (TAMPA) between Tegemeo Insitute/Egerton University <strong>and</strong> the<br />
Department of Agricultural Economics at Michigan State University. Financial support for<br />
this project is provided by the Kenya Mission of the United States Agency for International<br />
Development. Additional support is also provided by MSU through resources from the Food<br />
Security III Cooperative Agreement.
ACKNOWLEDGEMENTS<br />
The authors thank Samuel K. Mburu for assistance in data collection, data analysis <strong>and</strong><br />
editing, <strong>and</strong> Sindi Kirimi for assistance in data analysis <strong>and</strong> editing.<br />
ii
TABLE OF CONTENTS<br />
LIST OF TABLES............................................................................................................ IV<br />
LIST OF FIGURES............................................................................................................V<br />
LIST OF FIGURES............................................................................................................V<br />
LIST OF ACRONYMS .................................................................................................... VI<br />
EXECUTIVE SUMMARY .............................................................................................VII<br />
IMPROVING KENYA'S DOMESTIC HORTICULTURAL PRODUCTION AND<br />
MARKETING SYSTEM: CURRENT COMPETITIVENESS, FORCES OF<br />
CHANGE, AND CHALLENGES FOR THE FUTURE......................................1<br />
1. INTRODUCTION.....................................................................................................1<br />
1.1 BACKGROUND AND OBJECTIVES........................................................................................................1<br />
1.2. DATA AND METHODS..........................................................................................................................3<br />
2. PRODUCTION TRENDS FOR DOMESTIC AND INTERNATIONAL<br />
MARKETS ...............................................................................................................5<br />
2.1 FRUIT PRODUCTION ...........................................................................................................................5<br />
2.2 VEGETABLE PRODUCTION .................................................................................................................9<br />
2.3 INTERNATIONAL EXPORT AND DOMESTIC MARKET SHARES.........................................................13<br />
3. FRUITS AND VEGETABLES IN RURAL HOUSEHOLD LIVELIHOODS .17<br />
3.1 MOST WIDELY GROWN AND SOLD HORTICULTURAL CROPS ........................................................17<br />
3.2. INCOME SHARE ANALYSIS ...............................................................................................................19<br />
3.3. CONCENTRATION OF HORTICULTURAL PRODUCTION AND SALES.................................................19<br />
3.4 SUMMARY .........................................................................................................................................22<br />
4. COSTS OF PRODUCTION FOR ONION IN TANZANIA AND KENYA......26<br />
4.1 COST OF PRODUCTION .....................................................................................................................26<br />
4.2. ONION STORAGE...............................................................................................................................28<br />
5. CONCLUSIONS AND RECOMMENDATIONS................................................30<br />
REFERENCES ..................................................................................................................32<br />
APPENDIX A. TRENDS IN FRUIT PRODUCTION IN KENYA. ............................35<br />
APPENDIX B. TRENDS IN VEGETABLE PRODUCTION IN KENYA. ................37<br />
APPENDIX C: ENTERPRISE BUDGETS FOR ONIONS IN KENYA AND<br />
TANZANIA ............................................................................................................39<br />
iii
LIST OF TABLES<br />
TABLE 2.1 AREA AND PRODUCTION SHARES OF SEVEN OF FRUIT CROPS IN KENYA, IN 1992 AND<br />
2001...........................................................................................................................5<br />
TABLE 2.2. COMPARISON OF FRUIT YIELD (MT/HA) AMONG TOP WORLD PRODUCERS BY TOTAL<br />
PRODUCTION) AND KENYA IN 2001...............................................................................9<br />
TABLE 2.3: AREA AND PRODUCTION SHARES OF VEGETABLE CROPS IN KENYA, IN 1992<br />
AND 2001 .................................................................................................................9<br />
TABLE 2.4: VEGETABLE YIELDS (MT/HA) AMONG TOP WORLD PRODUCERS (BY TOTAL<br />
PRODUCTION) AND KENYA IN 2001 ........................................................................11<br />
TABLE 3.1 DISTRICTS AND SAMPLE SIZES BY ZONE IN “HIGH POTENTIAL” AND “LOW<br />
POTENTIAL” SAMPLES..............................................................................................17<br />
TABLE 3.2 PERCENT OF HOUSEHOLDS GROWING AND SELLING HORTICULTURAL CROPS, AND<br />
AVERAGE VALUE OF HORTICULTURAL PRODUCTION AND SALES, BY GEOGRAPHICAL<br />
AREA IN SELECTED “HIGH POTENTIAL” AREAS OF KENYA .......................................18<br />
TABLE 3.3. MOST WIDELY GROWN AND SOLD HORTICULTURAL CROPS, BY GEOGRAPHICAL AREA<br />
IN SELECTED “HIGH POTENTIAL” AREAS OF KENYA ................................................18<br />
TABLE 3.4. MOST VALUABLE HORTICULTURAL CROPS IN PRODUCTION AND SALES, BY<br />
GEOGRAPHICAL AREA IN SELECTED “HIGH POTENTIAL” AREAS OF KENYA..............19<br />
TABLE 3.5 INCOME SHARES BY GEOGRAPHICAL AREA IN SELECTED AREAS OF KENYA .............20<br />
TABLE 3.6. CONCENTRATION OF HORTICULTURAL SALES: PERCENT OF TOTAL SALES BY<br />
QUINTILES OF TOTAL HOUSEHOLD HORTICULTURAL SALES VALUE..........................20<br />
TABLE 3.7 CONCENTRATION OF HORTICULTURAL SALES: DISTRIBUTION OF HOUSEHOLDS<br />
ACROSS QUINTILES OF TOTAL HOUSEHOLD HORTICULTURAL SALES VALUE, BY ZONE.21<br />
TABLE 3.8 CONCENTRATION OF HORTICULTURAL SALES: SELECTED HOUSEHOLD LEVEL<br />
INDICATORS BY QUINTILES OF TOTAL HOUSEHOLD HORTICULTURAL SALES VALUE ..24<br />
TABLE 3.9. CONCENTRATION OF HORTICULTURAL PRODUCTION AND SALES BY CROP:<br />
INDICATORS OF GEOGRAPHICAL AND HOUSEHOLD LEVEL CONCENTRATION OF TOP 10<br />
HORTICULTURAL CROPS BY SALES VALUE.................................................................25<br />
Table 4.1 Distribution of Onion <strong>Production</strong> Costs (Kshs/Acre) in Tanzania <strong>and</strong> Kenya …..27<br />
Table 4.2 Percentage Distribution of Onion <strong>Production</strong> Costs in Tanzania <strong>and</strong> Kenya ……28<br />
Table 4.3 Efficiency Measures of Onion <strong>Production</strong> in Tanzania <strong>and</strong> Kenya ……………. 28<br />
APPENDIX C<br />
TABLE C.1 ONION BUDGETS (PER ONE ACRE) FOR MANG’OLA IN TANZANIA ........................39<br />
TABLE C.2 ONION BUDGETS (PER ONE ACRE) FOR OLOITOKTOK IN KENYA..........................40<br />
TABLE C.3 ONION BUDGETS (PER ONE ACRE) FOR TAVETA IN KENYA..................................41<br />
TABLE C.4 ONION SYNTHETIC BUDGET (PER ONE ACRE) FOR NAROK, LAIKIPIA AND MERU IN<br />
KENYA ...................................................................................................................42<br />
iv
LIST OF FIGURES<br />
FIGURE 3.1 PRODUCTION OF BANANAS AND PINEAPPLES (TONS) IN KENYA (1992-2001).........6<br />
FIGURE 3.2 PRODUCTION OF CITRUS, MANGOES AND PAWPAW FRUITS (TONS) IN KENYA........6<br />
(1992-2001).............................................................................................................6<br />
FIGURE 3.3 PRODUCTION OF AVOCADOS, PASSION FRUITS AND OTHER FRUITS IN KENYA (1992-<br />
2001) .........................................................................................................................7<br />
FIGURE 3.4 YIELDS (TONS/HA) OF BANANAS, MANGOES AND PASSION FRUITS IN KENYA (1992-<br />
2001). .........................................................................................................................7<br />
FIGURE 3.5 YIELDS (TONS/HA) OF AVOCADOS, CITRUS AND PAWPAW IN KENYA.............................8<br />
(1992-2001)................................................................................................................8<br />
FIGURE 3.6 YIELDS (TONS/HA) OF PINEAPPLES IN KENYA (1992-2001). ....................................8<br />
FIGURE 3.7 PRODUCTION OF CABBAGES, TOMATOES AND KALES IN KENYA (1992-2001)......10<br />
FIGURE 3.8 PRODUCTION OF ONIONS, CARROTS AND OTHER VEGETABLES IN KENYA (1992-<br />
2001)......................................................................................................................10<br />
FIGURE 3.9 PRODUCTION OF FRENCH BEANS, TRADITIONAL VEGETABLES AND GARDEN PEAS<br />
IN KENYA (1992-2001).........................................................................................11<br />
FIGURE 3.10 YIELDS (TONS/HA) OF CABBAGES, TOMATOES AND KALES IN KENYA (1992-2001)<br />
..........................................................................................................................................12<br />
FIGURE 3.11 YIELDS (TONS/HA) OF ONIONS, CARROTS AND OTHER IN KENYA (1992-<br />
2001)…13<br />
FIGURE 3.12 YIELDS (TONS/HA) OF FRENCH BEANS, INDIGENOUS VEGETABLES AND GARDEN<br />
PEAS IN KENYA (1992-2001)...............................................................................13<br />
FIGURE 3.13 FRESH VEGETABLE EXPORTS AS SHARE OF TOTAL PRODUCTION, BY VALUE<br />
(1992-2001) .........................................................................................................15<br />
FIGURE 3.14 MARKET CHANNEL SHARES (FARM, LOCAL SALES, EXPORT SALES) OF TOTAL<br />
VEGETABLE PRODUCTION IN KENYA, 1997-2001, VALUED AT FARM-GATE PRICES15<br />
FIGURE 3.15 TOTAL VALUE ADDED (AND SHARE) IN FARM, LOCAL SALES, AND EXPORT SALES<br />
CHANNELS FOR VEGETABLES IN KENYA, 1997-2001 ............................................16<br />
APPENDIX A<br />
FIGURE A.1 AREA TREND UNDER BANANAS IN KENYA (1992-2001) ......................................35<br />
FIGURE A.2 AREA TREND UNDER CITRUS, MANGOES AND PINEAPPLES IN KENYA (1992-<br />
2001).....................................................................................................................35<br />
FIGURE A.3 AREA TREND UNDER AVOCADOS, PAWPAW AND PASSION FRUITS IN KENYA .....36<br />
(1992-2001)...........................................................................................................36<br />
APPENDIX B<br />
FIGURE B.1 AREA TRENDS UNDER CABBAGES, TOMATOES AND KALES IN KENYA (1992-2001)<br />
..........................................................................................................................................37<br />
FIGURE B.2 AREA TRENDS UNDER ONIONS, , FRENCH BEANS, CARROTS IN KENYA (1992-<br />
2001).....................................................................................................................37<br />
FIGURE B.3 AREA TRENDS UNDER INDEGENOUS VEGETABLES, GARDEN PEAS AND OTHER<br />
VEGETABLES IN KENYA (1992-2001)...................................................................38<br />
v
LIST OF ACRONYMS<br />
CIDA Canadian International Development Agency<br />
COMESA Common Market for Eastern <strong>and</strong> Southern Africa<br />
EAC East African Community<br />
EU European Union<br />
FAO Food <strong>and</strong> Agriculture Organisation<br />
FPEAK Fresh Produce Exporters Association of Kenya<br />
GDP Gross <strong>Domestic</strong> Product<br />
HCDA <strong>Horticultural</strong> Crop Development Authority<br />
IBR Institute for Biotechnology Research<br />
ICIPE International Centre of Insect Physiology <strong>and</strong> Ecology<br />
IFAD International Fund for Agricultural Development<br />
IGAD Inter-Governmental Authority<br />
JKUAT Jomo Kenyatta University of Agriculture <strong>and</strong> Technology<br />
KARI Kenya Agricultural Research Institute<br />
KBS Kenya Bureau of St<strong>and</strong>ards<br />
KEPHIS Kenya Plant Health Inspectorate Service<br />
KFA Kenya Farmers’ Association<br />
KFU Kenya Farmers Union<br />
KRA Kenya Revenue Authority<br />
KSC Kenya Seed Company<br />
MoALD Ministry of Agriculture <strong>and</strong> Livestock Development<br />
MRLs Maximum Residual Levels<br />
NCPB National Cereals <strong>and</strong> Produce Board<br />
NGOs Non-Government Organizations<br />
OPVs Open Pollinated Varieties<br />
PTA Preferential Trade Area<br />
QDS Quality Declared Seed<br />
SADC Southern African Development Community<br />
TAMPA I Tegemeo Agricultural Monitoring <strong>and</strong> Policy Analysis<br />
TFC Tanzania Fertilizer Company<br />
THRC Thika <strong>Horticultural</strong> Research Centre<br />
THRI Tengeru <strong>Horticultural</strong> Research Institute<br />
TOSCA Tanzania Official Seed Certification Agency<br />
TSC Tanzania Seed Company<br />
UK United Kingdom<br />
UNDP United Nations Development Programme<br />
USAID United States Agency for International Development<br />
WV World Vision<br />
vi
Executive Summary<br />
Kenya’s horticultural sector (defined here to include fruit <strong>and</strong> vegetable production <strong>and</strong><br />
marketing, but not flowers) has received a great deal of attention over the past decade due to<br />
the rapid <strong>and</strong> sustained growth of its exports to Europe. This impressive growth has<br />
undoubtedly contributed to increased rural incomes <strong>and</strong> reduced rural poverty in Kenya. Yet<br />
despite this growth, exports remain a small fraction of Kenya’s overall horticultural sector.<br />
For the past decade, over 90% of all fruit <strong>and</strong> vegetable production was consumed<br />
domestically, <strong>and</strong> the domestic market accounted for over 90% of the total growth in quantity<br />
of fruit <strong>and</strong> vegetable production. While over 90% of smallholder farmers in all but the arid<br />
regions of Kenya produce horticultural products, fewer than 2% do so directly for export.<br />
This overwhelming dominance of the domestic market, combined with slower growth<br />
experienced in the export sector over the past decade, the challenges that smallholders face to<br />
continue participating in the export sector, <strong>and</strong> the possibility of more rapid growth in<br />
domestic dem<strong>and</strong>, all argue for a more active focus on the potentials <strong>and</strong> constraints of<br />
domestic horticulture in Kenya. Such a focus implies also the need to assess the<br />
competitiveness of local production <strong>and</strong> marketing against that of neighboring countries such<br />
as Tanzania <strong>and</strong> Ug<strong>and</strong>a. This paper explores these key issues in three Volumes. The overall<br />
objectives of the three Volumes are to provide a broad diagnostic overview of the<br />
horticultural sector, to identify specific constraints that limit the system’s performance, to<br />
make suggestions for selected policy <strong>and</strong> programmatic changes, <strong>and</strong> to identify key research<br />
that needs to be done to guide further investments to improve sector performance. Volume I<br />
– the present volume – focuses on the farm level, examining production <strong>and</strong> area trends, the<br />
role of horticultural production in farmer livelihoods, <strong>and</strong> farm level competitiveness with<br />
Tanzania. Volumes II <strong>and</strong> III focus, respectively, on domestic <strong>and</strong> regional marketing of<br />
horticultural products, <strong>and</strong> on technical research <strong>and</strong> regulatory issues.<br />
The paper is organized as follows. Chapter 1 provides background <strong>and</strong> briefly discusses the<br />
data <strong>and</strong> methods used in the report. Chapter 2 focuses on production <strong>and</strong> yield trends for<br />
seven fruit <strong>and</strong> nine vegetable crops, <strong>and</strong> estimates the international export market share for<br />
vegetables. Chapter 3 uses household survey data to examine the role of horticultural<br />
production <strong>and</strong> sales in smallholder livelihood strategies, <strong>and</strong> evaluates the structure of<br />
production <strong>and</strong> marketing at the farm level. Chapter 4 develops partial farm budgets for<br />
onions in Tanzania <strong>and</strong> Kenya, to assess farm-level competitiveness of the two countries in<br />
this crop. Finally, Chapter 5 presents conclusions <strong>and</strong> recommendations.<br />
<strong>Production</strong> <strong>and</strong> Yield Trends: Official production <strong>and</strong> yield data indicate that the yields of<br />
fruits in Kenya over the past decade have been stagnant with the exception of bananas,<br />
mangoes <strong>and</strong> passion fruits, which have risen. <strong>Production</strong> of banana has recovered<br />
dramatically after overcoming disease problems in the mid-1990s. <strong>Production</strong> of pineapples,<br />
mangoes, avocados, <strong>and</strong> passion fruit has also trended upwards while production of citrus,<br />
pawpaw, <strong>and</strong> “other fruits” has stagnated. Citrus greening disease is a persistent problem<br />
contributing to poor performance in that sector.<br />
<strong>Production</strong> of cabbages <strong>and</strong> carrots has declined over the past decade, while kales, tomatoes<br />
<strong>and</strong> traditional vegetables show steady increases. Vegetable yields have been stagnant with<br />
the exception of French beans <strong>and</strong> indigenous vegetables, which have risen.<br />
vii
Using data from various sources for 1997-2001, we estimate that at least four- to five times<br />
more horticultural produce, by value, was sold in domestic markets than in international<br />
export markets. If produce consumed on the farm is included, the domestic share rises to 7-8<br />
times that of the export market. Value added in domestic markets (post farm gate) was at<br />
least three times that in the export sector.<br />
Horticulture in Smallholder Livelihood Strategies: <strong>Production</strong> <strong>and</strong> sales at the farm level of<br />
all the major horticultural crops in Kenya are quite concentrated. Fifteen percent of rural<br />
households account for about 80% of all horticultural sales. Concentration is higher for<br />
individual crops: in all but one of the top 10 crops, 5% of the rural population accounts for at<br />
least 50% of production <strong>and</strong> at least 70% of sales. Bananas <strong>and</strong> sukuma wiki are the least<br />
concentrated both geographically <strong>and</strong> at the household level. Improvements in production<br />
<strong>and</strong> marketing of these two crops would have the broadest impacts on income levels <strong>and</strong><br />
poverty rates. Carrots, french beans, macadamia nuts <strong>and</strong> oranges are the most concentrated.<br />
For these crops, a private sector led strategy of focused assistance to relatively few growers<br />
on production <strong>and</strong> marketing constraints could be most effective in boosting production <strong>and</strong><br />
sales. Such a strategy would not be effective in oranges unless the citrus greening problem is<br />
first addressed.<br />
Households selling the most horticultural produce are better off than other households based<br />
on a wide range or indicators. Yet this group still earns a slightly higher income share off the<br />
farm than they do through horticultural sales, suggesting substantial continued income<br />
diversification. A potential implication is that, if marketing costs <strong>and</strong> market risk can be<br />
reduced <strong>and</strong> farm level productivity increased, this group of households may be well poised<br />
to take advantage of exp<strong>and</strong>ing market opportunities through greater specialization.<br />
Regional Competitiveness: <strong>Marketing</strong> cost budgets (Volume II) show that Tanzanian<br />
oranges <strong>and</strong>, especially, onions are very competitive in the Kenyan market. Farm budgets for<br />
onion also demonstrate Tanzania’s advantage in this crop: costs of production in that<br />
neighboring country are lower by 20-50%, gross margins per acre of l<strong>and</strong> are higher by 60-<br />
300%, <strong>and</strong> gross margins per bag are higher by 15-150%. These results are driven by yields<br />
that are 45-100% higher in Tanzania <strong>and</strong> seed costs that are one-tenth those in Kenya.<br />
Higher quality of irrigation in that country may also contribute to Tanzania’s advantage, <strong>and</strong><br />
superior onion storage infrastructure at the farm level allows it to supply the Kenya market<br />
throughout the year.<br />
Conclusions <strong>and</strong> Recommendations: Fresh fruit <strong>and</strong> vegetable production <strong>and</strong> marketing<br />
value chains are becoming increasingly important to a broad array of Kenyan consumers.<br />
These also hold potential market opportunities for important segments of the smallholder<br />
farming community. Exp<strong>and</strong>ing domestic <strong>and</strong> regional markets for Kenyan horticultural<br />
produce <strong>and</strong> integrating the country’s smallholder farmers into profitable supply chains that<br />
satisfy these markets will require investment in three key areas: technical production<br />
constraints, “hard” <strong>and</strong> “soft” market infrastructure , <strong>and</strong> the legal <strong>and</strong> regulatory<br />
environment. Recommendations regarding technical production constraints (the focus of this<br />
Volume) focus on consolidating the country’s succe ss in reducing banana diseases, dealing<br />
with citrus greening disease in a cost effective manner, <strong>and</strong> improving adaptive varietal<br />
research in the context of a revised seed law that encourages the production of Quality<br />
Declared Seed at the village level.<br />
viii
<strong>Improving</strong> <strong>Kenya's</strong> <strong>Domestic</strong> <strong>Horticultural</strong> <strong>Production</strong> <strong>and</strong><br />
<strong>Marketing</strong> System: Current Competitiveness, Forces Of Change,<br />
And Challenges For The Future<br />
1. Introduction<br />
1.1 Background <strong>and</strong> Objectives<br />
Volume I: <strong>Horticultural</strong> <strong>Production</strong><br />
Kenya’s horticultural sector has received a great deal of attention from local <strong>and</strong> international<br />
researchers, government, <strong>and</strong> donors over the past decade, due to the rapid <strong>and</strong> sustained<br />
growth of its export sector (Jaffee 1994, Jaffee 1995, Swernberg 1995, Kimenye 1995,<br />
Stevens <strong>and</strong> Kennan 1999, Dolan et al. 1999, Kamau 2000, Thiru 2000, Harris et al. 2001,<br />
Minot <strong>and</strong> Ngigi 2002). From a very low base, Kenya’s horticultural exports (defined her e to<br />
include fruit <strong>and</strong> vegetables but not flowers) grew 9% per year in the first decade after<br />
independence, then 17% per year from 1974-1983 (Minot <strong>and</strong> Ngigi 2002). Growth slowed<br />
over the 1980s <strong>and</strong> 1990s, but still averaged about 4% per annum over the past decade. By<br />
the year 2000, fruit <strong>and</strong> vegetable exports amounted to US$270m, or 15% of Kenya’s total<br />
export economy. This impressive growth has undoubtedly contributed to increased rural<br />
incomes <strong>and</strong> reduced rural poverty, through both direct production effects <strong>and</strong> linkage effects,<br />
as horticultural incomes from export are re-spent in rural areas.<br />
Yet despite its rapid <strong>and</strong> sustained growth, exports remain a small fraction of Kenya’s overall<br />
horticultural sector. For the past decade, over 90% of all fruit <strong>and</strong> vegetable production was<br />
consumed domestically, either on-farm or through domestic markets. Despite higher percent<br />
growth rates in the export sector, the absolute amount of growth has come overwhelmingly<br />
from the domestic sector: between 1992/93 <strong>and</strong> 2000/01, the domestic market accounted for<br />
98% of the total growth in quantity of fruit production <strong>and</strong> 91% of the total growth in<br />
vegetable production. Even allowing for higher prices of export commodities, the dominance<br />
of the local market is clear.<br />
This dominance is reflected at the farm level. While over 90% of smallholder farmers in all<br />
but the arid regions of Kenya produce horticultural products, fewer than 2% do so directly for<br />
export (Bawden et al, 2002). Kenyan smallholders who have succeeded in producing for the<br />
export market also face a daunting set of challenges if they are to maintain their participation<br />
in the sector. These challenges are driven by increasing consumer dem<strong>and</strong> for quality <strong>and</strong><br />
food safety in the UK <strong>and</strong> continental Europe, <strong>and</strong> by the related rise of supermarkets in these<br />
areas. By the late 1990s, supermarkets’ share of the fresh fruit <strong>and</strong> vegetable market in the<br />
UK had surpassed 70%, <strong>and</strong> the share of chains among supermarkets had increased to nearly<br />
80%. Consolidation in the retail sector has led to increasing market power for large retail<br />
concerns, <strong>and</strong> much more control by them over production practices. A focus on Maximum<br />
Residue Levels (MRLs) of pesticides on fresh produce, <strong>and</strong> the need to ensure that exports do<br />
not exceed these, has led to an increasing emphasis on the traceability of horticultural<br />
production; exporters want to be able to trace production back to the specific farm from<br />
which it came in order to ensure quality <strong>and</strong> safe production <strong>and</strong> h<strong>and</strong>ling procedures.<br />
1
Researchers, development practitioners, <strong>and</strong> governments are concerned that these changes in<br />
international supply chains for horticultural <strong>and</strong> other high-value agricultural products will<br />
make it increasingly difficult for smallholders to maintain their position in this trade (Dolan<br />
et al. 1999; Dolan & Humphrey, 2001; Dolan & Sutherl<strong>and</strong>, 2002; Harris et al, 2001; Jaffee<br />
2003; Kamau <strong>and</strong> Sisule 2001). Estimates of changes in Kenyan smallholders’ share of the<br />
fresh horticultural export market vary widely. Most researchers seem to agree that shares<br />
were as high as 75% in the early 1990s (Harris 1992). The most optimistic current estimate is<br />
by Kenya’s <strong>Horticultural</strong> Crops Development Authority (HCDA), which places smallholder<br />
export market shares at 40% for fruit <strong>and</strong> 70% for vegetables, implying an overall<br />
horticultural share of 55-60%. Dolan <strong>and</strong> Sutherl<strong>and</strong> (2002) provide the lowest estimate.<br />
Based on interviews with four leading exporters, they suggest that smallholder shares fell to<br />
18% by 1998 <strong>and</strong> 11% by 2001. Minot <strong>and</strong> Ngigi (2003) suggest that this figure is probably<br />
too low, based on the small number of firms interviewed <strong>and</strong> on the tendency of exporters to<br />
underestimate smallholder shares “to satisfy European buyers who are suspicious of<br />
smallholder quality control.” Minot <strong>and</strong> Ngigi cite Jaffee (2003) as perhaps the most reliable<br />
current source. Based on interviews with several dozen exporters, he estimates smallholder<br />
export market shares of 27% for fresh vegetables <strong>and</strong> 85% for fresh fruit, for an overall<br />
horticultural share of 47%. Part of the reason for this much smaller estimated decline in<br />
smallholder participation in the export market (compared to Dolan <strong>and</strong> Sutherl<strong>and</strong>) is that<br />
about 60% of Kenya’s fresh horticultural exports are sold, not to UK sup ermarkets, which<br />
have the strictest food safety <strong>and</strong> quality requirements, but to UK wholesalers <strong>and</strong> other<br />
European countries, whose st<strong>and</strong>ards are not as strict.<br />
Thus, outright pessimism about continued Kenyan smallholder participation in fresh<br />
horticultural export markets does not seem warranted. Yet their share does appear to have<br />
fallen substantially over the past 10 years, from about 75% to under 50%. In addition,<br />
Kenya’s horticultural export sector as a whole faces increasingly stiff competition fro m other<br />
African countries such as Cote d’ Ivoire, Morocco, Zimbabwe, South Africa <strong>and</strong> Cameroon.<br />
Kenya’s horticultural export expansion has been aided by the country’s preferential duty -free<br />
access to EU markets under the Lome Agreement, which currently runs through 2008. If this<br />
agreement is not renewed, or if other developing countries obtain similar benefits, Kenya can<br />
expect to face even stiffer competition in these markets. Finally, food safety st<strong>and</strong>ards in<br />
Europe, with emphases on traceability <strong>and</strong> process st<strong>and</strong>ards, are set to become much more<br />
strict in January 2005 under EUROPGAP, implying even higher barriers to smallholder<br />
participation. Thus, the continued growth of Kenya’s horticultural exports, <strong>and</strong> the ability of<br />
smallholder farmers to participate in any growth that does occur, cannot be taken for granted.<br />
Kenya’s economy is also changing, with continued high rates of urbanization expected to<br />
drive increases in dem<strong>and</strong> for horticultural products. If the new government is able to reverse<br />
the country’s economic decline <strong>and</strong> stimulate private investment to generate renewed growth<br />
in per capita incomes, then the increase in domestic dem<strong>and</strong> for horticultural products will<br />
accelerate. 1 Responding to this growing dem<strong>and</strong> will require increased productivity in both<br />
the production <strong>and</strong> marketing parts of the value chain; if productivity <strong>and</strong> quality remain low<br />
in either part of the chain, poor consumers will be faced with increasing prices, <strong>and</strong> small<br />
farmers may see little effective growth in the dem<strong>and</strong> for their output.<br />
1 Income elasticities of dem<strong>and</strong> for fruits <strong>and</strong> vegetables are generally high.<br />
2
All of these factors – the overwhelming dominance of the domestic market, the slower<br />
growth experienced in the export sector over the past decade, the challenges that smallholders<br />
face to continue participating in the sector, the possibility of more rapid growth in domestic<br />
dem<strong>and</strong>, <strong>and</strong> the need for productivity growth in both production <strong>and</strong> marketing to meet this<br />
dem<strong>and</strong> <strong>and</strong> protect the real incomes of poor consumers – argue for a more active focus on<br />
the potentials <strong>and</strong> constraints that the domestic horticultural market faces in Kenya. A focus<br />
on the domestic market implies also the need to assess the competitiveness of local<br />
production <strong>and</strong> marketing against that of neighboring countries such as Tanzania <strong>and</strong><br />
Ug<strong>and</strong>a. In this paper we explore these key issues in three Volumes. The overall objectives<br />
of the three Volumes are to provide a broad diagnostic overview of the horticultural sector, to<br />
identify specific constraints that limit the system’s performance, to make suggestions for<br />
selected policy <strong>and</strong> programmatic changes, <strong>and</strong> to identify key research that needs to be done<br />
to guide further investments to improve sector performance. Volume I – the present volume<br />
– focuses on the farm level, examining production <strong>and</strong> area trends, the role of horticultural<br />
production in farmer livelihoods, <strong>and</strong> farm level competitiveness with Tanzania. Volumes II<br />
<strong>and</strong> III focus, respectively, on domestic <strong>and</strong> regional marketing of horticultural products, <strong>and</strong><br />
on technical research <strong>and</strong> regulatory issues.<br />
The specific objectives of this Volume are to:<br />
¡<br />
¡<br />
¡<br />
¡<br />
Examine production <strong>and</strong> yield trends <strong>and</strong> compare the relative sizes of domestic <strong>and</strong><br />
export horticulture in the economy;<br />
Estimate the share of domestic FFV production going to international <strong>and</strong> domestic<br />
markets;<br />
Assess the contribution of domestic horticulture to the livelihoods of rural agricultural<br />
households;<br />
Investigate the farm level competitiveness of Kenya’s onion production relative to that of<br />
Tanzania; <strong>and</strong><br />
Recommend steps that should be taken to place Kenya’s d omestic horticulture in a<br />
position to compete favorably in local <strong>and</strong> regional markets.<br />
1.2. Data <strong>and</strong> Methods<br />
To undertake this study, data were obtained from several sources. <strong>Production</strong> trends are<br />
based on time series data on area <strong>and</strong> production of fruits <strong>and</strong> vegetables from Ministry of<br />
Agriculture, L<strong>and</strong>s, <strong>and</strong> Rural Development (MoALRD). Estimates of production entering<br />
international export <strong>and</strong> domestic market channels are based on vegetable production data<br />
from MoALRD <strong>and</strong> HCDA data on the volume <strong>and</strong> value of fresh vegetable exports. Rural<br />
livelihood results are based on the TAMPA II cross-sectional data set collected through a<br />
nation-wide household survey undertaken by Tegemeo Institute in 2000. The household<br />
survey covered a wide range of issues related to rural household economies i.e. household<br />
characteristics, agricultural production, off-farm activities, <strong>and</strong> others. The sample covered a<br />
total of 1,549 households in 24 Districts, some of which are important in horticultural<br />
production. The Districts are grouped into seven agro-ecological zones for this analysis.<br />
Onion enterprise budgets are based on primary data collected in Mang’ola area of in<br />
Tanzania, Taveta <strong>and</strong> Oloitoktok in Kenya, <strong>and</strong> for Narok, Laikipia <strong>and</strong> Meru in Kenya.<br />
Data from the last three areas were averaged to get one representative synthetic budget for<br />
production areas far removed from Mang’ola <strong>and</strong> Taveta/Oloitoktok region. In each case, 5 -<br />
3
7 farmers were interviewed as a group to develop an average farm budget for the commodity<br />
in that area.<br />
Secondary data on various aspects of domestic <strong>and</strong> export horticulture were gathered from<br />
Kenya Revenue Authority, <strong>Horticultural</strong> Crop Development Authority, Ministry of<br />
Agriculture Livestock <strong>and</strong> Rural Development-Horticulture Division, Ministry of Trade <strong>and</strong><br />
Industry, <strong>and</strong> Central Bureau of Statistics.<br />
The paper is organized as follows. Chapter 2 focuses on production <strong>and</strong> yield trends for<br />
seven fruit <strong>and</strong> nine vegetable crops, <strong>and</strong> identifies the international export market share for<br />
vegetables. Chapter 3 uses household survey data to examine the role of horticultural<br />
production <strong>and</strong> sales in smallholder livelihood strategies, <strong>and</strong> evaluates the structure of<br />
production <strong>and</strong> marketing at the farm level. Chapter 4 develops farm budgets for onions in<br />
Kenya <strong>and</strong> Tanzania as a means to evaluate Kenya’s competitiveness in this crop. Finally,<br />
Chapter 5 presents conclusions, recommendations, <strong>and</strong> suggestions for further research.<br />
4
2. <strong>Production</strong> Trends for <strong>Domestic</strong> <strong>and</strong> International Markets<br />
This chapter discusses the current status <strong>and</strong> trends in production of fruits <strong>and</strong> vegetables for<br />
domestic <strong>and</strong> export markets in Kenya in the last decade. It relies on official data from<br />
Ministry of Agriculture, L<strong>and</strong>, <strong>and</strong> Rural Development (MoALRD). 2<br />
2.1 Fruit <strong>Production</strong><br />
Fruits are grown for generation of food <strong>and</strong> income, as well as providing raw materials for<br />
processing firms. According to MoALRD, the top seven fruits in Kenya in terms of area <strong>and</strong><br />
total production are bananas, citrus fruits, mangoes, avocados, passion fruits, pineapples <strong>and</strong><br />
papaws. Each fruit’s proportion of total area <strong>and</strong> production between 1992 <strong>and</strong> 2001 are<br />
shown in Table 2.1, while production trends are presented in Figures 2.1 <strong>and</strong> 2.2. Area trends<br />
are shown in Appendix A.<br />
Table 2.1 Area <strong>and</strong> production shares of seven of fruit crops in Kenya, in 1992 <strong>and</strong> 2001<br />
Fruits Area shares <strong>Production</strong> Shares<br />
1992 2001 1992 2001<br />
Bananas 63 55 58 49<br />
Citrus Fruits 13 11 7 6<br />
Mangoes 10 12 5 8<br />
Avocados 1 3 1 2<br />
Passion fruit 1 2 1 4<br />
Pineapples 6 10 22 28<br />
Pawpaw 4 5 4 4<br />
Other fruits 2 2 2 1<br />
Data Source: MoALRD<br />
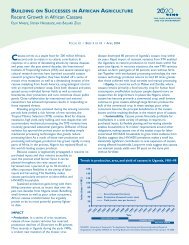
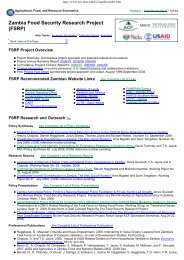
<strong>Production</strong> of bananas predominates in total fruit production, with a total area five times its<br />
closest rival <strong>and</strong> total production six times all others except pineapple. Total output of<br />
bananas declined from 1992, reached a minimum in 1995 <strong>and</strong> has been increasing ever since<br />
(Figure 2.1). The decline in banana production has been attributed to widespread diseases e.g<br />
sigatoka <strong>and</strong> panama wilts <strong>and</strong> pests such as banana weevils <strong>and</strong> nematodes in the late 1980s<br />
<strong>and</strong> early 1990s (Kahangi, 1996). During the same period, tissue culture banana<br />
biotechnology research was in progress <strong>and</strong> a breakthrough was experienced in the early<br />
1990’s. Thus, the increase in production from 1995 has been at tributed to the use of disease<br />
free biotechnology products adopted by farmers as planting materials.<br />
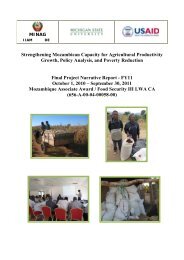
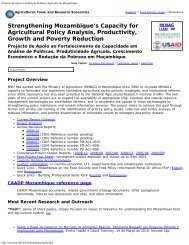
A panoramic view of all fruits over the past 10 years (Figures 2.1-2.3) indicates that the<br />
output of pineapples, mangoes, avocados <strong>and</strong> passion fruits has increased most rapidly. Total<br />
growth for various fruits over the 10 year period were: bananas 10%, citrus fruits 13%,<br />
pawpaw 25%, pineapples 60%, mangoes 99%, avocados 175%, <strong>and</strong> passion fruits 200%.<br />
2 <strong>Horticultural</strong> production data are difficult to collect <strong>and</strong> quality is thus difficult to determine. A careful<br />
assessment of MoALRD methods for estimating area <strong>and</strong> production would be a useful part of any overall<br />
attempt to improve the performance of the domestic horticultural production <strong>and</strong> marketing system.<br />
5
FIGURE 2.1: PRODUCTION OF BANANAS AND PINEAPPLES (TONS) IN KENYA (1992-2001)<br />
<strong>Production</strong> (Tons)<br />
1,200,000<br />
1,000,000<br />
800,000<br />
600,000<br />
400,000<br />
200,000<br />
-<br />
1992 1993 1994 1995 1996 1997 1998 1999 2000 2001<br />
Year<br />
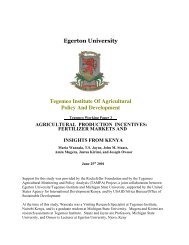
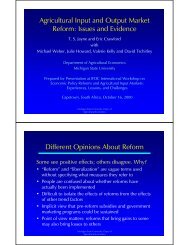
FIGURE 2.2: PRODUCTION OF CITRUS, MANGOES AND PAWPAW FRUITS (TONS) IN KENYA<br />
(1992-2001)<br />
<strong>Production</strong> (Tons)<br />
200,000<br />
180,000<br />
160,000<br />
140,000<br />
120,000<br />
100,000<br />
80,000<br />
60,000<br />
40,000<br />
20,000<br />
-<br />
1992 1993 1994 1995 1996 1997 1998 1999 2000 2001<br />
Year<br />
6<br />
Bananas<br />
Pineaples<br />
Citrus<br />
Mangoes<br />
Pawpaw
<strong>Production</strong> (Tons)<br />
FIGURE 2.3: PRODUCTION OF AVOCADOS, PASSION FRUITS AND OTHER FRUITS IN KENYA (1992-<br />
2001)<br />
6 0 ,0 00<br />
5 0 ,0 00<br />
4 0 ,0 00<br />
3 0 ,0 00<br />
2 0 ,0 00<br />
1 0 ,0 00<br />
-<br />
1 9 92 1 9 93 1 9 94 1 9 95 1 9 96 1 9 97 1 9 98 1 9 99 2 0 00 2 0 01<br />
Y e a r<br />
The production of citrus <strong>and</strong> other fruits (apples, plums, pears, water melon, grapes,<br />
strawberries etc) has been relatively flat. The stagnation in production <strong>and</strong> low yields of<br />
citrus production in Kenya have been attributed to the use of infected planting materials, use<br />
of non-budded planting materials, low use of fertilizers <strong>and</strong> irrigation, inadequate use of<br />
chemicals for pest <strong>and</strong> disease control, <strong>and</strong> planting of unimproved cultivars of scions <strong>and</strong><br />
root stocks (Obukosia <strong>and</strong> Waithaka 2000). As production has stagnated, imports from South<br />
Africa, Tanzania, <strong>and</strong> other countries have met the growing dem<strong>and</strong>. The citrus greening<br />
disease has had the greatest adverse effects on orchards in Kenya. The spread of the disease<br />
is attributed to a consignment of fruits imported from South Africa in the 1950s when the<br />
Government was trying to establish citrus production.<br />
FIGURE 2.4: YIELDS (TONS/HA) OF BANANAS, MANGOES AND PASSION FRUITS IN KENYA (1992-<br />
2001).<br />
Yields (Tons/ha)<br />
16.00<br />
14.00<br />
12.00<br />
10.00<br />
8.00<br />
6.00<br />
4.00<br />
2.00<br />
0.00<br />
1992 1993 1994 1995 1996 1997 1998 1999 2000 2001<br />
Years<br />
7<br />
Bananas<br />
Mangoes<br />
Passion Fruits<br />
A v o c a d o e s<br />
P a s s ion fruit<br />
O ther fruits
FIGURE 2.5: YIELDS (TONS/HA) OF AVOCADOS, CITRUS AND PAWPAW IN KENYA<br />
(1992-2001).<br />
Yield (Tons/ha)<br />
FIGURE 2.6: YIELDS (TONS/HA) OF PINEAPPLES IN KENYA (1992-2001).<br />
Yield (Tons/ha)<br />
18.00<br />
16.00<br />
14.00<br />
12.00<br />
10.00<br />
8.00<br />
6.00<br />
4.00<br />
2.00<br />
0.00<br />
70.00<br />
60.00<br />
50.00<br />
40.00<br />
30.00<br />
20.00<br />
10.00<br />
0.00<br />
1992 1993 1994 1995 1996 1997 1998 1999 2000 2001<br />
Years<br />
1992 1993 1994 1995 1996 1997 1998 1999 2000 2001<br />
Years<br />
The yields of most fruits in Kenya have generally been stagnant with the exception of<br />
bananas, mangoes <strong>and</strong> passion fruits, which have risen (See Figures 2.4 – 2.6). Table 2.2<br />
shows fruit yields in Kenya compared to those in the top five producing countries (by total<br />
production) in the world for each crop. Notably, the yield of avocados <strong>and</strong> pineapples is<br />
among the highest in this group, while the yield of mangoes <strong>and</strong> citrus is in the middle of the<br />
pack. The production of mangoes, pineapples, <strong>and</strong> avocados has been the fastest growing<br />
among the seven main fruit crops in Kenya (only passion fruit has shown higher percentage<br />
growth in production over the past 10 years). The technology <strong>and</strong> production system for each<br />
fruit differs, however, from country to country. For example, in Kenya production of<br />
pineapples is entirely on plantations <strong>and</strong> it is both a capital- <strong>and</strong> input intensive system<br />
(Jaffee, 1994). The yields would therefore be expected to be higher than those of the<br />
countries where the production system is by smallholder farms. Bananas, on the other h<strong>and</strong>,<br />
are produced under much less intensive systems in Kenya than in leading countries like Costa<br />
Rica <strong>and</strong> Egypt, <strong>and</strong> thus show much lower yields.<br />
8<br />
Avocadoes<br />
Citrus<br />
Pawpaws
Table 2.2. Comparison of Fruit Yield (MT/Ha) Among Top World Producers by Total<br />
<strong>Production</strong>) <strong>and</strong> Kenya in 2001.<br />
Bananas Citrus Mangoes Pineapples Avocados<br />
Country Yield Country Yield Country Yield Country Yield Country Yield<br />
Kenya 14.6 Kenya 5.8 Kenya 10.9 Kenya 43.8 Kenya 12.2<br />
Costa Rica 47.9 Japan 21.9 Sudan 20.5 Colombia 40.8 Dominican 13.1<br />
Egypt 41.0 China 8.5 Congo 16.5 Phillipines 36.8 Mexico 10.0<br />
Equador 33.0 Nigeria 4.5 China 11.1 USA 36.0 USA 7.8<br />
Mexico 28.9 Guinea 5.1 Brazil 8.0 Thail<strong>and</strong> 22.4 Brazil 6.9<br />
Brazil 11.7 Guatemala 4.2 Nigeria 5.8 China 22.3 China 5.5<br />
Source: FAO Statistics 2001, www.fao.org<br />
2.2 Vegetable <strong>Production</strong><br />
Estimates of annual per capita consumption of vegetables in Kenya are around 20 kilograms<br />
in rural areas <strong>and</strong> 40 kilograms in urban areas (National Development Plan 1994-1996).<br />
Cabbages, kales, tomatoes, onions, carrots, French beans, garden peas <strong>and</strong> traditional<br />
vegetables are prominent among the vegetables produced, in terms of area <strong>and</strong> total output<br />
(Table 2.3). However, cabbages, tomatoes <strong>and</strong> kales have predominated in vegetable<br />
production for at least the past decade. The total production trends over the past 10 years are<br />
presented in Figures 2.7 to 2.9 below whereas the area trends are shown in Appendix B.<br />
Trends in production for most vegetables show a slight increase (Figures 2.7-2.9). However,<br />
cabbages show a sharp drop in 1993 <strong>and</strong> stagnation since that time, while carrots show steady<br />
decline in output, with partial recovery in production in 2001. Kales, tomatoes <strong>and</strong><br />
traditional vegetables show steady increases in output.<br />
Table 2.3: Area <strong>and</strong> production shares of vegetable crops in Kenya, in 1992 <strong>and</strong> 2001<br />
Fruits Area shares <strong>Production</strong> Shares<br />
1992 2001 1992 2001<br />
Cabbages 25 17 32 22<br />
Kales 21 25 25 31<br />
Tomatoes 17 18 22 24<br />
Onions 6 6 5 5<br />
Carrots 6 4 6 5<br />
French Beans 8 6 2 2<br />
Garden Peas 8 7 2 2<br />
Traditional Vegetables 5 10 3 5<br />
Other Vegetables 4 7 3 4<br />
Data Source: MoALRD<br />
9
FIGURE 2.7: PRODUCTION OF CABBAGES, TOMATOES AND KALES IN KENYA (1992-2001)<br />
FIGURE 2.8: PRODUCTION OF ONIONS, CARROTS AND OTHER VEGETABLES IN KENYA<br />
(1992-2001).<br />
<strong>Production</strong> (tons)<br />
<strong>Production</strong> (MT)<br />
400,000<br />
350,000<br />
300,000<br />
250,000<br />
200,000<br />
150,000<br />
100,000<br />
50,000<br />
-<br />
70,000<br />
60,000<br />
50,000<br />
40,000<br />
30,000<br />
20,000<br />
10,000<br />
-<br />
1992 1993 1994 1995 1996 1997 1998 1999 2000 2001<br />
Year<br />
1992 1993 1994 1995 1996 1997 1998 1999 2000 2001<br />
Ye ar<br />
10<br />
Cabbages.<br />
Tomatoes<br />
Kales.<br />
Onions.<br />
Carrots.<br />
Other veges.
FIGURE 2.9: PRODUCTION OF FRENCH BEANS, TRADITIONAL VEGETABLES AND GARDEN<br />
PEAS IN KENYA (1992-2001)<br />
<strong>Production</strong> (Tons)<br />
70000<br />
60000<br />
50000<br />
40000<br />
30000<br />
20000<br />
10000<br />
0<br />
1992 1993 1994 1995 1996 1997 1998 1999 2000 2001<br />
Year<br />
The yield of most vegetables has been stagnant (Figures 2.10 to 2.12). Only French beans <strong>and</strong><br />
indigenous vegetables showed a slight increase. When compared to the top five producers of<br />
each crop in the world, the yield of vegetables in Kenya is the lowest in all crops. In most of<br />
the developed countries, production of vegetables is highly capital <strong>and</strong> technology intensive.<br />
It is usually characterized by use of newly developed technologies such as fertigation in green<br />
houses e.g. in Israel. Hence most weather factors are made controllable, production is evened<br />
out through the year <strong>and</strong> output per unit of l<strong>and</strong> is relatively high. This is in contrast with<br />
production conditions in Kenya where it is usually rain-fed <strong>and</strong> takes place at almost one<br />
point in time. Most farmers also lack knowledge <strong>and</strong> skills on production techniques. This<br />
has resulted in low yields compared to other world producers as well as frequently low<br />
quality produce.<br />
Table 2.4: Vegetable Yields (Mt/ha) Among Top World Producers (by Total <strong>Production</strong>)<br />
<strong>and</strong> Kenya in 2001<br />
Cabbages Tomatoes Onions Carrots Green peas<br />
Country Yield Country Yield Country Yield Country Yield Country Yield<br />
S. Korea 61.6 Canada 78.2 Japan 46.6 UK 54.1 France 15.0<br />
Japan 40.5 USA 62.5 USA 46.4 Israel 53.6 Cyprus 11.3<br />
Russian 24.0 Italy 52.7 Iran 30.1 USA 37.3 USA 10.4<br />
India 17.9 Morocco 48.9 India 12.8 Pol<strong>and</strong> 27.9 UK 9.8<br />
China 18.9 China 25.8 China 20.8 China 17.8 China 8.1<br />
Kenya 15.6 Kenya 16.7 Kenya 11.2 Kenya 13.6 Kenya 4.0<br />
Source: FAO Statistics 2002, www.fao.org<br />
11<br />
French Beans<br />
Ind. Vegetables<br />
Garden Peas
FIGURE 2.10: YIELDS (TONS/HA) OF CABBAGES, TOMATOES AND KALES IN KENYA (1992-<br />
2001)<br />
FIGURE 2.11: YIELDS (TONS/HA) OF ONIONS, CARROTS AND OTHER IN KENYA (1992-2001)<br />
Yield (Tons/ha)<br />
18<br />
16<br />
14<br />
12<br />
10<br />
8<br />
6<br />
4<br />
2<br />
0<br />
Yield (Tons/ha)<br />
18<br />
16<br />
14<br />
12<br />
10<br />
8<br />
6<br />
4<br />
2<br />
0<br />
1992 1993 1994 1995 1996 1997 1998 1999 2000 2001<br />
1992 1993 1994 1995 1996 1997 1998 1999 2000 2001<br />
Y ears<br />
12<br />
Year<br />
Cabbages.<br />
Tomatoes<br />
Kales.<br />
O nions.<br />
Carrots.<br />
O ther vegetables
FIGURE 2.12: YIELDS (TONS/HA) OF FRENCH BEANS, INDIGENOUS VEGETABLES AND<br />
GARDEN PEAS IN KENYA (1992-2001)<br />
Yields (Tons/ha)<br />
8<br />
7<br />
6<br />
5<br />
4<br />
3<br />
2<br />
1<br />
0<br />
2.3 International Export <strong>and</strong> <strong>Domestic</strong> Market Shares<br />
Fruits <strong>and</strong> vegetables produced in Kenya can be retained on the farm, or marketed through<br />
local fresh markets, local processed markets, fresh export markets, or processed export<br />
markets. Establishing what proportion of total production flows through each of these<br />
channels is hampered by lack of data, especially on processing, <strong>and</strong> by definitional issues. In<br />
this section we first use data from several sources to estimate the proportion of total vegetable<br />
production that is a) consumed on farm, b) marketed locally, <strong>and</strong> c) exported in fresh or<br />
processed form. For comparability, we value all flows at farm-gate prices. Next, we value<br />
flows in each channel at final prices in that channel to estimate total value added in each of<br />
these channels. Together, these two results provide a picture of the relative importance of<br />
local <strong>and</strong> export markets for Kenya’s horticultural sector.<br />
We focus on vegetables for two reasons. First, vegetables appear by all accounts to<br />
contribute most to horticultural export earnings. FAOStat data on all fresh <strong>and</strong> processed<br />
horticultural exports (not including flowers) show vegetables with about a 60% share.<br />
HCDA data, which are limited to fresh exports, show vegetables with an 80-85% share over<br />
the past five years. The difference in these shares is due to the overwhelming importance of<br />
canned pineapples <strong>and</strong> pineapple juice in fruit exports – about 85% of all fruit exports<br />
according to FAOStat. Second, pineapple production <strong>and</strong> exports in Kenya are dominated by<br />
Del Monte’s vertically integrated production, processing, <strong>and</strong> export operation: including Del<br />
Monte in fruit calculations would make them less applicable to the typical smallholder or<br />
commercial farm, <strong>and</strong> we lack data to make the calculations accurately without Del Monte.<br />
Vegetable production data come from MoALRD, <strong>and</strong> include smallholder <strong>and</strong> commercial<br />
production. MoALRD values production at “farm gate” prices that it col lects. HCDA reports<br />
volume <strong>and</strong> value data for fresh vegetable exports (primarily French beans <strong>and</strong> Asian<br />
vegetables) 3 . These figures represent all exports regardless of whether they come from<br />
3 “Asian vegetables” include eggplant, chillis, dudhi, karela, okra , <strong>and</strong> other vegetables used widely in South<br />
Asian cooking<br />
1992 1993 1994 1995 1996 1997 1998 1999 2000 2001<br />
Y ears<br />
13<br />
French Beans<br />
Ind. Vegetables<br />
G arden peas
smallholder or commercial farms. HCDA values are based on FOB export prices; we<br />
revalued these fresh vegetable exports using MoALRD farm-gate prices to make the<br />
production <strong>and</strong> export figures comparable.<br />
This exercise shows that fresh vegetable exports rose from 4-5% of total vegetable<br />
production in the early 1990s to over 12% in 2000, before falling to about 7% in 2001 (Figure<br />
2.13). The trend is clearly positive; the lower figure in 2001 is slightly higher than those for<br />
1996 <strong>and</strong> 1997 <strong>and</strong> well above those of the early 1990s. Over the past 5 years (1997-2001),<br />
fresh vegetable exports averaged 9.3% of production, by value. Adding processed vegetable<br />
exports, which FAOStat data show to be about 1/3 as much, by value, as fresh exports, raises<br />
the total export share (processed plus fresh) of vegetables in Kenya between 1997 <strong>and</strong> 2001<br />
to about 12%. In the absence of more detailed data, this final calculation assumes that the<br />
mix of processed vegetable exports is comparable to fresh, <strong>and</strong> that export prices for fresh<br />
<strong>and</strong> processed are also comparable.<br />
As a final step to calculate market channel shares, we use data from the 2000 Tegemeo/MSU<br />
Tampa smallholder income survey which show that 64% of total vegetable production that<br />
year was sold, <strong>and</strong> 36% retained on farm. This calculation provides a lower bound for<br />
marketed share if we assume, as is reasonable, that commercial producers sell nearly all their<br />
production. 4 By combining all these data, we arrive at Figure 2.14, showing that the value of<br />
vegetable production sold <strong>and</strong> then consumed domestically over the past five years has been<br />
at least four-to-five times as large as the value exported in fresh <strong>and</strong> processed form (52%<br />
compared to 12%). If produce consumed on the farm is included, the domestic share rises to<br />
seven-to-eight times that of the export market.<br />
Value added per unit of farm-gate production is higher in the export sector due primarily to<br />
higher quality <strong>and</strong> health st<strong>and</strong>ards. Comparing MoALRD farm-gate prices with HCDA<br />
export prices for French beans <strong>and</strong> Asian vegetables shows that export prices of these<br />
vegetables have exceeded farm-gate prices by a factor ranging from 2.7 to 6.2 since 1992,<br />
with an average of 2.9, or 290%. In contrast, mark-ups in domestic markets are typically<br />
about 100% from farm-gate to collecting wholesaler sales, <strong>and</strong> an additional 20-25% to<br />
retail. 5 These figures imply a 150% total markup from farm-gate to retail in local markets.<br />
Applying these markup figures to the share of production flowing through the domestic <strong>and</strong><br />
export channels, <strong>and</strong> continuing to value unsold production at farm-gate prices, shows that<br />
total value added in domestic vegetable markets is nearly three times that in vegetable export<br />
markets (Figure 2.15).<br />
These calculations show two things. First, vegetable exports are an important component of<br />
the vegetable supply chain, absorbing about 20% of all sold production by value, <strong>and</strong><br />
accounting for about one-quarter of all value added after the farm gate. Second, domestic<br />
markets nonetheless remain the primary outlet for vegetable production <strong>and</strong> generate much<br />
more value added than do export markets. This conclusion will hold even more for fruit,<br />
which has a higher total value of production <strong>and</strong> lower value of exports.<br />
4 Unfortunately, MoALRD does not report production separately for smallholder <strong>and</strong> commercial farmers. This<br />
makes it impossible to calculate a more accurate marketed surplus figure.<br />
5 See Tables 6.2, 6.4, 6.6., 6.8, <strong>and</strong> 6.10 for farm-gate to collecting wholesale markups. Mark-ups from<br />
collecting wholesale to retail are based on data collected in Wakulima market in November 2003. See<br />
Appendix XX for the original price data.<br />
14
FIGURE 2.13. FRESH VEGETABLE EXPORTS AS SHARE OF TOTAL PRODUCTION, BY VALUE<br />
(1992-2001)<br />
E xport S hare, % of Total Prod'n<br />
14.000<br />
12.000<br />
10.000<br />
8.000<br />
6.000<br />
4.000<br />
2.000<br />
0.000<br />
1992 1993 1994 1995 1996 1997 1998 1999 2000 2001<br />
FIGURE 2.14. MARKET CHANNEL SHARES (FARM, LOCAL SALES, EXPORT SALES) OF TOTAL<br />
VEGETABLE PRODUCTION IN KENYA, 1997-2001, VALUED AT FARM-GATE<br />
PRICES<br />
Retained on Farm<br />
Ksh5.2B<br />
36%<br />
<strong>Production</strong><br />
Ksh 14.5B<br />
Sold then<br />
Consumed<br />
<strong>Domestic</strong>ally<br />
Ksh7.5B<br />
(52%)<br />
15<br />
Sold <strong>and</strong> Exported<br />
Ksh1.7B<br />
(12%)<br />
Source: Derived from Tegemeo/MSU 2000 household survey data, production data from MoALRD, <strong>and</strong> export data from<br />
HCDA
FIGURE 2.15. TOTAL VALUE ADDED (AND SHARE) IN FARM, LOCAL SALES, AND EXPORT<br />
SALES CHANNELS FOR VEGETABLES IN KENYA, 1997-2001<br />
Farm-gate Value,<br />
Retained<br />
on Farm<br />
Ksh 5.2B<br />
(17%)<br />
Value of <strong>Production</strong><br />
Ksh 14.5B<br />
Retail Value,<br />
<strong>Domestic</strong> Sales<br />
Ksh18.8B<br />
(61%)<br />
16<br />
FOB Value,<br />
Export Sales<br />
Ksh6.8B<br />
(22%)<br />
Source: Derived from Tegemeo/MSU 2000 household survey data, production data from MoALRD, <strong>and</strong> export data from<br />
HCDA
3. Fruits <strong>and</strong> Vegetables in Rural Household Livelihoods<br />
Rural households in Kenya participate in a wide variety of economic activities to ensure their<br />
consumption <strong>and</strong> increase their incomes. This chapter uses data from the 2000 Tegemeo/<br />
MSU Rural Household Survey to evaluate the role that horticultural production <strong>and</strong> sales play<br />
in rural livelihoods. The sample covered 1559 smallholder households in the relatively high<br />
potential areas of 24 districts. We examine seven areas of the country that were sampled in<br />
this survey, as show in Table 3.1. Surveyed areas not included in this analysis due to low<br />
sample size include Northern Arid <strong>and</strong> Marginal Rain Shadow.<br />
Table 3.1 Districts <strong>and</strong> sample sizes by zone in “high potential” <strong>and</strong> “low potential”<br />
samples<br />
Zone Districts Sample<br />
Size<br />
Coastal Lowl<strong>and</strong>s Kilifi <strong>and</strong> Kwale 80<br />
Eastern Lowl<strong>and</strong>s Taita Taveta, Kitui, Machakos, Makueni <strong>and</strong> Muingi 170<br />
Western Lowl<strong>and</strong>s Kisumu, Siaya 188<br />
Western Transitional Bungoma <strong>and</strong> Kakamega 171<br />
High Potential Maize Bungoma (higher elevations), Kakamega (higher elevations), 420<br />
Zone<br />
Bomet, Nakuru, Narok, Trans Nzoia, Uasin Gishu<br />
Western Highl<strong>and</strong>s Kisii, Vihiga 163<br />
Central Highl<strong>and</strong>s Meru, Muranga, Nyeri 268<br />
3.1 Most Widely Grown <strong>and</strong> Sold <strong>Horticultural</strong> Crops<br />
Table 3.2 shows that, throughout areas of Kenya where cropping is practiced, nearly all<br />
households grow horticultural crops. The partial exception to this pattern is in areas of the<br />
Western Lowl<strong>and</strong>s sampled in the 2000 survey. Western Lowl<strong>and</strong>s also has the lowest mean<br />
production value among those growing, the lowest percentage of households selling, <strong>and</strong> the<br />
lowest mean sales value among those selling. Eastern Lowl<strong>and</strong>s, Western Highl<strong>and</strong>s, <strong>and</strong><br />
Central Highl<strong>and</strong>s st<strong>and</strong> out for high production values, high proportions of households<br />
selling, <strong>and</strong> high mean sales values among those selling.<br />
Tables 3.3 <strong>and</strong> 3.4 illustrate the importance of different horticultural crops in production <strong>and</strong><br />
sales, by zone. Table 3.3 presents the most commonly grown <strong>and</strong> sold crops, while Table 3.4<br />
presents those crops that are most valuable in production <strong>and</strong> sales. Table 3.3 highlights the<br />
importance of bananas throughout the country. In five of the seven zones, this crop is the<br />
most widely grown, <strong>and</strong> is second in one zone; only in the Western Lowl<strong>and</strong>s is it not among<br />
the top three. In five of the zones it is the first or second most widely sold. Sukuma wiki<br />
also st<strong>and</strong>s out, being among the three most widely grown in four of the zones <strong>and</strong> among the<br />
three most widely sold in all but one zone (Coastal Lowl<strong>and</strong>s). Other widely grown crops<br />
include mangoes, pawpaw, <strong>and</strong> avocado. On the sales side, mangoes are among the three<br />
most widely sold in the Coastal <strong>and</strong> Eastern Lowl<strong>and</strong> zones, while cabbage takes third place<br />
in two of the three higher elevation zones. Avocado takes second place in both Western <strong>and</strong><br />
Central Highl<strong>and</strong>s. Surprisingly, tomatoes appear only once in the table, as the second most<br />
widely sold crop in the Coastal Lowl<strong>and</strong>s.<br />
17
Table 3.2 Percent of households growing <strong>and</strong> selling horticultural crops, <strong>and</strong> average value of<br />
horticultural production <strong>and</strong> sales, by geographical area in selected “high potential”<br />
areas of Kenya<br />
Geographical Area % of<br />
Household<br />
s Growing<br />
Mean value of<br />
production among<br />
those growing<br />
18<br />
% of<br />
Households<br />
Selling<br />
Mean value of sales<br />
among those selling<br />
Coastal Lowl<strong>and</strong>s 96.2 18,614 65.8 10,386<br />
Eastern Lowl<strong>and</strong>s 99.4 27,762 80.7 18,577<br />
Western Lowl<strong>and</strong>s 82.5 4,898 51.4 3,879<br />
Western Transitional 100.0 13,972 87.3 7,328<br />
High Potential Maize Zone 97.5 10,001 70.7 7,778<br />
Western Highl<strong>and</strong>s 100.0 19,730 90.1 12,673<br />
Central Highl<strong>and</strong>s 100.0 21,349 83.0 16,148<br />
Table 3.3. Most widely grown <strong>and</strong> sold horticultural crops, by geographical area in selected<br />
“high potential” areas of Kenya<br />
Geographical Area<br />
Coastal Lowl<strong>and</strong>s Bananas<br />
(76)<br />
Eastern Lowl<strong>and</strong>s Bananas<br />
(78)<br />
Western Lowl<strong>and</strong>s Cowpea lvs.<br />
(43)<br />
Western Transitional Bananas<br />
(90)<br />
High Potential Maize Suk. Wiki<br />
Zone<br />
(77)<br />
Western Highl<strong>and</strong>s Bananas<br />
(94)<br />
Central Highl<strong>and</strong>s Bananas<br />
(91)<br />
Most widely grown Most widely sold<br />
First Second Third First Second Third<br />
-------------- % growing -------------- ------------- % selling ---------------<br />
Cowpea lvs<br />
(75)<br />
Mangoes<br />
(64)<br />
Pawpaw<br />
(43)<br />
Suk. Wiki<br />
(77)<br />
Bananas<br />
(58)<br />
Avocado<br />
(77)<br />
Suk. Wiki<br />
(82)<br />
Coconut<br />
(73)<br />
Pumpkin<br />
(61)<br />
Mangoes<br />
(41)<br />
Pawpaw<br />
(54)<br />
Indig. Veg.<br />
(52)<br />
Suk. Wiki<br />
(68)<br />
Avocado<br />
(71)<br />
Coconut<br />
(49)<br />
Bananas<br />
(34)<br />
Mangoes<br />
(18)<br />
Bananas<br />
(56)<br />
Suk. Wiki<br />
(46)<br />
Bananas<br />
(63)<br />
Suk. Wiki<br />
(41)<br />
Tomatoes<br />
(20)<br />
Suk. Wiki<br />
(32)<br />
Bananas<br />
(18)<br />
Suk. Wiki<br />
(48)<br />
Bananas<br />
(22)<br />
Avocado<br />
(52)<br />
Avocado<br />
(35)<br />
Mangoes/<br />
Lemons (14)<br />
Mangoes<br />
(32)<br />
Suk. Wiki<br />
(14)<br />
Cowpea lvs.<br />
(23)<br />
Cabbage<br />
(21)<br />
Suk. Wiki<br />
(44)<br />
Cabbage<br />
(31)<br />
Table 3.4 shows the three most valuable crops in production <strong>and</strong> sales, <strong>and</strong> their contribution<br />
to the total value of production <strong>and</strong> sales in each zone. Bananas maintain their importance in<br />
both production <strong>and</strong> sales, while sukuma wiki, being one of the lowest priced crops, stays<br />
among the top three in both production <strong>and</strong> sales in only two zones. Tomatoes appear more<br />
often, twice among the most valuable in production <strong>and</strong> three times among the most valuable<br />
in sales.
Table 3.4. Most valuable horticultural crops in production <strong>and</strong> sales, by geographical area in<br />
selected “high potential” areas of Kenya<br />
Geographical Area<br />
Coastal Lowl<strong>and</strong>s Coconut<br />
(30)<br />
Eastern Lowl<strong>and</strong>s Bananas<br />
(22)<br />
Most valuable in production Most valuable in sales<br />
First Second Third First Second Third<br />
------- % of total prodn value ------- ------- % of total sales value -------<br />
Mangoes<br />
(26)<br />
Avocado<br />
(14)<br />
19<br />
Bananas<br />
(15)<br />
Cabbage<br />
(9)<br />
Coconut<br />
(54)<br />
Bananas<br />
(18)<br />
Western Lowl<strong>and</strong>s Bananas Mangoes Pawpaws Bananas<br />
(27) (13) (12) (26)<br />
Western Transitional Bananas Suk. Wiki Pineapple Bananas<br />
(51) (10) (7) (47)<br />
High Potential Maize Bananas Pumpkin Tomatoes Tomatoes<br />
Zone<br />
(19) (14) (14) (21)<br />
Western Highl<strong>and</strong>s Bananas Suk. Wiki Tomatoes Bananas<br />
(63) (9) (8) (58)<br />
Central Highl<strong>and</strong>s Cabbage Bananas Carrots Cabbage<br />
(27) (23) (10) (38)<br />
Note: % of total production <strong>and</strong> sales values are within zones.<br />
3.2. Income Share Analysis<br />
Mangoes<br />
(20)<br />
Avocado<br />
(13)<br />
Sugarcane<br />
(14)<br />
Suk. Wiki<br />
(14)<br />
Bananas<br />
(16)<br />
Tomatoes<br />
(12)<br />
Carrots<br />
(14)<br />
Bananas<br />
(16)<br />
Macadamia<br />
Nuts<br />
(12)<br />
Mangoes<br />
(13)<br />
Tomatoes<br />
(10)<br />
Cabbage<br />
(13)<br />
Suk. Wiki<br />
(11)<br />
Bananas<br />
(12)<br />
Income shares indicate the proportion of total household income that comes from different<br />
types of economic activities, <strong>and</strong> thus reveal the importance of different types of activities in<br />
smallholder income <strong>and</strong> food security strategies. Income includes the value of all crop <strong>and</strong><br />
livestock production, even if retained on farm, plus off-farm incomes <strong>and</strong> remittances. Table<br />
3.5 shows mean household income shares of eight different economic activities during 2000.<br />
Off-farm labor (informal business <strong>and</strong> wages plus formal salaries <strong>and</strong> remittances) is a key<br />
contributor to overall income in all zones, with shares ranging from 27-29% in Western <strong>and</strong><br />
Central Highl<strong>and</strong>s to 60% in Coastal Lowl<strong>and</strong>s. <strong>Horticultural</strong> income shares are highest in<br />
Western Highl<strong>and</strong>s at 26%, even though total value of horticultural production <strong>and</strong> sales in<br />
this area are below those in Eastern Lowl<strong>and</strong>s <strong>and</strong> Central Highl<strong>and</strong>s (Table 3.2); the<br />
discrepancy is due to very low overall income levels in the Western Highl<strong>and</strong>s. Other zones<br />
with relatively high horticultural shares are Coastal Lowl<strong>and</strong>s <strong>and</strong> Eastern Lowl<strong>and</strong>s. Only in<br />
Western Highl<strong>and</strong>s does the horticultural share exceed that of cereals, tubers, <strong>and</strong> pulses, but<br />
horticulture exceeds livestock in four of the seven zones <strong>and</strong> exceeds industrial crops in five<br />
of the seven. <strong>Horticultural</strong> sales are equivalent to or greater than sales of cereals, pulses, <strong>and</strong><br />
tubers in six of the seven zones, reflecting the fact that households tend to sell a greater<br />
proportion of their horticultural production than they do their staples.<br />
3.3. Concentration of <strong>Horticultural</strong> <strong>Production</strong> <strong>and</strong> Sales<br />
The previous results suggest that horticultural production <strong>and</strong> sales are an important but not<br />
predominant contributor to income for the average household. Yet averages can hide a great<br />
deal of variability. Examining levels of concentration of horticultural sales will allow us to<br />
peer behind these averages <strong>and</strong> assess differences in the role that horticultural production <strong>and</strong><br />
sales play across households. In Table 3.6, we break all households in our sample into seven
groups: households that did not produce any horticultural crops, households that produced but<br />
did not sell, <strong>and</strong> five groups of equal size (quintiles) among those that did sell horticultural<br />
produce, ranging from those that sold the least (quintile 1) to those that sold the most<br />
(quintile 5). Results suggest that horticultural sales are highly concentrated in Kenya. Only<br />
3% of households in the sample did not produce any horticultural crops <strong>and</strong> therefore also did<br />
not sell, but over 20% of those that did produce did not sell any. Among those that did sell,<br />
one-fifth (15% of the total population) sold extremely small amounts – only Ksh 234 on<br />
average. Nearly 80% of the total value of horticultural sales among all households was<br />
accounted for by the largest 20% of all sellers, who represent only 15% of the total<br />
population.<br />
Table 3.5 Income shares by geographical area in selected areas of Kenya<br />
Geographical Area Cereals, tubers, <strong>Horticultural</strong> IndusLive- In-formal Salary Total Total<br />
pulses crops trial crop stock off-farm <strong>and</strong> (%) (Ksh<br />
Retained Sold Retained Sold sales (wages+ Remit- per<br />
business) tances capita)<br />
Coastal Lowl<strong>and</strong>s 19.7 1.6 11.5 4.1 0.0 3.2 37.3 22.6 100 13,493<br />
Eastern Lowl<strong>and</strong>s 18.9 2.9 10.2 8.4 0.7 12.7 20.5 25.6 100 17,006<br />
Western Lowl<strong>and</strong>s 17.4 3.8 6.6 3.7 4.7 22.7 18.5 22.6 100 7,321<br />
Western Transitional 15.7 4.5 5.8 5.0 33.2 7.3 16.0 12.5 100 17,865<br />
High Pot’ Maize Zone 13.4 14.3 3.8 3.6 3.9 26.1 19.1 15.8 100 20,847<br />
Western Highl<strong>and</strong>s 20.8 3.4 12.4 13.9 16.0 6.6 8.3 18.6 100 12,716<br />
Central Highl<strong>and</strong>s 8.2 3.5 0.5 6.9 29.1 23.9 12.2 16.7 101 28,501<br />
Table 3.6. Concentration of horticultural sales: percent of total sales by quintiles of total<br />
household horticultural sales value<br />
Sales category % of<br />
farmers<br />
Average value of<br />
horticultural<br />
production per hh<br />
(Ksh)<br />
20<br />
% of total<br />
prodn in<br />
sample<br />
Average value<br />
of horticultural<br />
sales per hh<br />
(Ksh)<br />
% of total<br />
sales in<br />
sample<br />
No production 3.2 — — — ---<br />
<strong>Production</strong>, no sales 21.2 3,911 5% 0 0%<br />
1 Lowest sales 15.1 3,475 3% 234 0%<br />
2 15.1 5,927 6% 1,112 2%<br />
3 15.2 8,953 9% 2,807 5%<br />
4 15.1 15,496 15% 7,850 14%<br />
5 Highest sales 15.1 61,995 61% 43,980 79%<br />
Table 3.7 examines how these households are distributed across our seven zones. We see<br />
that Western Lowl<strong>and</strong>s has by far the highest proportion of non-producers, <strong>and</strong> that it along<br />
with Coastal Lowl<strong>and</strong>s has the highest proportion of non-sellers <strong>and</strong> the lowest proportion of
sellers in the top sales quintile. Central Highl<strong>and</strong>s, Eastern Lowl<strong>and</strong>s, <strong>and</strong> Western<br />
Highl<strong>and</strong>s st<strong>and</strong> out for their relatively large proportion of large horticultural sellers.<br />
Table 3.7 Concentration of horticultural sales: distribution of households across quintiles of<br />
total household horticultural sales value, by zone<br />
Sales category<br />
National Coastal<br />
Lowl<strong>and</strong>s<br />
East.<br />
Lowl<strong>and</strong>s<br />
21<br />
West.<br />
Lowl<strong>and</strong>s<br />
Zones<br />
Western<br />
Transitional<br />
High<br />
Potential<br />
Maize<br />
Zone<br />
West.<br />
Highl<strong>and</strong>s<br />
------------------------------ % of hhs in each category ------------------------------<br />
Cent.<br />
Highl<strong>and</strong>s<br />
No production 3.2 3.8 0.6 17.0 0.0 2.8 0.0 0.0<br />
<strong>Production</strong>, no sales 21.2 30.4 18.6 31.3 12.7 26.6 9.9 17.0<br />
1 Lowest sales q’tile 15.1 17.7 9.9 17.0 13.9 18.3 11.9 13.9<br />
2 15.1 17.7 12.4 13.6 19.3 16.0 14.6 13.1<br />
3 15.2 13.9 16.1 11.4 19.3 13.0 21.2 14.7<br />
4 15.1 8.9 18.0 6.8 24.1 13.3 20.5 14.7<br />
5 Highest sales q’tile 15.1 7.6 24.2 2.8 10.8 10.0 21.9 26.6<br />
Table 3.8 examines the characteristics of households in each of these horticultural sales<br />
categories. Several patterns emerge. First, the mean level of education of the head of<br />
household steadily rises as the value of horticultural sales increases. The total increase in<br />
mean years of education of the household head over the categories is 2.2 years. Second, the<br />
largest horticultural sellers appear less likely than other households to be headed by females,<br />
<strong>and</strong> non producers of horticultural crops appear more likely to be female-headed. Third,<br />
cropped area also rises steadily through the quintiles of sellers, though producing non-sellers<br />
actually crop more total area than do the sellers in the bottom two sales quintiles. Nonproducers<br />
have the lowest mean area. Fourth, horticultural sellers in the top sales quintile are<br />
clearly better-off than other households: total value of assets, total per capita income, <strong>and</strong><br />
total per capita cash income all rise substantially in this last group. The fact that assets, <strong>and</strong><br />
not just income, are higher in this group suggests that those households with high<br />
horticultural sales during the survey period have enjoyed higher incomes for some time,<br />
which they have used to increase their asset holdings. Non-producers are clearly worse-off<br />
than other households, with the lowest amount of cropped area, lowest per capita incomes,<br />
<strong>and</strong> lowest assets.<br />
Fifth, households that produce but do not sell horticultural crops are virtually<br />
indistinguishable from all but the largest sellers; the incomes <strong>and</strong> assets of the former are<br />
comparable to sellers in the top four sales quintiles. This suggests that these households<br />
have chosen to earn most of their cash incomes not from horticulture but from other<br />
agricultural <strong>and</strong> non-agricultural activities. Finally, the share of off-farm income in total<br />
income falls steadily as horticultural sales increase, being replaced largely by horticultural<br />
sales. It should be noted, however, that the actual value of off-farm income is highest among<br />
households in the top horticultural sales category, despite the off-farm income share being the<br />
lowest in this group.
We close this section by examining the concentration of horticultural production <strong>and</strong> sales –<br />
both geographically <strong>and</strong> at the household level – by individual crop. Table 3.9 presents<br />
indicators of geographical <strong>and</strong> household level concentration for the top ten crops, based on<br />
total sales value in our sample. We see that a majority of these 10 crops (banana, cabbage,<br />
tomato, sukuma wiki, avocado, onion, <strong>and</strong> orange) are sold in at least six of the seven zones,<br />
<strong>and</strong> are produced in all seven. Of these, sukuma wiki appears to be the least concentrated<br />
geographically, with the top zone (High Potential Maize Zone) accounting for less than 30%<br />
of total sales <strong>and</strong> just over 30% of total production. Orange, on the other h<strong>and</strong>, while<br />
produced in all seven zones <strong>and</strong> sold in six of them, shows greater geographical<br />
concentration, with about 50% of production <strong>and</strong> nearly 60% of all sales coming from the<br />
High Potential Maize Zone. Carrots are the most concentrated in sales, with 94% of<br />
production <strong>and</strong> 96% of sales coming from the Central Highl<strong>and</strong>s. Nearly 80% of Macadamia<br />
Nut sales come from the Eastern Lowl<strong>and</strong>s, <strong>and</strong> this crop is produced in only two of our<br />
seven zones.<br />
Table 3.6 already showed that the concentration of sales at the household level is high, with<br />
nearly 80% of sales coming from only 15% of the rural households. Table 3.9 shows that<br />
production <strong>and</strong> sales of sukuma wiki <strong>and</strong> banana are substantially less concentrated than<br />
other crops, while carrot, french bean, macadamia nut <strong>and</strong> orange show the highest<br />
concentration. Among all these latter crops, 5% of rural households account for nearly all<br />
sales, <strong>and</strong> for 90-100% of production.<br />
3.4 Summary<br />
This review has shown that the production <strong>and</strong> sales of all the major horticultural crops in<br />
Kenya is quite concentrated. In all but one of the top 10 crops, 5% of the rural population<br />
accounts for at least 50% of production <strong>and</strong> at least 70% of sales. Because the larger<br />
producers <strong>and</strong> sellers tend to specialize in one or two crops 6 , concentration at the crop level is<br />
higher than it is across all crops; in the latter case, 15% of rural households account for about<br />
80% of all horticultural sales.<br />
Nevertheless, useful distinctions can be made between crops. Bananas <strong>and</strong> Sukuma wiki are<br />
the least concentrated both geographically <strong>and</strong> at the household level. Each is produced<br />
throughout the country <strong>and</strong> is actively marketed; in most areas at least one-third of all rural<br />
households sell these crops. Improvements in production <strong>and</strong> marketing of these two crops<br />
would have the broadest impacts on income levels <strong>and</strong> poverty rates. Returns to research <strong>and</strong><br />
general extension on banana diseases may therefore be very high. Maintenance <strong>and</strong><br />
expansion of use of disease free planting material, which was a major success of the mid-<br />
1990s period, is especially important. Key constraints to sukuma wiki production <strong>and</strong><br />
marketing need to be better understood.<br />
Carrots, French beans, macadamia nuts <strong>and</strong> oranges are the most concentrated in production<br />
<strong>and</strong> sales. Five percent of the rural population accounts for nearly all sales of these crops,<br />
<strong>and</strong> except for oranges, they are produced in four or fewer of our seven zones. These<br />
characteristics suggest that a strategy of focused assistance to relatively few growers on<br />
production <strong>and</strong> marketing constraints could be effective in boosting production <strong>and</strong> sales.<br />
Such a strategy would likely not be effective in oranges unless the serious disease problems<br />
6 The top quintile sells an average of six horticultural crops, but the most important of these accounts for 64%<br />
of the households’horticultural sales, on average.<br />
22
in that crop are first addressed (see Chapter 6 for more detail on citrus greening disease).<br />
Broader income gains through such focused activities would be achieved through re-spending<br />
of incomes by the relatively few direct beneficiaries.<br />
Cabbage, tomato, avocado <strong>and</strong> onion fall between these two other groups in terms of<br />
concentration of sales. Each is produced in at least six of our seven zones, <strong>and</strong> 5% of the<br />
rural population accounts for 81-88% of sales.<br />
The review also showed that the largest horticultural sellers are better off than other<br />
households based on a wide range or indicators: they have more education, crop more l<strong>and</strong>,<br />
are more likely to use fertilizer, have higher assets <strong>and</strong> incomes, <strong>and</strong> are less likely to be<br />
female-headed than other households. Interestingly, this group still earns a slightly higher<br />
income share off the farm than they do through horticultural sales, though their off-farm<br />
share is lower <strong>and</strong> horticultural sales share is higher than any other group. This pattern<br />
suggests that these households are still relatively diversified in their income strategies, as is<br />
typical of African smallholders. A potential implication is that, if marketing costs can be<br />
reduced, farm level productivity increased, <strong>and</strong> market outlets be made more reliable, this<br />
group of households may be able to specialize substantially more in horticulture <strong>and</strong> thus be<br />
well poised to take advantage of exp<strong>and</strong>ing market opportunities.<br />
23
Table 3.8. Concentration of horticultural sales: selected household level indicators by quintiles of total household horticultural sales value<br />
<strong>Horticultural</strong> Sales<br />
Category<br />
% of<br />
farmers<br />
Mean<br />
education of<br />
head of hh<br />
(years)<br />
% female<br />
headed<br />
households<br />
Cropped<br />
area (acres,<br />
Main<br />
season)<br />
% Using<br />
fertilizer<br />
on farm<br />
24<br />
Total<br />
value of<br />
assets<br />
Total per<br />
capita income<br />
(Ksh)<br />
Total per<br />
capita cash<br />
income (Ksh)<br />
Off-farm<br />
income share<br />
No production 3.2 5.4 26.7 3.4 52 74,700 10,562 8,332 54% 0%<br />
<strong>Production</strong>, no sales 21.2 5.4 18.0 4.9 39 145,411 16,309 11,392 41% 0%<br />
1 Lowest sales quintile 15.1 5.5 16.7 3.6 49 97,065 14,140 10,453 40% 1%<br />
2 15.1 6.4 11.4 3.8 55 169,232 15,616 10,700 35% 2%<br />
3 15.2 5.9 15.2 5.0 60 104,799 15,747 10,834 34% 4%<br />
<strong>Horticultural</strong><br />
sales share<br />
4 15.1 6.6 15.7 4.8 68 114,824 18,819 13,550 34% 12%<br />
5 Highest sales quintile 15.1 7.4 8.1 5.9 83 204,038 32,611 23,192 24% 22%
Table 3.9. Concentration of horticultural production <strong>and</strong> sales by crop: indicators of geographical <strong>and</strong> household level concentration of top 10<br />
horticultural crops by sales value<br />
Geographical Sales Indicators<br />
Zone Banana Cabbage Tomato Suk. Wiki Avocado Onion Carrots French<br />
Beans<br />
Sales share of top zone 33.9 67.8 41.9 29.3 47.4 48.1 96.2 46.8 78.9 57.9<br />
25<br />
Macadamia<br />
Nuts<br />
Orange<br />
Name of top sales zone W. High- W. High- High Pot. High Pot. E. Low- Central Central E. Low- E. Low- High Pot.<br />
l<strong>and</strong>sl<strong>and</strong>s Maize Maize l<strong>and</strong>s Highl<strong>and</strong>s Highl<strong>and</strong>s l<strong>and</strong>sl<strong>and</strong>s Maize<br />
Number of zones selling 7 6 7 7 6 6 4 4 2 6<br />
Geographical Prod’n Indicators<br />
<strong>Production</strong> share of top zone 28.3 62.1 38.6 31.5 44.2 41.0 94.0 46.0 74.0 50.2<br />
Name of top production zone same same same same same same same same same same<br />
Number of zones producing 7 7 7 7 7 7 6 4 2 7<br />
HH Level Sales Indicators<br />
National Gini Coefficient, sales 0.909 0.951 0.949 0.869 0.948 0.961 0.978 0.982 0.997 0.983<br />
National sales share, top 5% 69.7 83.6 81.4 56.5 81.0 87.7 98.1 100.0 100.0 99.1<br />
HH Level Prod’n Indicators<br />
National Gini Coefficient, prod’n 0.795 0.936 0.923 0.769 0.907 0.921 0.972 0.980 0.996 0.967<br />
National prod’n share, top 5% 50.1 79.0 73.4 45.2 71.0 74.4 94.9 100.0 100.0 90.9<br />
Marketed Surplus, % 43.9 81.2 72.4 58.8 50.0 72.1 84.7 92.3 92.4 65.3
4. Costs of <strong>Production</strong> for Onion in Tanzania <strong>and</strong> Kenya<br />
<strong>Marketing</strong> analysis in Volume II of this paper shows that oranges <strong>and</strong>, especially, onions<br />
from Tanzania are quite competitive in the Kenyan market. In this chapter we examine the<br />
farm-level determinants of this competitiveness for onions, presenting partial budgets for this<br />
crop in Tanzania <strong>and</strong> Kenya.<br />
Synthetic crop budgets were developed for four production areas – three in Kenya <strong>and</strong> one in<br />
Tanzania – through group interviews of farmers. Tanzanian onions reaching Kongowea<br />
market in Mombasa <strong>and</strong> Wakulima market in Nairobi are produced at Mang’ola,<br />
approximately 200 km from Arusha town (450 km from Nairobi). Locally, Kongowea market<br />
gets onions from Taveta, Oloitoktok (Kimana) <strong>and</strong> also Karatina whereas Wakulima market<br />
gets onions primarily from Oloitoktok, Laikipia, Narok, Meru, <strong>and</strong> Karatina. <strong>Production</strong> of<br />
onions in these areas is by irrigation. To facilitate comparison, it was important to categorize<br />
areas with similar production systems, climate <strong>and</strong> a common market for the commodities.<br />
Hence separate onion enterprise budgets were developed for Mang’ola in Tanzania, <strong>and</strong> for<br />
Taveta <strong>and</strong> Oloitoktok in Kenya. The budgets for Narok, Laikipia <strong>and</strong> Meru were averaged to<br />
get one representative synthetic budget for production areas far removed from Mang’ola <strong>and</strong><br />
Taveta/Oloitoktok region. In each case, 5-7 farmers were interviewed as a group to develop<br />
an average farm budget for the commodity in that area. Results are shown in Tables 6.19 to<br />
6.21 below. Table 6.19 presents detailed costs by item, Table 6.20 expresses these in<br />
percentage terms, <strong>and</strong> Table 6.21 summarizes the information to show cost of production <strong>and</strong><br />
gross margin for farmers per bag.<br />
4.1 Cost of <strong>Production</strong><br />
Results in the three tables indicate that the onion production system in Tanzania has a higher<br />
cost per acre than in Kenya, but lower costs <strong>and</strong> higher returns to farmers per bag. These<br />
lower unit costs of production in Tanzania are driven by seed costs one-tenth of those in<br />
Kenya, <strong>and</strong> average yields that are more than 50% higher.<br />
Across the board, the main cost components are weeding, irrigation <strong>and</strong> seeds (Tables 4.19<br />
<strong>and</strong> 4.20). Weeding cost in Tanzania accounted for 17% of TVC whereas in Kenya it ranged<br />
between 12% <strong>and</strong> 14%. Onion farmers in Tanzania weed each basin four times while in<br />
Kenya it is done three times (See Appendix C).<br />
The cost component for irrigation was 31% in Tanzania compared to 14% in Narok <strong>and</strong> 16%<br />
in Taveta. Irrigation quality may be higher in Tanzania, however. Unlike in Kenya, a<br />
specialized group of people in Tanzania have sharpened the skill to irrigate farms. These<br />
people can quite a number of farms simultaneously, working on the basis of well organized<br />
irrigation schedules of the farms they manage. Farmers hire the services of these irrigation<br />
specialists when they plant onion, <strong>and</strong> typically pay them an equivalent of 10 bags per acre.<br />
Kenyan farmers also typically purchase irrigation services (except in Oloitoktok, where<br />
farmers do it themselves <strong>and</strong> hence the cost is accounted for as part of return to farmers’<br />
resources), but the providers have not developed as organized a system as in Tanzania.<br />
Hence the payments are relatively lower. A key question is whether the higher cost in<br />
Tanzania reflects better quality service resulting in higher yields. Yields in Tanzania average<br />
120 bags per acre, compared to 60-85 bags/acre in Kenya, but it is not clear what role the<br />
quality of the irrigation service plays in this difference.<br />
26
Table 4.1 Distribution of Onion <strong>Production</strong> Costs (Kshs/Acre) in Tanzania <strong>and</strong> Kenya<br />
Cost Items<br />
Tanzania<br />
Mang'ola<br />
27<br />
Kenya<br />
Oloitoktok<br />
Kenya:<br />
Narok/Laikipia/Meru<br />
Kenya<br />
Taveta<br />
Number of basins per acre 250 300 300 300<br />
L<strong>and</strong><br />
Nursery operations<br />
Own Own Own Own<br />
------------------------------ Ksh/acre ------------------------------<br />
Ploughing <strong>and</strong> preparation 750 900 1567 800<br />
Seed 640 6250 6400 4400<br />
Irrigation-Nursery/Field 14830 0 6933 6340<br />
Polytrin 3200 3200 2647 1800<br />
Foliar feed 380 750<br />
Spraying labour<br />
Main field<br />
420 400 420 450<br />
Ploughing 1000. 2000 1467 2000<br />
Making of basins & furrows 2083 1800 2643 1800<br />
Lines for seed placement 1042 600<br />
Planting/Fertilizer labor 3125 1800 3200 4800<br />
Chemicals 4125 6650 5170 2100<br />
Fertilizers-Nursery/Field<br />
4000 4800 2500 3000<br />
4000 3300 1305 -<br />
Weeding/Fertilizer labor 8333 5400 6000 5400<br />
Harvesting: Uprooting<br />
2083 3000 3125 3500<br />
Cutting 2083 3000 3125 3500<br />
Total variable cost (TVC) 51714 43100 46882 40640<br />
Source: Authors Computation<br />
Usually, the recommended rate of fertilizer application on onions is 200 kg (4 bags) of DAP<br />
or 17:17:17 (NPK) for planting <strong>and</strong> 150 kg (3 bags) of ASN per acre. In Tanzania, farmers<br />
use 4 bags of CAN for planting <strong>and</strong> 4 bags of ASN for top dressing. In Kenya, onion<br />
production regions used less than the recommended rates except Oloitoktok (see Appendix<br />
C).<br />
Seed cost in Kenya is higher by a factor of nearly 10 compared to Tanzania. This huge price<br />
difference can be attributed to the way farmers obtain seed in the two countries. In Kenya,<br />
farmers purchase imported seed, either Red Creole or Bombay Red from the various<br />
companies. The cost ranges between Kshs. 2,200 to 3,000/kg. In Tanzania, local farmers<br />
produce quality declared seed that is of higher quality <strong>and</strong> is relatively cheap. See Chapter 7,<br />
section 7.1 for more detail on the quality declared seed program in Tanzania.<br />
Table 4.21 shows yield <strong>and</strong> information related to unit cost of production <strong>and</strong> gross margins<br />
for farmers. In Tanzania, the yield of onion is approximately 120 bags/acre, compared to an<br />
average of 73 bag/acre in Kenya. The cost of production is about Kshs 405/bag in Tanzania<br />
<strong>and</strong> an average of Kshs 623/bag in Kenya. Thus, the yield is higher <strong>and</strong> the cost of<br />
production is lower in Tanzania than in Kenya. Both gross margin/acre <strong>and</strong> gross margin per<br />
bag are much higher in Tanzania than in Kenya also. Together with the marketing cost<br />
buildup results, these farm measures help explain why Tanzanian onion has a competitive<br />
advantage over Kenyan onions.
Table 4.2 Percentage Distribution of Onion <strong>Production</strong> Costs in Tanzania <strong>and</strong> Kenya<br />
Tanzania Kenya<br />
Kenya<br />
Kenya<br />
Mang’ola Oloitoktok Narok/Likipia/Meru Taveta<br />
% cost of % cost of % Cost of TVC % Cost of<br />
TVC TVC<br />
TVC<br />
Nursery operations<br />
Ploughing <strong>and</strong> preparation 1.45 2.09 3.34 1.97<br />
Seed 1.24 14.50 13.65 10.83<br />
Irrigation 28.68 0.00 14.79 15.60<br />
Polytrin 6.19 7.42 5.65 4.43<br />
Folier feed 0.00 0.81 1.85<br />
Spraying labour<br />
Main field<br />
0.81 0.93 0.90 1.11<br />
Ploughing 1.93 4.64 3.13 4.92<br />
Making of basins & furrows 4.03 4.18 5.64 4.43<br />
Lines for seed placement 2.01 1.39<br />
Planting 6.04 4.18 6.83 11.81<br />
Chemicals 7.98 15.43 11.03 5.17<br />
Fertilizers<br />
7.73 11.14 5.33 7.38<br />
7.73 7.66 2.78 7.38<br />
Weeding 16.11 12.53 12.80 13.29<br />
Harvesting: Uprooting 4.03 6.96 6.67 8.61<br />
Cutting 4.03 6.96 6.67 8.61<br />
Total variable cost (TVC)<br />
Source: Authors Computation<br />
100.00 100.00 100.00 100.00<br />
Table 4.3 Efficiency Measures of Onion <strong>Production</strong> in Tanzania <strong>and</strong> Kenya<br />
Items Tanzania<br />
Mang’ola<br />
28<br />
Kenya<br />
Oloitoktok<br />
Kenya<br />
Narok/Laikipia/Meru<br />
Kenya<br />
Taveta<br />
Yield (bags) 120 85 60.0 75<br />
Price(Kshs/bag) 1,483 1,447 1,241 1,400<br />
Gross output (Kshs/acre) 177,960 122,995 74,460 105,000<br />
Gross Margin (Kshs/acre) 129,398 79,895 24,745 65,080<br />
Cost per bag 405 507 829 532<br />
Gross Margin/bag 1,078 940 412 868<br />
Source: Authors Computation<br />
4.2. Onion Storage<br />
Storage is another aspect that adds a competitive advantage to Tanzanian onions. Farm<br />
storage is primarily concerned with making onion available at the desired time in the market.<br />
It becomes more useful by being held from periods of relative plenty to periods of relative<br />
scarcity. Most farmers in Tanzania have good post harvest management practices. They have<br />
built well aerated stores that can keep onions in good condition for a period of six months.<br />
This ensures continuous supply of onions to the markets all the year round <strong>and</strong> reduces the
isk of price instabilities to the farmers. Most onion-producing households have a storage<br />
structure. Some of the structures can hold up to 120 bags of onion each weighing 100-120<br />
kgs. The development of the storage system for onions has been a result of local initiatives<br />
<strong>and</strong> donor support particularly from the Spanish Government.<br />
Mang’ola area in Tanzania ha s only one rainy season, from November to March, <strong>and</strong> receives<br />
less than 500mm. During the rainy season, farmers plant food crops. Very few of them<br />
(15%) plant onions (Kamau, 2001). The main onion planting season is the dry period from<br />
late February to the end of September. Most of the onion planted in July to September is<br />
stored after harvest <strong>and</strong> sold up to end of May when the onion planted in February is<br />
harvested. Thus Tanzania has developed a competitive capability to supply onion to the<br />
regional markets throughout the year. Kenya on the other h<strong>and</strong> is not yet able to store onions,<br />
so what is produced tends to be sent to the market straightaway.<br />
29
5. Conclusions <strong>and</strong> Recommendations<br />
This report has shown that, despite very high growth rates in export horticulture in Kenya, the<br />
domestic market continues to absorb at least 4-5 times more produce, by value, than does the<br />
export market. If produce consumed on the farm is included, the domestic share rises to 7-8<br />
times that of the export market. We have also shown that value added after the farm gate is at<br />
least three times greater in the domestic than in the export supply chain. At the same time,<br />
the domestic horticultural system is relatively uncompetitive in regional markets: while the<br />
country imports a substantial share of some horticultural crops, its exports of fresh produce to<br />
the region are negligible. We have thus referred to the dualistic nature of the current system,<br />
with an export sector of commercial farmers <strong>and</strong> some organized smallholder farmers closely<br />
linked to export companies, competing successfully in the highly competitive <strong>and</strong> quality<br />
conscious European market, while the domestic sector is dominated by smallholder farmers<br />
receiving little if any assistance <strong>and</strong> struggling in some instances to compete with imports.<br />
The domestic horticultural system is also subject to strong forces of change at the present<br />
time. Continued high rates of urbanization are expected to drive increases in dem<strong>and</strong>; if per<br />
capita incomes begin once again to rise, total dem<strong>and</strong> growth in the domestic market could<br />
exceed 5% per year. Satisfying such increases in dem<strong>and</strong> year after year would be a major<br />
challenge for any commodity supply chain.<br />
Exp<strong>and</strong>ing domestic <strong>and</strong> regional markets for Kenyan horticultural produce, integrating the<br />
bulk of the country’s smallholder farmers into profitable supply chains that satisfy these<br />
markets, <strong>and</strong> ensuring consumers of a growing supply of horticultural produce with falling<br />
real prices <strong>and</strong> improving quality will require investment in three key areas: technical<br />
production constraints, “hard” <strong>and</strong> “soft” public market infrastructure, <strong>and</strong> the legal <strong>and</strong><br />
regulatory environment. In this Volume we focus on technical production constraints;<br />
Volume II deals with hard <strong>and</strong> soft public market infrastructure, while Volume III deals with<br />
legal <strong>and</strong> regulatory issues.<br />
Control of banana diseases through introduction of disease-free planting material has been<br />
one major success of the past 10 years in Kenya’s horticultural sector. Given the importanc e<br />
of bananas in rural production <strong>and</strong> marketing systems, continued progress replacing diseased<br />
orchards with clean material would seem to be a low-cost means of protecting <strong>and</strong> exp<strong>and</strong>ing<br />
smallholder income earning opportunities with this crop.<br />
Lessons from the experience with banana are partially relevant for citrus greening disease, a<br />
key production constraint for oranges in Kenya. The disease also reduces the quality of<br />
oranges <strong>and</strong> thus further undermines the domestic system’s competitiveness. Because the<br />
vector does not thrive at low altitudes, a phased replacement of infected orchards in those<br />
areas of the country should be a high priority. Recent biotechnology breakthroughs should<br />
make this possible (see section 7.3.1 for more detail). In mid- altitudes, eradication of the<br />
disease would require coordinated felling <strong>and</strong> disposal of all infected orchards along with<br />
planting of new disease free seedlings. This process will be much more costly <strong>and</strong><br />
logistically complex than a phased replacement in coastal regions. Before such a program is<br />
undertaken, therefore, careful consideration must be given to its feasibility given current<br />
administrative resources, costs if successfully executed, <strong>and</strong> expected benefits.<br />
More generally, the horticultural sector suffers from diseased <strong>and</strong> limited choice of planting<br />
material for fruits, <strong>and</strong> a near absence of locally developed vegetable seeds. Planting<br />
30
materials from many local nurseries are diseased, low yielding <strong>and</strong> not true to type, <strong>and</strong><br />
vegetable seeds are almost entirely imported. This situation is a result of two factors. First,<br />
underinvestment in varietal development means that Kenya’s agricultural research system has<br />
few vegetable breeders <strong>and</strong> no vegetable seed production technologists. Though seed<br />
production equipment was purchased, it has never been installed due to lack of personnel (see<br />
Volume III for more detail). Second, the country’s regulatory environment stresses control<br />
over facilitation. Local seed/varietal development in Tanzania has been an important part of<br />
that country’s success in capturing significant shares of Kenya’s onion <strong>and</strong> orange markets.<br />
HCDA <strong>and</strong> THRC should carry out registration of newly established nurseries, set<br />
guidelines/st<strong>and</strong>ards for operations <strong>and</strong> offer general advisory services to regulate <strong>and</strong><br />
enhance quality. KEPHIS should undertake inspection <strong>and</strong> certification of planting materials<br />
from these nurseries. A combination of government, donor, <strong>and</strong> private sector funds needs to<br />
be mobilized to provide more resources for adaptive varietal research in the context of a<br />
revised seed law that encourages the production of Quality Declared Seed at the village level.<br />
31
REFERENCES<br />
Bawden, R., P. A. Sterns, S. Harris <strong>and</strong> J Berdegue (2002). Increasing Rural Household<br />
Incomes in Kenya Through Horticulture. A Design Proposal. A Report Prepared for<br />
USAID Kenya.<br />
Dolan, C., J. Humphrey, <strong>and</strong> Harris-Pascal, (1999). ”<strong>Horticultural</strong> Commodity Chains: The<br />
Impact of the UK Market on the African Fresh Vegetable Industry.” IDS Working<br />
Paper No. 96. Institute for development Studies. Sussex, UK.<br />
Dolan, C., <strong>and</strong> J.Humphrey (2001). “Governance <strong>and</strong> Trade in Fresh vegetables. The Impact<br />
of UK Supermarkets on the African <strong>Horticultural</strong> Industry.” In Globalization <strong>and</strong><br />
Trade: Implications for Exorts from Marginalized Economies, edited by O. Morrissey<br />
<strong>and</strong> I. Filatotchev. London:Frank Cass, 2001.<br />
Dolan, C., <strong>and</strong> K. Sutherl<strong>and</strong>, (2002). Gender <strong>and</strong> Employment in the Kenya <strong>Horticultural</strong><br />
Value Chain. Discussion Paper 8. School of Development Studies <strong>and</strong> Overseas<br />
Development Group, University of East Anglia, Norwich NR47TJ, United Kingdom.<br />
Fresh Produce <strong>Marketing</strong> Section 7 Committee; 1999<br />
Harris, C. , P.V. Hegarty, M. Kherallah, C. Mukindia, J.Ngige, P. Sterns, <strong>and</strong> J. Tatter,<br />
(2001). “The Impacts of St<strong>and</strong>ards on the Food Sector of Kenya.” Report Prepared by<br />
the Institute for Food <strong>and</strong> Agricultural St<strong>and</strong>ards , Michigan State University, for the<br />
U.S. Agency for International Development . East Lansing, Michigan.<br />
Jaffee, S. (1994). “Contract Farming in the Shadow of Competitive Ma rkets: The Experience<br />
of Kenyan Horticulture.” In Little , P. <strong>and</strong> M. Watts. Living Under Contract:<br />
Contract Farming <strong>and</strong> Agrarian Transformation in Sub-Saharan Africa. University of<br />
Wisconsin Press. Madison, Wisconsin.<br />
Jaffee, S. (1995). “The Many Faces of Success: The Development of Kenyan <strong>Horticultural</strong><br />
Exports.” In Jaffee, S <strong>and</strong> J. Morton (eds) <strong>Marketing</strong> Africa’s High Value Foods. The<br />
World Bank . Washington, D.C.<br />
Kahangi, E (1996). Biotechnology to benefit Small Scale Banana Producers in Kenya. Jomo<br />
Kenyatta University of Agriculture <strong>and</strong> Technology <strong>and</strong> Technology.<br />
Kamau, M. (2000). The Way Forward in Export Oriented Smallholder Horticulture.<br />
Background Paper for Stakeholder Consultation Meeting , Norfolk Hotel, Nairobi.<br />
Kamau, M. <strong>and</strong> T. Sisusle (2001). A Study of the <strong>Domestic</strong> Horticulture Sub-Sector in<br />
Kenya.<br />
Kenya, GoK, (2002). National Development Plan, 2002-2008. Government Pinter. Nairobi.<br />
Kenya, GoK, (1994). National Development Plan, 1994-1996. Government Pinter. Nairobi.<br />
Kimenye, L. , (1995). “ Kenya’s Experience Promoting Smallholder <strong>Production</strong> of Flowers<br />
<strong>and</strong> Vegetables for European Markets.” African Rural <strong>and</strong> Urban Studies 2 (2 -3):<br />
121-141.<br />
Minot, N. <strong>and</strong> M. Ngigi, (2002). “Horticulture Development in Kenya <strong>and</strong> Ivory Coast”. A<br />
Paper Prepared for the IFRI Workshop on “Successes in African Agriculture”,<br />
Lusaka, June 10 th –12 th , 2002.<br />
Obukosia, S.D <strong>and</strong> K. Waithaka, (2000). Nucellar Embryo culture of Citrus Sinensis L <strong>and</strong><br />
Citrus Limon L. African Crop Science Journal: The journal of tropical crop science<br />
<strong>and</strong> production: Vol 8; No.2 pp 109-116.<br />
Stevens, C. <strong>and</strong> J. Kennan, (1999). “Will Africa ’s Participation in Horticulture Chains<br />
Survive Liberalization ?”, IDS Working Paper No, 106. Institute of Development<br />
Studies. Sussex, UK.<br />
32
Swernberg, K. , (1995). “<strong>Horticultural</strong> Exports from Kenya.” <strong>Horticultural</strong> Trade Journal 3:<br />
3-5.<br />
Thiru, A. (2000). International Trade in Fruits <strong>and</strong> Vegetables:Opportunities <strong>and</strong> Constraints<br />
for Kenya”, Presented at the Technical Woprkshop on Fruit <strong>and</strong> Vegetable St<strong>and</strong>ards<br />
<strong>and</strong> Grades . Naro Moro River Lodge. 15 th –17 th August 2000.<br />
33
Appendices<br />
34
Appendix A. Trends in Fruit <strong>Production</strong> in Kenya.<br />
FIGURE A.1: AREA TREND UNDER BANANAS IN KENYA (1992-2001)<br />
FIGURE A2: AREA TREND UNDER CITRUS, MANGOES AND PINEAPPLES IN KENYA (1992-<br />
2001)<br />
Area (ha)<br />
Area (ha)<br />
90,000<br />
80,000<br />
70,000<br />
60,000<br />
50,000<br />
40,000<br />
30,000<br />
20,000<br />
10,000<br />
-<br />
18,000<br />
16,000<br />
14,000<br />
12,000<br />
10,000<br />
8,000<br />
6,000<br />
4,000<br />
2,000<br />
-<br />
1992 1993 1994 1995 1996 1997 1998 1999 2000 2001<br />
Years<br />
1992 1993 1994 1995 1996 1997 1998 1999 2000 2001<br />
Year<br />
35<br />
CITRUS<br />
MANGOES<br />
PINEAPPLES
FIGURE A.3: AREA TREND UNDER AVOCADOS, PAWPAW AND PASSION FRUITS IN KENYA<br />
(1992-2001)<br />
Area (ha)<br />
8,000<br />
7,000<br />
6,000<br />
5,000<br />
4,000<br />
3,000<br />
2,000<br />
1,000<br />
-<br />
1992 1993 1994 1995 1996 1997 1998 1999 2000 2001<br />
Year<br />
36<br />
Avocados<br />
Pawpaw<br />
Passion fruit
Appendix B. Trends in Vegetable <strong>Production</strong> in Kenya.<br />
FIGURE B.1: AREA TRENDS UNDER CABBAGES, TOMATOES AND KALES IN KENYA (1992-<br />
2001)<br />
FIGURE B.2: AREA TRENDS UNDER ONIONS, , FRENCH BEANS, CARROTS IN KENYA (1992<br />
2001)<br />
Area (ha)<br />
8,000<br />
7,000<br />
6,000<br />
5,000<br />
4,000<br />
3,000<br />
2,000<br />
1,000<br />
-<br />
Area (Hectares)<br />
30,000<br />
25,000<br />
20,000<br />
15,000<br />
10,000<br />
5,000<br />
-<br />
1992 1993 1994 1995 1996 1997 1998 1999 2000 2001<br />
37<br />
Year<br />
1992 1993 1994 1995 1996 1997 1998 1999 2000 2001<br />
Years<br />
Onions.<br />
French beans<br />
Carrots.<br />
Cabbages.<br />
Tomatoes<br />
Kales.
FIGURE B.3: AREA TRENDS UNDER INDEGENOUS VEGETABLES, GARDEN PEAS AND<br />
OTHER VEGETABLES IN KENYA (1992-2001)<br />
Area (ha)<br />
10,000<br />
9,000<br />
8,000<br />
7,000<br />
6,000<br />
5,000<br />
4,000<br />
3,000<br />
2,000<br />
1,000<br />
-<br />
1992 1993 1994 1995 1996 1997 1998 1999 2000 2001<br />
Year<br />
38<br />
Ind. Vegetables<br />
Garden peas<br />
Other vegetables
Appendix C: Enterprise Budgets for Onions in Kenya <strong>and</strong><br />
Tanzania<br />
Table C.1 : Onion Budgets (Per One Acre) for Mang’ola in Tanzania<br />
<strong>Production</strong> Items Specifications Actual costs<br />
(in Tz shs)<br />
39<br />
Cost in Kshs % cost of<br />
TVC<br />
Number of basins per acre 250<br />
L<strong>and</strong><br />
Nursery operations<br />
Own l<strong>and</strong><br />
Ploughing <strong>and</strong> preparation 30 basins@300 9000 750.00 1.54<br />
Seed 20 cups @ 384 7680 640.00 1.32<br />
Irrigation (Nursery & Field) 177960 14830.00 30.54<br />
polytrin 4 times @10000/0.5ltr 1600 133.33 0.27<br />
spraying labour<br />
Main field<br />
1000 per spray; 4 times 4000 333.33 0.69<br />
Ploughing Once @12000 12000 1000.00 2.06<br />
Making of basins & furrows 250 @ 100 per basin 25000 2083.33 4.29<br />
Lines for seed placement 50 per basin * 250 12500 1041.67 2.15<br />
Planting 150 per basin *250 37500 3125.00 6.44<br />
Chemicals Selcron 3 L @ 16500/L 49500 4125.00 8.49<br />
Fertilizer<br />
CAN 4 bags @12000 48000 4000.00 8.24<br />
SA 4 bags @12000 48000 4000.00 8.24<br />
Weeding 4 times @100/basin 100000 8333.33 17.16<br />
Harvesting<br />
Uprooting @ 100/basin 25000 2083.33 4.29<br />
Cutting @ 100/basin 25000 2083.33 4.29<br />
Total variable cost (TVC) 582740 48561.67 100.00<br />
Yield (bags) 120 120<br />
Price/bag 17796 1483<br />
Gross output 2135520 177960<br />
Gross Margin/acre 1552780 129398.33<br />
Cost per bag 4856.17 404.68<br />
Gross Margin/bag 12939.83 1078.32<br />
Source: Authors’ Computation.
Table C.2 : Onion Budgets (Per One Acre) for Oloitoktok in Kenya<br />
<strong>Production</strong> Items Specifications Actual costs (in % Cost of TVC<br />
Kshs)<br />
Number of basins per acre 300<br />
L<strong>and</strong><br />
Nursery operations<br />
Own l<strong>and</strong> 0<br />
Ploughing <strong>and</strong> preparation 30 basins@30 900 2.09<br />
Seed 2.5kg @2500 6250 14.50<br />
Polytrin 2 litres@1600 3200 7.42<br />
spraying labour<br />
Main field<br />
100 per spray; 4 times 400 0.93<br />
Ploughing Once @2000 2000 4.64<br />
Making of basins & furrows 300 @ 6 per basin 1800 4.18<br />
Lines for seed placement 2 per basin * 300 600 1.39<br />
Planting 6 per basin *300 1800 4.18<br />
Chemicals<br />
Polytrin 1400 3.25<br />
Fungicide 2100 4.87<br />
Foliar feed 750 1.74<br />
Spraying labour 600 ; 4 times 2400 5.57<br />
Fertilizer<br />
CAN 4 bags @1200 4800 11.14<br />
SA 3 bags @1100 3300 7.66<br />
Weeding 3 times @6/basin 5400 12.53<br />
Harvesting<br />
Uprooting @ 10/basin 3000 6.96<br />
Cutting @ 10/basin 3000 6.96<br />
Total variable cost 43100 100.00<br />
Yield (bags) 85<br />
Price/bag 1447<br />
Gross output 122995<br />
Gross Margin/acre 79895<br />
Cost per bag 507.06<br />
Gross Margin/bag<br />
Source: Authors’ Computation<br />
939.94<br />
40
Table C.3 : Onion Budgets (Per One Acre) for Taveta in Kenya<br />
<strong>Production</strong> Items Specifications Actual<br />
costs (in<br />
41<br />
Kshs)<br />
% Cost of<br />
TVC<br />
Number of basins per acre 300<br />
L<strong>and</strong><br />
Nursery operations<br />
own l<strong>and</strong> 0<br />
Ploughing <strong>and</strong> preparation 1 M<strong>and</strong>ay 80 0.20<br />
Seed 2kg @2200 4400 11.02<br />
Irrigation (Nursery & Field) 6340 15.88<br />
polytrin 1 litre 1800 4.51<br />
Folier Feed 750 1.88<br />
spraying labour<br />
Main field<br />
450 1.13<br />
Ploughing once @2000 2000 5.01<br />
Making of basins & furrows 300 basins @ 6 per basin 1800 4.51<br />
Planting 300 basins @ 6 per basin 1800 4.51<br />
Chemicals fungicide 2100 5.26<br />
Fertilizer (Nursery & Field) CAN 3 bags @1000 3000 7.52<br />
Application 300 basins @10/= 3000 7.52<br />
Weeding 3 times @6/basin 5400 13.53<br />
Harvesting<br />
uprooting 500 nets@ 7/= 3500 8.77<br />
cutting 500 nets @ 7/-- 3500 8.77<br />
Total Variable Costs 39920 100.00<br />
Yield (bags) 75<br />
Price (Kshs/bag) 1400<br />
Gross Output (Kshs/acre) 105000<br />
Gross Margin/acre 65080<br />
Cost/Bag 532.27<br />
Gross Margin/bag 867.73<br />
Source: Authors’ Computation
Table C.4 : Onion Synthetic Budget (Per One Acre) For Narok, Laikipia And Meru In Kenya<br />
<strong>Production</strong> Items Specifications Cost<br />
(Kshs/acre)<br />
% cost<br />
No. of basins 300<br />
Seed<br />
Nursery<br />
6400 12.87<br />
Ploughing <strong>and</strong> Preparation 100 0.20<br />
Irrigation 2767 5.57<br />
Polytrin 2647 5.32<br />
Foliar feed 380 0.76<br />
Spraying labour<br />
Main field<br />
420 0.84<br />
Ploughing 1467 2.95<br />
Preparation of basins & Furrows 2643 5.32<br />
Transplanting 5pple@100*4days 3200 6.44<br />
Fertilizer DAP 100kg (2 bags) 2500 5.03<br />
CAN 1 bag 1305 2.62<br />
Polytrin 2 litre 3000 6.03<br />
Dithane 5 kg 2000 4.02<br />
Foliar feed 2 litre 170 0.34<br />
Irrigation labour 4167 8.38<br />
Spraying labour 4300 8.65<br />
weeding labour 5 pple@100*8 6000 12.07<br />
Harvesting labour<br />
Uprooting 3125 6.29<br />
Cutting 3125 6.29<br />
Total variable cost 49715 100.00<br />
Yield (bags) 60.0<br />
Price/bag 1241<br />
Gross output 74460<br />
Gross Margin/acre 24745<br />
Cost per bag 828.58<br />
Gross Margin/bag<br />
Source: Authors’ Computation<br />
412.42<br />
42