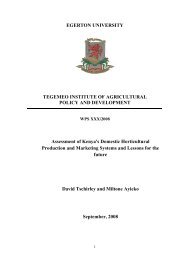
Improving Kenya's Domestic Horticultural Production and Marketing
Improving Kenya's Domestic Horticultural Production and Marketing
Improving Kenya's Domestic Horticultural Production and Marketing

Create successful ePaper yourself
Turn your PDF publications into a flip-book with our unique Google optimized e-Paper software.
smallholder or commercial farms. HCDA values are based on FOB export prices; we<br />
revalued these fresh vegetable exports using MoALRD farm-gate prices to make the<br />
production <strong>and</strong> export figures comparable.<br />
This exercise shows that fresh vegetable exports rose from 4-5% of total vegetable<br />
production in the early 1990s to over 12% in 2000, before falling to about 7% in 2001 (Figure<br />
2.13). The trend is clearly positive; the lower figure in 2001 is slightly higher than those for<br />
1996 <strong>and</strong> 1997 <strong>and</strong> well above those of the early 1990s. Over the past 5 years (1997-2001),<br />
fresh vegetable exports averaged 9.3% of production, by value. Adding processed vegetable<br />
exports, which FAOStat data show to be about 1/3 as much, by value, as fresh exports, raises<br />
the total export share (processed plus fresh) of vegetables in Kenya between 1997 <strong>and</strong> 2001<br />
to about 12%. In the absence of more detailed data, this final calculation assumes that the<br />
mix of processed vegetable exports is comparable to fresh, <strong>and</strong> that export prices for fresh<br />
<strong>and</strong> processed are also comparable.<br />
As a final step to calculate market channel shares, we use data from the 2000 Tegemeo/MSU<br />
Tampa smallholder income survey which show that 64% of total vegetable production that<br />
year was sold, <strong>and</strong> 36% retained on farm. This calculation provides a lower bound for<br />
marketed share if we assume, as is reasonable, that commercial producers sell nearly all their<br />
production. 4 By combining all these data, we arrive at Figure 2.14, showing that the value of<br />
vegetable production sold <strong>and</strong> then consumed domestically over the past five years has been<br />
at least four-to-five times as large as the value exported in fresh <strong>and</strong> processed form (52%<br />
compared to 12%). If produce consumed on the farm is included, the domestic share rises to<br />
seven-to-eight times that of the export market.<br />
Value added per unit of farm-gate production is higher in the export sector due primarily to<br />
higher quality <strong>and</strong> health st<strong>and</strong>ards. Comparing MoALRD farm-gate prices with HCDA<br />
export prices for French beans <strong>and</strong> Asian vegetables shows that export prices of these<br />
vegetables have exceeded farm-gate prices by a factor ranging from 2.7 to 6.2 since 1992,<br />
with an average of 2.9, or 290%. In contrast, mark-ups in domestic markets are typically<br />
about 100% from farm-gate to collecting wholesaler sales, <strong>and</strong> an additional 20-25% to<br />
retail. 5 These figures imply a 150% total markup from farm-gate to retail in local markets.<br />
Applying these markup figures to the share of production flowing through the domestic <strong>and</strong><br />
export channels, <strong>and</strong> continuing to value unsold production at farm-gate prices, shows that<br />
total value added in domestic vegetable markets is nearly three times that in vegetable export<br />
markets (Figure 2.15).<br />
These calculations show two things. First, vegetable exports are an important component of<br />
the vegetable supply chain, absorbing about 20% of all sold production by value, <strong>and</strong><br />
accounting for about one-quarter of all value added after the farm gate. Second, domestic<br />
markets nonetheless remain the primary outlet for vegetable production <strong>and</strong> generate much<br />
more value added than do export markets. This conclusion will hold even more for fruit,<br />
which has a higher total value of production <strong>and</strong> lower value of exports.<br />
4 Unfortunately, MoALRD does not report production separately for smallholder <strong>and</strong> commercial farmers. This<br />
makes it impossible to calculate a more accurate marketed surplus figure.<br />
5 See Tables 6.2, 6.4, 6.6., 6.8, <strong>and</strong> 6.10 for farm-gate to collecting wholesale markups. Mark-ups from<br />
collecting wholesale to retail are based on data collected in Wakulima market in November 2003. See<br />
Appendix XX for the original price data.<br />
14