Improving Kenya's Domestic Horticultural Production and Marketing
Improving Kenya's Domestic Horticultural Production and Marketing
Improving Kenya's Domestic Horticultural Production and Marketing

Create successful ePaper yourself
Turn your PDF publications into a flip-book with our unique Google optimized e-Paper software.
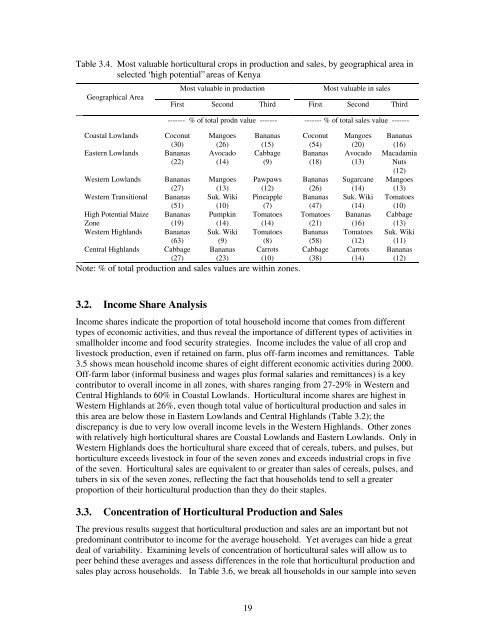
Table 3.4. Most valuable horticultural crops in production <strong>and</strong> sales, by geographical area in<br />
selected “high potential” areas of Kenya<br />
Geographical Area<br />
Coastal Lowl<strong>and</strong>s Coconut<br />
(30)<br />
Eastern Lowl<strong>and</strong>s Bananas<br />
(22)<br />
Most valuable in production Most valuable in sales<br />
First Second Third First Second Third<br />
------- % of total prodn value ------- ------- % of total sales value -------<br />
Mangoes<br />
(26)<br />
Avocado<br />
(14)<br />
19<br />
Bananas<br />
(15)<br />
Cabbage<br />
(9)<br />
Coconut<br />
(54)<br />
Bananas<br />
(18)<br />
Western Lowl<strong>and</strong>s Bananas Mangoes Pawpaws Bananas<br />
(27) (13) (12) (26)<br />
Western Transitional Bananas Suk. Wiki Pineapple Bananas<br />
(51) (10) (7) (47)<br />
High Potential Maize Bananas Pumpkin Tomatoes Tomatoes<br />
Zone<br />
(19) (14) (14) (21)<br />
Western Highl<strong>and</strong>s Bananas Suk. Wiki Tomatoes Bananas<br />
(63) (9) (8) (58)<br />
Central Highl<strong>and</strong>s Cabbage Bananas Carrots Cabbage<br />
(27) (23) (10) (38)<br />
Note: % of total production <strong>and</strong> sales values are within zones.<br />
3.2. Income Share Analysis<br />
Mangoes<br />
(20)<br />
Avocado<br />
(13)<br />
Sugarcane<br />
(14)<br />
Suk. Wiki<br />
(14)<br />
Bananas<br />
(16)<br />
Tomatoes<br />
(12)<br />
Carrots<br />
(14)<br />
Bananas<br />
(16)<br />
Macadamia<br />
Nuts<br />
(12)<br />
Mangoes<br />
(13)<br />
Tomatoes<br />
(10)<br />
Cabbage<br />
(13)<br />
Suk. Wiki<br />
(11)<br />
Bananas<br />
(12)<br />
Income shares indicate the proportion of total household income that comes from different<br />
types of economic activities, <strong>and</strong> thus reveal the importance of different types of activities in<br />
smallholder income <strong>and</strong> food security strategies. Income includes the value of all crop <strong>and</strong><br />
livestock production, even if retained on farm, plus off-farm incomes <strong>and</strong> remittances. Table<br />
3.5 shows mean household income shares of eight different economic activities during 2000.<br />
Off-farm labor (informal business <strong>and</strong> wages plus formal salaries <strong>and</strong> remittances) is a key<br />
contributor to overall income in all zones, with shares ranging from 27-29% in Western <strong>and</strong><br />
Central Highl<strong>and</strong>s to 60% in Coastal Lowl<strong>and</strong>s. <strong>Horticultural</strong> income shares are highest in<br />
Western Highl<strong>and</strong>s at 26%, even though total value of horticultural production <strong>and</strong> sales in<br />
this area are below those in Eastern Lowl<strong>and</strong>s <strong>and</strong> Central Highl<strong>and</strong>s (Table 3.2); the<br />
discrepancy is due to very low overall income levels in the Western Highl<strong>and</strong>s. Other zones<br />
with relatively high horticultural shares are Coastal Lowl<strong>and</strong>s <strong>and</strong> Eastern Lowl<strong>and</strong>s. Only in<br />
Western Highl<strong>and</strong>s does the horticultural share exceed that of cereals, tubers, <strong>and</strong> pulses, but<br />
horticulture exceeds livestock in four of the seven zones <strong>and</strong> exceeds industrial crops in five<br />
of the seven. <strong>Horticultural</strong> sales are equivalent to or greater than sales of cereals, pulses, <strong>and</strong><br />
tubers in six of the seven zones, reflecting the fact that households tend to sell a greater<br />
proportion of their horticultural production than they do their staples.<br />
3.3. Concentration of <strong>Horticultural</strong> <strong>Production</strong> <strong>and</strong> Sales<br />
The previous results suggest that horticultural production <strong>and</strong> sales are an important but not<br />
predominant contributor to income for the average household. Yet averages can hide a great<br />
deal of variability. Examining levels of concentration of horticultural sales will allow us to<br />
peer behind these averages <strong>and</strong> assess differences in the role that horticultural production <strong>and</strong><br />
sales play across households. In Table 3.6, we break all households in our sample into seven