Characterisation of Fresh Produce City Supply: The Case of Lusaka ...
Characterisation of Fresh Produce City Supply: The Case of Lusaka ...
Characterisation of Fresh Produce City Supply: The Case of Lusaka ...

You also want an ePaper? Increase the reach of your titles
YUMPU automatically turns print PDFs into web optimized ePapers that Google loves.
<strong>Characterisation</strong> <strong>of</strong> <strong>Fresh</strong> <strong>Produce</strong><br />
<strong>City</strong> <strong>Supply</strong>: <strong>The</strong> <strong>Case</strong> <strong>of</strong> <strong>Lusaka</strong> in<br />
Zambia<br />
By Munguzwe Hichaambwa<br />
Indaba Agricultural Policy Research Institute (IAPRI), Formerly<br />
Food Security Research Project (FSRP)<br />
Presented at the Workshop on Methodology for Fruit and<br />
Vegetable <strong>City</strong> <strong>Supply</strong> in East and Southern Africa on 5-6<br />
December 2011, in Nairobi Kenya
Presentation outline<br />
1. <strong>Lusaka</strong> households fresh produce budget<br />
shares<br />
2. <strong>Lusaka</strong> households fresh produce market<br />
shares<br />
3. Organisation <strong>of</strong> fresh produce supply markets<br />
4. Current fresh produce supply<br />
characterisation work - Methodology<br />
5. Examples <strong>of</strong> outputs from fresh produce<br />
supply characterisation work
1. <strong>Fresh</strong> produce budget shares
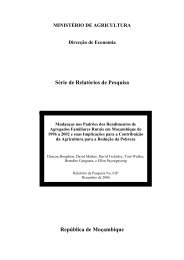
<strong>Lusaka</strong> household expenditure shares <strong>of</strong> food<br />
types per adult expenditure equivalent<br />
Food Items % <strong>of</strong> Food<br />
Expenditure<br />
Cereals and staples 24.1<br />
Dairy items 5.2<br />
Meat & eggs 16.8<br />
Fish 7.6<br />
Vegetables 13.7<br />
Fruits 3.6<br />
Legumes 3.7<br />
Sugar and oils 7.9<br />
Other foods 4.7<br />
Tobacco and alcohol 5.3<br />
Food away from home 7.3<br />
Total 100.0<br />
Source: CSO/MAL/IAPRI Urban Consumption Survey, 2007/8<br />
Fruits & vegetables (17.3%)<br />
only second to cereals/ staples
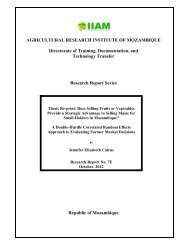
Fruit/Vegetable<br />
Budget share (%) <strong>of</strong> <strong>Lusaka</strong> urban households'<br />
monthly expenditure on fresh produce<br />
Rape<br />
Tomato<br />
Onion<br />
Cabbage<br />
Local leaves<br />
Banana<br />
Oranges / tangerines<br />
Apple<br />
Other fruit<br />
Other vegetables<br />
3<br />
4<br />
4<br />
6<br />
8<br />
9<br />
9<br />
0 5 10 15 20 25<br />
13<br />
% Share<br />
Source: CSO/MAL/IAPRI Urban Consumption Survey, 2007/8<br />
20<br />
23<br />
3 main items<br />
account for 52%
Fruit/Vegetable<br />
Budget share (%) <strong>of</strong> <strong>Lusaka</strong> urban households'<br />
monthly expenditure on fresh produce<br />
Rape<br />
Tomato<br />
Onion<br />
Cabbage<br />
Local leaves<br />
Banana<br />
Oranges / tangerines<br />
Apple<br />
Other fruit<br />
Other vegetables<br />
3<br />
4<br />
4<br />
6<br />
8<br />
9<br />
9<br />
0 5 10 15 20 25<br />
13<br />
% Share<br />
Source: CSO/MAL/IAPRI Urban Consumption Survey, 2007/8<br />
20<br />
23<br />
Local/traditional<br />
leaves <strong>of</strong> pumpkin,<br />
cassava, s/potato, etc.<br />
are also important
Fruit/Vegetable<br />
Budget share (%) <strong>of</strong> <strong>Lusaka</strong> urban households'<br />
monthly expenditure on fresh produce<br />
Rape<br />
Tomato<br />
Onion<br />
Cabbage<br />
Local leaves<br />
Banana<br />
Oranges / tangerines<br />
Apple<br />
Other fruit<br />
Other vegetables<br />
3<br />
4<br />
4<br />
6<br />
8<br />
9<br />
9<br />
0 5 10 15 20 25<br />
13<br />
% Share<br />
Source: CSO/MAL/IAPRI Urban Consumption Survey, 2007/8<br />
20<br />
3 most important fruits<br />
account for 13%<br />
23
2. <strong>Fresh</strong> produce market shares
Share <strong>of</strong> retail channels used for fresh produce<br />
purchases<br />
Retail Channel % Share<br />
Market stand/stall 68.04<br />
kaSector 26.58<br />
Grocery shops 0.35<br />
Mini-mart/small supermarket 0.49<br />
Large supermarket, independent 0.24<br />
Large supermarket, chain 2.46<br />
Private household 1.82<br />
Other 0.01<br />
Total 100.00<br />
Source: CSO/MAL/IAPRI Urban Consumption Survey, 2007/8<br />
<strong>The</strong> market and kaSector have<br />
the largest share (95%)
Share <strong>of</strong> retail channels used for fresh produce<br />
purchases<br />
Retail Channel % Share<br />
Market stand/stall 68.04<br />
kaSector 26.58<br />
Grocery shops 0.35<br />
Mini-mart/small supermarket 0.49<br />
Large supermarket, independent 0.24<br />
Large supermarket, chain 2.46<br />
Private household 1.82<br />
Other 0.01<br />
Total 100.00<br />
Source: CSO/MAL/IAPRI Urban Consumption Survey, 2007/8<br />
Includes mobile/street<br />
vendors, kashop or kiosk,<br />
katable/kantemba<br />
(rudimental make shift<br />
structures)
Share <strong>of</strong> retail channels used for fresh produce<br />
purchases<br />
Retail Channel % Share<br />
Market stand/stall 68.04<br />
kaSector 26.58<br />
Grocery shops 0.35<br />
Mini-mart/small supermarket 0.49<br />
Large supermarket, independent 0.24<br />
Large supermarket, chain 2.46<br />
Private household 1.82<br />
Other 0.01<br />
Total 100.00<br />
Source: CSO/MAL/IAPRI Urban Consumption Survey, 2007/8<br />
Supermarkets or the<br />
modern market system<br />
accounts for
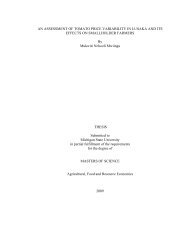
%Share <strong>of</strong> modern market system by household<br />
income level<br />
Percent market share <strong>of</strong> moden system<br />
10<br />
9<br />
8<br />
7<br />
6<br />
5<br />
4<br />
3<br />
2<br />
1<br />
0<br />
Modern market system<br />
(grocer/mini-mart/supermarkets)<br />
share highest among the high<br />
income group. But still share is<br />
much less compared to that <strong>of</strong><br />
the traditional market system<br />
(90.5%) within this income group<br />
0.4<br />
1.2<br />
Low Medium High<br />
Household income level<br />
Source: CSO/MAL/IAPRI Urban Consumption Survey, 2007/8<br />
9.5
%Share <strong>of</strong> modern/formal market<br />
system <strong>of</strong> selected items<br />
Item % Share<br />
Apples 25.2<br />
Watermelons 14.3<br />
Bananas 13.6<br />
Green beans 10.6<br />
Oranges/tangerines 7.1<br />
Pumpkin leaves 4.1<br />
Cabbage 2.7<br />
Sweet potato leaves 2.6<br />
Onion 2.4<br />
Tomato 2.0<br />
Rape 0.6<br />
Source: CSO/MAL/IAPRI Urban Consumption Survey, 2007/8<br />
Apples have largest<br />
share and is largely<br />
imported from South<br />
Africa
%Share <strong>of</strong> modern/formal market<br />
system <strong>of</strong> selected items<br />
Item % Share<br />
Apples 25.2<br />
Watermelons 14.3<br />
Bananas 13.6<br />
Green beans 10.6<br />
Oranges/tangerines 7.1<br />
Pumpkin leaves 4.1<br />
Cabbage 2.7<br />
Sweet potato leaves 2.6<br />
Onion 2.4<br />
Tomato 2.0<br />
Rape 0.6<br />
Source: CSO/MAL/IAPRI Urban Consumption Survey, 2007/8<br />
<strong>The</strong> fresh produce items with<br />
more than 10% share <strong>of</strong> modern<br />
market system are by and large<br />
fruits, except green beans
%Share <strong>of</strong> modern/formal market<br />
system <strong>of</strong> selected items<br />
Item % Share<br />
Apples 25.2<br />
Watermelons 14.3<br />
Bananas 13.6<br />
Green beans 10.6<br />
Oranges/tangerines 7.1<br />
Pumpkin leaves 4.1<br />
Cabbage 2.7<br />
Sweet potato leaves 2.6<br />
Onion 2.4<br />
Tomato 2.0<br />
Rape 0.6<br />
Source: CSO/MAL/IAPRI Urban Consumption Survey, 2007/8<br />
Very small share for<br />
the main consumed<br />
items (tomato, rape &<br />
onion). Comparable to<br />
that <strong>of</strong> local/traditional<br />
leaves
3. Organisation <strong>of</strong> supply markets
<strong>The</strong> traditional system<br />
• <strong>The</strong> main wholesale market is Soweto supplying<br />
the bulk <strong>of</strong> fresh produce to mainly retail<br />
traditional markets & kaSector<br />
• Two other smaller wholesale markets (Ngoma &<br />
Bauleni)<br />
• Soweto, Ngoma & Bauleni also serve fresh<br />
produce retail functions as well<br />
• In addition, there are about 17 retail markets<br />
located mostly in neighbourhoods within the city
<strong>The</strong> modern system<br />
• Supermarket presence and share has increased<br />
since last survey (2007/8). In addition to Shoprite:<br />
– Spar has opened more outlets<br />
– Pick and Pay has so far opened 2 large stores in the<br />
city<br />
• <strong>The</strong>se have registered preferential suppliers<br />
• Sometimes these suppliers select good quality<br />
produce from Soweto to supply the supermarkets
•<br />
4. Current <strong>Supply</strong> characterisation<br />
work
At Wholesale market level (Soweto)<br />
• Main objectives <strong>of</strong> the characterisation is understanding the<br />
structure & behaviour <strong>of</strong> fresh produce markets (tomato, rape &<br />
onion)<br />
– Tracking trade volume flows<br />
– Tracking both first sellers’ (equivalent <strong>of</strong> wholesale) and retail prices<br />
• For each lot <strong>of</strong> the product capture quantity, source (province,<br />
district, specific area or village) among others 3 days a week since<br />
January, 2007.<br />
– Have a SPSS trade flow database <strong>of</strong> 73,968 cases<br />
– Hourly first sellers prices database <strong>of</strong> 31,804 cases<br />
• Also track retail prices at 1 retail market and 3 selected<br />
supermarkets (database has 20,909 cases to date)<br />
• Employs 2 full time data collectors/entering
Retail markets mapping<br />
• Sample <strong>of</strong> 10 traders <strong>of</strong> each product in all retail markets<br />
(except Soweto and <strong>City</strong> market)<br />
• Use one page questionnaire capturing sources <strong>of</strong> produce<br />
sold at time <strong>of</strong> interview, during the hot-wet, hot-dry and<br />
cold-dry seasons<br />
• Possible sources are Soweto, other wholesale markets, at<br />
farms or farmers delivering directly<br />
• Specific areas <strong>of</strong> direct farm sources are captured<br />
• Scores out <strong>of</strong> 10 are used to estimate proportion <strong>of</strong><br />
produce from different sources and specific areas<br />
• All traders in each market for each produce are counted for<br />
weighting purposes<br />
• Captures produce not sourced through the main wholesale<br />
markets (Soweto)<br />
• Conducted over a 3-5 days period and labour costs about<br />
US$1,000 including data entry
5. Sample characterisation:<br />
<strong>Lusaka</strong> <strong>City</strong><br />
(a)Market Sheds<br />
Tomato<br />
Mumbwa<br />
(14%)<br />
Chibombo<br />
(15%)<br />
Mkiushi<br />
(17%)<br />
Chongwe<br />
(22%)<br />
Source: Tschirley and Hichaambwa, 2010<br />
<strong>Lusaka</strong> Dist. (19%)
<strong>Lusaka</strong> <strong>City</strong><br />
Market Sheds (cont’d)<br />
Rape<br />
Chibombo<br />
(12%)<br />
Source: Tschirley and Hichaambwa, 2010<br />
Chongwe<br />
(71%)
<strong>Lusaka</strong> <strong>City</strong><br />
Market Sheds (cont’d)<br />
Onion<br />
Source: Tschirley and Hichaambwa, 2010<br />
<strong>Lusaka</strong> Dist. (21%)<br />
South Africa (28%)<br />
Malawi<br />
(30%)
(b) <strong>Supply</strong> by wards
(c) Seasonality <strong>of</strong> supply: e.g. onion from the 3 main supply districts<br />
Malawi border supplies<br />
in the rain season<br />
(Oct/Nov to Dec/Jan)<br />
SA supplies from Jan<br />
to May/June<br />
<strong>Lusaka</strong> supplies mostly in<br />
the dry season
Thank You for Your Attention