Fertilizer Markets and Agricultural Production Incentives - Tegemeo ...
Fertilizer Markets and Agricultural Production Incentives - Tegemeo ...
Fertilizer Markets and Agricultural Production Incentives - Tegemeo ...

You also want an ePaper? Increase the reach of your titles
YUMPU automatically turns print PDFs into web optimized ePapers that Google loves.
<strong>Tegemeo</strong> Institute Of <strong>Agricultural</strong><br />
Policy And Development<br />
<strong>Tegemeo</strong> Working Paper 3<br />
AGRICULTURAL PRODUCTION INCENTIVES:<br />
FERTILIZER MARKETS AND<br />
INSIGHTS FROM KENYA<br />
Maria Wanzala, T.S. Jayne, John M. Staatz,<br />
Amin Mugera, Justus Kirimi, <strong>and</strong> Joseph Owuor<br />
June 25 th 2001<br />
Support for this study was provided by the Rockefeller Foundation <strong>and</strong> by the <strong>Tegemeo</strong><br />
<strong>Agricultural</strong> Monitoring <strong>and</strong> Policy Analysis (TAMPA) Project, a joint collaboration between<br />
Egerton University/<strong>Tegemeo</strong> Institute <strong>and</strong> Michigan State University, supported by the United<br />
States Agency for International Development/Kenya; <strong>and</strong> by USAID/Africa Bureau/Office of<br />
Sustainable Development.<br />
At the time of this study, Wanzala was a Visiting Research Specialist at <strong>Tegemeo</strong> Institute,<br />
Nairobi Kenya, <strong>and</strong> is a graduate student at Michigan State University. Mugera <strong>and</strong> Kirimi are<br />
research assistants at <strong>Tegemeo</strong> Institute. Staatz <strong>and</strong> Jayne are Professors, Michigan State<br />
University, <strong>and</strong> Owuor is Lecturer at Egerton University, Njoro, Keny
TABLE OF CONTENTS<br />
1. INTRODUCTION .......................................................... 1<br />
1.1. Problem Statement <strong>and</strong> Objectives .................................... 2<br />
1.2. Data ............................................................ 3<br />
2. TRENDS IN FERTILIZER USE AND PRICES ................................... 3<br />
3. PATTERNS OF FERTILIZER USE IN KENYA ................................. 11<br />
3.1 Intensity of <strong>Fertilizer</strong> Nutrient Use ..................................... 11<br />
4. ACTORS AND INSTITUTIONS IN THE FERTILIZER SUBSECTOR .............. 14<br />
4.1. <strong>Fertilizer</strong> Traders in the Private Sector ................................ 14<br />
4.1.1. Importers ................................................. 14<br />
4.1.2. Wholesalers ............................................... 15<br />
4.1.3. Retailers .................................................. 17<br />
4.2. Agents <strong>and</strong> Marketing Facilitators .................................... 18<br />
4.2.1. Agents ................................................... 18<br />
4.2.2. Transporters ............................................... 18<br />
5. EMPIRICAL ANALYSIS OF THE COMPETITIVENESS OF MARKETING<br />
CHANNELS ............................................................. 19<br />
5.1. Specification of Marketing Channels ................................. 20<br />
5.2. Cost Build-Ups .................................................. 21<br />
6. FARM-BUDGET SIMULATIONS ............................................ 32<br />
7. CONCLUSION AND POLICY RECOMMENDATIONS .......................... 35<br />
APPENDIX A ............................................................... 37<br />
REFERENCES .............................................................. 41<br />
ii
LIST OF TABLES<br />
Table 1. Annual <strong>Fertilizer</strong> Consumption by Selected Crops ........................... 6<br />
Table 2. Farm Budgets for Selected Districts, 1999, in Ksh/acre ...................... 10<br />
Table 3. Sample Characteristics, Rainfall <strong>and</strong> Population Density by Agro-Regional Zones 12<br />
Table 4. <strong>Fertilizer</strong> Nutrient Use Per Acre in 1996/7 <strong>and</strong> 1997/8 ....................... 13<br />
Table 5. Distribution of Wholesalers by Number of Bags Purchased ................... 16<br />
Table 6. Distribution of retailers by number of bags purchased ....................... 18<br />
Table 7. Marketing Channels for Performance Analysis............................. 21<br />
Table 8.1. Port to Farmgate Cost Build-up for Dap <strong>Fertilizer</strong> (April, 1999): Channel 1 ..... 22<br />
Table 8.2. Port to Farmgate Cost Build-up for Dap <strong>Fertilizer</strong> (April, 1999): Channel 2 ..... 24<br />
Table 8.3. Port to Farmgate Cost Build-up for Dap <strong>Fertilizer</strong> (April, 1999): Channel 3 ..... 26<br />
Table 8.4. Port to Farmgate Cost Build-up for Dap <strong>Fertilizer</strong> (April 1999): Channel 4 ...... 28<br />
Table 9. Simulated Changes in Maize Profitability From Illustrative Reductions in <strong>Fertilizer</strong><br />
Marketing Costs, Bungoma, Lugari, <strong>and</strong> Trans Nzoia Districts, 1999. ........... 34<br />
LIST OF FIGURES<br />
Figure 1. The <strong>Fertilizer</strong> Subsector in Kenya ........................................ 2<br />
Figure 2. <strong>Fertilizer</strong> Consumed by Type (1997-1998) ................................. 5<br />
Figure 3. Trends in <strong>Fertilizer</strong> Consumption in Kenya, 1980 - 1998 ...................... 6<br />
Figure 4.<br />
Nominal <strong>and</strong> Constant (1999 = 100) f.o.b. Mombasa <strong>and</strong> Wholesale Nakuru Prices of<br />
DAP, 1990-1999 ..................................................... 7<br />
Figure 4a (nominal) ................................................... 7<br />
Figure 4b (Real) ...................................................... 7<br />
Figure 5. Maize - DAP <strong>Fertilizer</strong> Price Ratios for Selected <strong>Markets</strong>, 1985-1998. ........... 8<br />
Figure 6. Multiplicity of Marketing Channels in the <strong>Fertilizer</strong> Subsector ................ 20<br />
iii
1. INTRODUCTION<br />
Agriculture is the major economic sector in Kenya, employing over 70% of the population <strong>and</strong><br />
contributing 24.6% to GDP (Economic Review, 1999). Therefore, economic development<br />
hinges on an improvement in agricultural productivity which, in turn, hinges on the use of<br />
productivity-enhancing inputs such as fertilizer.<br />
As was the case in many African countries, in the late 80’s the Government of Kenya embarked<br />
upon a process to reform its agricultural sector, including the fertilizer subsector. However,<br />
unlike most other African countries, fertilizer market reform in Kenya has entailed not just the<br />
legalization of private trade, but also the virtual exit of government from continued involvement<br />
in distributing fertilizer. In other African countries, concerns with the ability of the private<br />
sector to meet the needs of smallholder farmers, especially with regard to credit <strong>and</strong> service<br />
provision to farmers in remote areas, has motivated governments to continue distributing<br />
fertilizer during the liberalization period, often at subsidized prices. Some studies have<br />
concluded that government distribution programs have often hampered commercial trading<br />
incentives <strong>and</strong> hence impeded the private sectors’ response to liberalization (IFDC 2001;<br />
Govereh et al 2001; Stepanek et al 2001). By contrast, in 1993, the Government of Kenya<br />
withdrew completely from fertilizer distribution <strong>and</strong> since then, it has relied on the private sector<br />
<strong>and</strong> cooperatives to meet the fertilizer needs of farmers. By contrast, 95% of the fertilizer<br />
consumed in Kenya is imported <strong>and</strong> distributed by the private sector. 1 Because of this, the<br />
Kenyan experience provides an interesting test of how fertilizer markets have evolved (for a<br />
given level of institutional <strong>and</strong> infrastructural development) <strong>and</strong> whether they effectively serve<br />
the needs of smallholder farmers.<br />
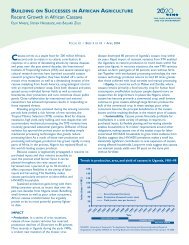
Figure 1 shows the current organization of the fertilizer market. There are two types of private<br />
sector groups involved in the market. The first group consists of importers, wholesalers <strong>and</strong><br />
retailers who sell to farmers <strong>and</strong> to non-governmental organizations. The second group consists<br />
of smallholder cash-cropping firms involved in interlocked input-output market arrangements,<br />
<strong>and</strong> large estates, some of whom import their own fertilizer directly <strong>and</strong> some of whom purchase<br />
fertilizer directly from private importers. This paper focuses on the segment of the private sector<br />
that is comprised of importers, wholesalers <strong>and</strong> retailers. It is hereafter referred to as the private<br />
sector.<br />
Government <strong>and</strong> donors anticipated that the fertilizer market reforms would initiate major<br />
investment by private firms in fertilizer distribution <strong>and</strong> marketing that would increase financial<br />
<strong>and</strong> physical access to fertilizers, particularly by smallholders who had been neglected under the<br />
1 The remaining 5% is donor-sourced by the Ministry of Agriculture-KRII program (MOA-KRII) which<br />
imports fertilizers that the private sector does not import, <strong>and</strong> sells it to private traders via an open tendering system.<br />
Instead of the government receiving aid monies, it receives the goods (fertilizers, pesticides, <strong>and</strong> agricultural <strong>and</strong><br />
industrial machinery from Japanese companies) which it sells internally to the private sector <strong>and</strong> uses the proceeds<br />
to finance donor-approved development projects in any economic sector.<br />
1
Figure 1. The <strong>Fertilizer</strong> Subsector in Kenya<br />
Overseas Suppliers<br />
Donors<br />
Importers<br />
GOK<br />
Integrated<br />
Smallholder<br />
Cash-Crop<br />
Schemes<br />
Wholesalers<br />
Retailers<br />
NGOs<br />
Estates<br />
Cooperatives<br />
Large <strong>and</strong><br />
Small Farmers<br />
In High Potential<br />
Areas<br />
Farmers in<br />
Low-Potential<br />
Areas<br />
Key:<br />
GOK = Government of Kenya<br />
NGO = Non-governmental organizations<br />
controlled system, <strong>and</strong> thus catalyze farmer uptake <strong>and</strong> more efficient use of fertilizer (Arwings-<br />
Kodhek, 1996). Moreover, advocates of output market reforms, which were launched in the late<br />
1980s, argued that the reforms would raise farm prices <strong>and</strong> production, which would in turn<br />
stimulate dem<strong>and</strong> for purchased inputs like fertilizer (Nyoro et al., 1999).<br />
However, the general view in Kenya is that the performance of the reformed fertilizer subsector<br />
has fallen short of expectations. On the one h<strong>and</strong>, liberalization has increased private sector<br />
participation in fertilizer marketing <strong>and</strong> distribution. The number of players in the fertilizer<br />
subsector has mushroomed; 78% of the retailers <strong>and</strong> 73% of the wholesalers surveyed in1999<br />
entered the fertilizer trade after liberalization commenced in 1990. Allgood <strong>and</strong> Kilungu (1996)<br />
estimate that in 1996 there were already 10-12 importers, 500 wholesalers, <strong>and</strong> 5000 retailers of<br />
fertilizer countrywide. But despite the increase in the number of traders, the expected large<br />
increase in fertilizer use has not taken place.<br />
1.1. Problem Statement <strong>and</strong> Objectives<br />
Policy makers in Kenya regard agricultural productivity growth <strong>and</strong> rural food security as<br />
important objectives of policy. There is therefore much interest in assessing whether the current<br />
2
system of fertilizer marketing helps to promote the achievement of these objectives, <strong>and</strong> if not,<br />
what changes might be identified to improve the performance of fertilizer marketing. The paper<br />
has several specific objectives. First, we identify how fertilizer marketing costs <strong>and</strong> the types of<br />
fertilizers used have changed over the course of the liberalization process in Kenya. A second<br />
objective is to examine the fertilizer subsector in Kenya with a view to identifying organizational<br />
<strong>and</strong> institutional changes that could improve its performance. To do this, we identify various<br />
types of fertilizer supply chains serving farmers in western Kenya, examine the cost structure of<br />
these supply chains, identify potential sources of cost reduction in these supply chains, <strong>and</strong><br />
lastly, estimate the impact of illustrative scenarios for reducing fertilizer marketing costs on the<br />
profitability of maize production in western Kenya. We draw our findings from small/medium<br />
farm budgets in three districts: Bungoma, Lugari, <strong>and</strong> Trans Nzoia.<br />
This study may have broader regional significance in that the Kenyan experience provides an<br />
opportunity to assess the private sectors’ response to reforms <strong>and</strong> their ability to meet the needs<br />
of smallholder farmers in the an environment where the state has almost totally withdrawn from<br />
fertilizer marketing. The findings of this study may therefore be useful to the other African<br />
countries that are still undergoing the process of liberalizing their fertilizer subsector, <strong>and</strong> can<br />
benefit from the lessons to be learnt from Kenya’s experience.<br />
1.2. Data<br />
The analysis is based on several types of data. Structured surveys of fertilizer traders were<br />
carried out during the long rains fertilizer trading season in 1999 which extends from January to<br />
August, inclusive. After identifying the universe of traders operating in the purposively targeted<br />
districts of Western Kenya, a sample of traders were identified in each district for interview. The<br />
following groups were interviewed: importers, wholesales, retailers, transporters, officials of<br />
various ministries in particular the Ministry of Agriculture, <strong>and</strong> other government <strong>and</strong> private<br />
sector bodies that are involved in the importation, marketing <strong>and</strong> distribution of fertilizer to<br />
smallholders in Rift Valley <strong>and</strong> Western Provinces in Western Kenya. The emphasis was on the<br />
marketing of DAP fertilizer in Western Kenya because: a) 69% of the maize produced in Kenya<br />
is in these two provinces; b) maize receives more fertilizer than any other crop in Kenya - 37%<br />
of the total fertilizer applied in Kenya in 1997/98; c) the majority of this is DAP, which<br />
accounted for the 40% of the fertilizer consumed in Kenya in 1998 (KAMPAP, 1997/8). The<br />
trader survey data was augmented by household-level survey data on fertilizer use patterns<br />
collected in 1997 under the <strong>Tegemeo</strong>/Egerton University/MSU Kenya <strong>Agricultural</strong> Monitoring<br />
<strong>and</strong> Policy Analysis Project.<br />
2. TRENDS IN FERTILIZER USE AND PRICES<br />
The main types of fertilizers consumed in Kenya are compound fertilizers that provide both<br />
nitrogen <strong>and</strong> phosphate. Planting fertilizers for grain (DAP, NPK) comprise the majority of the<br />
fertilizer consumed in Kenya, while straight nitrogenous fertilizers such as CAN <strong>and</strong> Urea are<br />
used for top-dressing. DAP is used on maize, MAP on wheat, NPK 25:5:5 is used on tea, NPK<br />
3
17:17:17 <strong>and</strong> MOP (Muriate of Potash) on coffee, <strong>and</strong> speciality fertilizers are used on<br />
horticultural crops particularly in the flower industry. (Figure 2)<br />
In general, fertilizer consumption has increased in the post-liberalization era. Annual fertilizer<br />
consumption increased by 19% from an average of 232,974 metric tonnes between 1984/85 <strong>and</strong><br />
1992/93 to 277,084 metric tonnes between 1993/94 <strong>and</strong> 1997/98. (Figure 3).<br />
However, an decomposition of fertilizer use by crop shows important variations over time (Table<br />
1). Analysis of this variation in consumption by crops reveals that consumption of maize<br />
fertilizer (DAP) declined from 70,182 tonnes between 1984/85 <strong>and</strong> 1992/93, to 67,636 tonnes<br />
between 1993/94 <strong>and</strong> 1997/98. Hence, the overall share of DAP in total fertilizer consumption<br />
declined from 30.1 % to 24.4 %. In contrast, the overall share of tea fertilizer increased from<br />
18.4 % to 21.2 % during the same period; the share of wheat fertilizer (MAP) rose from 2.1% to<br />
6.8%; <strong>and</strong> the share of speciality fertilizer rose from 2.1 % to 4.2 %. Therefore, the overall<br />
increase in fertilizer use in the post-liberalization era can be attributed to the increased use of<br />
fertilizer on tea, wheat, <strong>and</strong> horticultural crops, while the declining use of maize fertilizer (DAP)<br />
is dragging down national fertilizer consumption.<br />
One possible explanation for the decline in DAP consumption is that fertilizer market reform has<br />
been associated with an increase in the price of fertilizer <strong>and</strong> dampened economic incentives to<br />
use this input. However, empirical data does not support this hypothesis. Analysis of secondary<br />
price data reveals that while nominal fertilizer prices have increased in the post-liberalization<br />
era, the price of most fertilizers has declined in real terms. The domestic price of fertilizer is a<br />
function of world prices, exchange rates <strong>and</strong> internal market conditions. Between 1990 <strong>and</strong><br />
1999, the f.o.b. price of DAP delivered at Mombasa in 1999 has increased by 200% from about<br />
200 Ksh per 50kg bag to 600 Ksh per 50 kg bag <strong>and</strong> consequently, nominal retail price of DAP<br />
in Nakuru rose by 220% (MOA, 1999). 2 (Figure 4a) Two factors can account for this increase.<br />
Between 1992 <strong>and</strong> 1999, the Kenya shilling depreciated against the US dollar by 168%. The<br />
impact of the depreciation on domestic fertilizer prices was compounded by a steady upward<br />
trend in world fertilizer prices during this same period. However, after adjusting these prices for<br />
inflation, the data shows that both these prices have actually declined in real terms (Figure 4b).<br />
2 Why Nakuru? Nakuru is a city in Western Kenya, approximately 400 km from the capital Nairobi, <strong>and</strong><br />
1000km from the port of Mombasa. The MOA has found over the years that fertilizer prices in Nakuru are the most<br />
consistently representative of fertilizer prices prevailing in Kenya. It is also a central point that much of the<br />
imported fertilizer passes through on its way upcountry, <strong>and</strong> therefore it is not a thin market.<br />
4
Figure 2. <strong>Fertilizer</strong> Consumed by Type (1997-1998)<br />
Key<br />
DAP = Diammonimum phosphate<br />
MAP = Monoammonium phosphate<br />
NPK = Nitrogen, Phosphorus, Potassium. Different types with numbers representing different percentages of the 3 nutrients: 23:23:23; 20:20:0 are<br />
the most common types of NPK used in Kenya<br />
CAN = Calcium Ammonium Nitrate<br />
TSP = Triple Super Phosphate<br />
Other specialty fertilizers = mainly horticultural fertilizers<br />
5
Figure 3. Trends in <strong>Fertilizer</strong> Consumption in Kenya, 1980 - 1998<br />
300<br />
250<br />
thous<strong>and</strong> tons<br />
200<br />
150<br />
<strong>Fertilizer</strong> market<br />
liberalization period<br />
(1993 - current)<br />
100<br />
80 82 84 86 88 90 92 94 96 98<br />
Table 1. Annual <strong>Fertilizer</strong> Consumption by Selected Crops<br />
1984/85 to 1992/93 1993/94 to 1997/98<br />
Crop/<strong>Fertilizer</strong> type Metric tonnes % Share Metric tonnes % Share<br />
Maize (DAP) 70,182 30.1 67,636 24.4<br />
Tea (25:5:5s) 42,902 18.4 58,733 21.2<br />
Coffee (17:17:17 & MOP) 23,605 10.1 23,220 8.4<br />
Wheat (MAP) 4,947 2.1 18,788 6.8<br />
Horticulture(Special fertilizer) 4,821 2.1 11,632 4.2<br />
Others(TSP, Urea, CAN, etc) 86,515 37.1 97,073 35.0<br />
Total 232,974 100 277,084 100<br />
Source: Computed from MOA data files<br />
6
Figure 4. Nominal <strong>and</strong> Constant (1999 = 100) f.o.b. Mombasa <strong>and</strong> Wholesale Nakuru Prices of DAP, 1990-1999<br />
Figure 4a (nominal)<br />
Figure 4b (Real)<br />
1600<br />
2500<br />
Ksh per 50kg bag (nominal Ksh)<br />
1400<br />
1200<br />
1000<br />
800<br />
600<br />
400<br />
200<br />
0<br />
90 91 92 93 94 95 96 97 98 99<br />
Ksh per 50kg bag (constant 1999 Ksh)<br />
2000<br />
1500<br />
1000<br />
500<br />
0<br />
90 91 92 93 94 95 96 97 98 99<br />
f.o.b. Mombasa<br />
wholesale Nakuru<br />
f.o.b. Mombasa<br />
wholesale Nakuru<br />
Source: Green <strong>Markets</strong>.<br />
7
A second possible explanation for the decline in the use of DAP fertilizer for maize is the<br />
unfavorable terms of trade between maize <strong>and</strong> DAP fertilizer. That is, the decline in real<br />
fertilizer prices paid by farmers has not translated into increased incentives to use fertilizer on<br />
maize, because real maize prices have fallen even faster than fertilizer prices during the 1990-<br />
1999 period. The DAP-maize price ratio for these three major maize-producing districts is<br />
shown in Figure 5. As theory would suggest, exchange rate depreciation has increased the local<br />
currency price of traded commodities such as fertilizer compared to commodities such as maize<br />
that are mainly locally traded. Most of the marketed maize output in Kenya originates from local<br />
production. So, to some extent, the observed shift in fertilizer use from largely locally traded<br />
maize to export crops such as tea <strong>and</strong> horticultural crops could have been viewed as an<br />
unsurprising consequence of exchange rate depreciation.<br />
However, this does not imply that fertilizer use on maize has become unprofitable in an absolute<br />
sense. The profitability of using fertilizer is a function of the physical yield response from<br />
applying fertilizer on the crop as well as input/output price ratios. Karanja et al. (1998), using<br />
econometric analysis of household survey data, showed that the response rate of fertilizer on<br />
maize yield was clearly profitable in most agricultural areas of Kenya, <strong>and</strong> especially in<br />
Figure 5. Maize - DAP <strong>Fertilizer</strong> Price Ratios for Selected <strong>Markets</strong>,<br />
1985-1998.<br />
Maize Wholesale price per ton / DAP price per ton<br />
2.2<br />
2.0<br />
1.8<br />
1.6<br />
1.4<br />
1.2<br />
1.0<br />
0.8<br />
fertilizer market<br />
liberalization period<br />
(1993 - current)<br />
0.6<br />
85 86 87 88 89 90 91 92 93 94 95 96 97 98<br />
Eldoret Kitale Nakuru<br />
Source: Market Information Branch, MOA for maize price data.<br />
8
conjunction with the use of hybrid seeds. They state “after considering mean fertilizer <strong>and</strong> maize<br />
prices prevailing during 1997, the year of the survey, the mean value-cost ratio for DAP fertilizer<br />
use is calculated at 5.86. This means that for every Ksh spent on DAP fertilizer, the farmer gets<br />
5.86 Ksh back in value of maize output.” There were regional differences in this value, but<br />
except for the drier agricultural zones, DAP use was clearly profitable given 1997 price ratios.<br />
Similarly, Nyambane (2001) has shown, using survey data from a number of maize-producing<br />
districts in Kenya, that the returns to l<strong>and</strong> <strong>and</strong> labor are typically higher for maize when fertilizer<br />
is applied, yet this analysis was not able to net out the effect of hybrid seed use independently<br />
from fertilizer use.<br />
Data from the 2000 season presented in Awuor (2001) also indicate that the gross margins for<br />
maize were reasonably high when fertilizer is applied. Table 2 shows farm budgets for mediumscale<br />
farmers in three major maize production districts in Western Kenya: Trans Nzoia,<br />
Kakamega/Lugari <strong>and</strong> Bungoma districts.<br />
The results show that, with the fertilizer dose rate held constant, maize yields vary because of<br />
different levels of technology <strong>and</strong> farm husb<strong>and</strong>ry techniques, <strong>and</strong> gross revenues from maize<br />
production using fertilizer (among other inputs) increase with the level of technology. Bungoma<br />
farmers use less-capital intensive technology <strong>and</strong> receive the lowest yields (14 bags/acre) <strong>and</strong><br />
revenues (Ksh13,500/acre), while the most mechanized system in Trans Nzoia provides the<br />
highest yields at 25 bags per acre <strong>and</strong> the highest revenues (27,500/acre). Although the budgets<br />
assume the same quantity of fertilizer is used in all three districts, the total fertilizer cost in<br />
Kakamega/Lugari district is higher than in Bungoma <strong>and</strong> Trans Nzoia due to the significantly<br />
higher price of CAN in Kakamega/Lugari.<br />
There are a number of important results from the budgets. First, fertilizer use on maize appears<br />
to be clearly profitable in these districts in Western Kenya. <strong>Fertilizer</strong> use on maize may be often<br />
unprofitable <strong>and</strong> very risk in the drier areas (Nyambane 2001). Secondly, fertilizer comprises a<br />
significant share of the costs of producing maize. It comprises the second highest share of the<br />
costs of production in Bungoma <strong>and</strong> Lugari districts (17% <strong>and</strong> 14% of the total production costs<br />
per acre respectively). The cost that comprises the largest share of cost of production in<br />
Bungoma is labor (20%) <strong>and</strong> in Lugari it is l<strong>and</strong> preparation (22%). However, fertilizer is third in<br />
importance in Trans Nzoia district; it ranks after fixed costs (19%) <strong>and</strong> l<strong>and</strong> preparation (14%)<br />
comprising 10% of the costs of producing one acre of maize. Clearly, in Trans Nzoia higher<br />
mechanization is substituting for labor as farmers move up to higher levels of technology.<br />
However, the costs of fertilizer remain a significant structural component.<br />
In summary, the available evidence indicates that, despite a decline in the maize/DAP price ratio<br />
over the 1990s, <strong>and</strong> increased incentives to use fertilizer on export-oriented crops because of<br />
exchange-rate depreciation during the early 1990s, fertilizer use on maize remains profitable at<br />
least in the high- <strong>and</strong> medium-potential areas of Kenya. Yet, as we have shown, there has been a<br />
marked decline in the use of fertilizer on maize, perhaps the most politically strategic crop in<br />
Kenya. The dwindling use of fertilizer on maize has raised concerns in Kenya about national<br />
9
Table 2. Farm Budgets for Selected Districts, 1999, in Ksh/acre<br />
Bungoma District Lugari District Trans Nzoia District<br />
Revenue<br />
13500 (14 bags/acre<br />
@ Ksh1000)<br />
17000 (17 bags/acre<br />
@ Ksh1000)<br />
27500 (25 bags/acre @<br />
Ksh1100)<br />
(a) Fixed Costs/acre 1125 1250 3750<br />
(b) Labor Inputs 2332 1662 1685<br />
Non-labor inputs:<br />
1 st plough 1500 1200 1200<br />
Furrowing 250 1000 not applicable<br />
1 st harrow not applicable not applicable 800<br />
2 nd harrow not applicable not applicable 800<br />
Planter Hire not applicable 800 650<br />
Hybrid seed 910 910 910<br />
DAP fertilizer* 2025 1950 2025<br />
Top-dressing fertilizer* 1425 1800 1425<br />
Chemical weeding not applicable not applicable 1600<br />
Weed spraying not applicable not applicable 500<br />
Sheller Hire not applicable 425 500<br />
Gunny bags 135 85 250<br />
Transport to store 405 484.5 375<br />
Transport to market not applicable not applicable 1250<br />
L<strong>and</strong> rent per acre 1500 2000 2000<br />
(c) Total non-labor inputs 8150 10655 14435<br />
Total costs (a+b+c) 11607 13567 19870<br />
Profit/acre 1893 3434 7630<br />
Costs/bag 829 798 789<br />
PROFIT/BAG 135 202 305<br />
* Based on application rates of 75kg of DAP/acre <strong>and</strong> 100kg of CAN/acre<br />
Source: Awuor 2001.<br />
10
food security <strong>and</strong> whether the post-liberalization fertilizer subsector is competitive. This study<br />
seeks to provide a solid empirical underst<strong>and</strong>ing of the subsector in order to assess these claims<br />
<strong>and</strong> guide future policy. The structure of the market, however, depends on the structure of<br />
dem<strong>and</strong>; hence it is first useful to examine where <strong>and</strong> how fertilizer is used in Kenya.<br />
3. PATTERNS OF FERTILIZER USE IN KENYA<br />
This section provides a foundation for the remainder of the paper by presenting basic<br />
information on fertilizer use patterns by crop <strong>and</strong> region. Analysis is based on a national rural<br />
household survey implemented under the Kenya <strong>Agricultural</strong> Monitoring <strong>and</strong> Policy Analysis<br />
Project (KAMPAP), a joint collaboration between <strong>Tegemeo</strong> Institute/Egerton University,<br />
Michigan State University, <strong>and</strong> Kenya <strong>Agricultural</strong> Research Institute. The survey was<br />
conducted in the 1996/7 season for 1540 households in 24 districts in Kenya, <strong>and</strong> repeated for a<br />
sub-sample of these households (n=612) in the 1997/98 season. The analysis here is based on<br />
the 612 households for which data was available over the two-year period. The 18 districts<br />
covered were aggregated into six agro-regional zones as shown in Table 1; these zonal<br />
definitions are used in subsequent descriptive analysis.<br />
Table 3 shows that the six zones differ greatly in population density, rainfall, <strong>and</strong> cropping<br />
patterns. Total rainfall ranged from a high of 1,211 millimeters per season in Bungoma in the<br />
Western Transitional to a low of 266 millimeters in the Eastern <strong>and</strong> Western Lowl<strong>and</strong>s. The<br />
Western Lowl<strong>and</strong>s Zone is the most densely populated, while the Eastern Lowl<strong>and</strong>s is the least<br />
populated. We defined “main cash crops” as crops that were sold by at least 40 percent of the<br />
households sampled in a zone during the 1996/97 season. According to this definition, maize<br />
<strong>and</strong> wheat were cash crops in the High Potential Maize zone, even though they were also<br />
important food crops. In general, the list of cash crops varied according to agro-ecological<br />
potential of the zone <strong>and</strong> population density, but there are notable exceptions.<br />
3.1 Intensity of <strong>Fertilizer</strong> Nutrient Use<br />
At this juncture it is important to make the distinction between fertilizer use (the amount of<br />
fertilizer material applied in kg per acre) <strong>and</strong> fertilizer nutrient use (the amount of fertilizer<br />
nutrients applied in kg/acre). Typically, a bag of fertilizer will contain both nutrients (nitrogen,<br />
phosphorus, potassium, sulphur) <strong>and</strong> fertilizer material which is just dry non-chemical matter<br />
which facilitates the packaging, h<strong>and</strong>ling <strong>and</strong> spreading of fertilizer by h<strong>and</strong>. The actual nutrient<br />
content of a bag of fertilizer is indicated on the label of the bag in percentages; hence the label of<br />
50kg bag of DAP fertilizer will indicate that it is DAP 46:18:0. This means that the actual<br />
nutrient content of the bag is 46% nitrogen, 18% phosphorus, <strong>and</strong> 0% potassium. Therefore a<br />
50kg bag of DAP actually holds 23 kg of nitrogen, 9kg of phosphorus, <strong>and</strong> the remaining 18kgs<br />
is dry fertilizer material. The data on fertilizer use patterns presented in the following sections is<br />
in terms of fertilizer nutrients per acre, not fertilizer use per acre.<br />
11
Table 3. Sample Characteristics, Rainfall <strong>and</strong> Population Density by Agro-Regional Zones<br />
Zone District Number of<br />
sampled<br />
households<br />
surveyed both<br />
in<br />
1997 <strong>and</strong> 1998<br />
Rainfall<br />
(mm)<br />
Population<br />
Density<br />
(inhabitants<br />
per square<br />
mile)<br />
Main Cash<br />
Crops 1<br />
Eastern Lowl<strong>and</strong>s Kitui 10 118 22<br />
Machakos 10 266 100<br />
Makueni 35 266 100 vegetables<br />
Mwingi 20 266 116<br />
Western Lowl<strong>and</strong>s Kisumu 50 659 732<br />
Siaya 35 266 732<br />
Western<br />
Bungoma 43 1211 221 Sugarcane<br />
Transitional<br />
Kakamega 65 733 411 Sugarcane<br />
High Potential Maize Bungoma 43 733 221<br />
Zone<br />
Kakamega 65 1207 411<br />
Bomet 20 1207 182 Tea<br />
Nakuru 50 1207 772 Maize<br />
Narok 11 611 480 Maize, Wheat<br />
Trans Nzoia 27 611 160 Maize<br />
Uasin Gishu 45 1092 25 Maize, Wheat<br />
Western Highl<strong>and</strong>s Kisii 40 772 517 Coffee, maize, tea<br />
Vihiga 30 480 411 Vegetables<br />
Central Highl<strong>and</strong>s Meru 40 1176 116 Vegetables, tea<br />
Muranga 33 969 340 Coffee<br />
Nyeri 48 677 186 Coffee, Tea<br />
Total 612<br />
Source: Rainfall <strong>and</strong> population density are from Kenya Statistical Abstract (1997).<br />
Note: 1) Main cash crops = more than 40 percent of households sold the crop during 1996/97. Data source: 1996/97<br />
KAMPAP Household Survey.<br />
The household data indicate that fertilizer use varies substantially across agro-regional zones, by<br />
crop, <strong>and</strong> by whether or not households use hybrid seeds. On average, more than 70 percent of<br />
the sampled households used mineral fertilizers in 1997 <strong>and</strong> 1998, <strong>and</strong> 57 percent of them used<br />
manure (manure data is only available for 1998). (Table 2.3) Manure use varies across zones,<br />
with the highest level of use found in the Eastern Lowl<strong>and</strong>s <strong>and</strong> Central Highl<strong>and</strong>s, where 84%<br />
<strong>and</strong> 91% of the households respectively, use manure. Dosage rates for manure were not<br />
available.<br />
12
However, with the exception of the central highl<strong>and</strong>s, zones where a higher percentage of<br />
households used manure had a lower percentage of households using fertilizer, <strong>and</strong> vice versa. In<br />
addition, usage of both manure <strong>and</strong> mineral fertilizer was very low among households in the<br />
Western Lowl<strong>and</strong>s.<br />
The highest levels of mineral fertilizer use were found in the High-Potential Maize Zone, the<br />
Western Highl<strong>and</strong>s <strong>and</strong> the Central Highl<strong>and</strong>s where, on average, 90% of the households used<br />
fertilizer in 1997 <strong>and</strong> 1998 (Table 4). <strong>Fertilizer</strong> use levels are also reasonably high in the<br />
Western Transitional <strong>and</strong> Eastern Lowl<strong>and</strong>s (79% <strong>and</strong> 51% for 1998, respectively), but then they<br />
fall off dramatically for the Western Lowl<strong>and</strong>s; in 1998 only 13% of these households used<br />
mineral fertilizer. Dose rates (i.e., the amount of fertilizer nutrient applied per acre among<br />
fertilizer users) also vary across zones. In 1998, only households in the Central Highl<strong>and</strong>s <strong>and</strong><br />
High-Potential maize zone applied more than 30 kg of mineral fertilizers nutrient per acre (47.9<br />
<strong>and</strong> 33.5 kg per acre, respectively).<br />
Table 4. <strong>Fertilizer</strong> Nutrient Use Per Acre in 1996/7 <strong>and</strong> 1997/8<br />
Zone Year Percent Percent of <strong>Fertilizer</strong> <strong>Fertilizer</strong> nutrient application per acre<br />
of householdholds<br />
house-<br />
Nutrient<br />
applied 2<br />
used using<br />
0 0-10 10-30 30-50 50 +<br />
manure fertilizer 1<br />
kg kgs kgs kgs kgs<br />
----- Percent ----- -kg/acre- -------- Percent of Households --------<br />
Eastern 1996/7 n.a. 45 5.31 55 35 11 0 0<br />
Lowl<strong>and</strong>s<br />
1997/8 84 51 6.54 49 37 13 0 0<br />
Western<br />
Lowl<strong>and</strong>s<br />
Western<br />
Transitional<br />
High<br />
Potential<br />
Maize Zone<br />
Western<br />
Highl<strong>and</strong>s<br />
Central<br />
Highl<strong>and</strong>s<br />
1996/7 n.a. 11 8.79 89 7 2 1 0<br />
1997/8 18 13 13.7 87 6 7 0 0<br />
1996/7 n.a. 69 15.1 31 29 32 5 3<br />
1997/8 48 79 16.6 21 31 32 16 0<br />
1996/7 n.a. 92 32.2 8 10 35 37 11<br />
1997/8 48 88 33.5 12 9 32 29 18<br />
1996/7 n.a. 91 19.5 9 27 50 10 4<br />
1997/8 51 86 19.4 14 27 46 10 3<br />
1996/7 n.a. 99 37.6 1 12 43 20 24<br />
1997/8 91 97 47.9 3 8 22 24 42<br />
1996/7 n.a. 74 27.3 26 17 31 17 9<br />
Total 1997/8 57 73 30.4 27 17 26 17 14<br />
Note: The total number of households is 612 for both year. 1) DAP is applied on 48 percent of the total 2216 plots<br />
on which fertilizer was applied; CAN 21 percent; NPK 16 percent; Urea 5%. 2) Among households who used<br />
fertilizer.<br />
13
In the High-Potential Maize Zone, about 90 percent of households used fertilizer in 1997 <strong>and</strong><br />
1998. In Central Highl<strong>and</strong>s, 99 percent of households used fertilizer in 1997, <strong>and</strong> 97 percent of<br />
households used fertilizer in 1998. Although the percentage of households that used fertilizer is<br />
high in the Western Highl<strong>and</strong>s, the average dose rate is much lower than the Central Highl<strong>and</strong>s<br />
<strong>and</strong> High-Potential maize zone. The difference comes from a lower number of high-end users.<br />
In the Western Highl<strong>and</strong>s, only 14 percent of households used more than 30 kgs of fertilizer<br />
nutrient per acre in 1997, <strong>and</strong> in 1998 that figure was 13%, while more than 40 percent of<br />
households used more than 30 kgs of fertilizer nutrients in the Central Highl<strong>and</strong>s <strong>and</strong> High-<br />
Potential maize zone.<br />
4. ACTORS AND INSTITUTIONS IN THE FERTILIZER SUBSECTOR<br />
4.1. <strong>Fertilizer</strong> Traders in the Private Sector<br />
4.1.1. Importers<br />
Importers are the principal commercial purchasers of fertilizer in a marketing channel. Importers<br />
determine the quantity of fertilizer to import for the coming season. Their import decisions take<br />
into account how much other importers will be importing, weather conditions, <strong>and</strong> maize prices.<br />
Importers place orders for fertilizer with overseas producers, establish credit arrangements with<br />
suppliers <strong>and</strong> local banks; solicit <strong>and</strong> process orders from customers; <strong>and</strong> extend credit to clients.<br />
The fertilizer import business is highly risky, primarily due to the uncertainty of local dem<strong>and</strong>,<br />
exchange rate fluctuations, <strong>and</strong> changes in world market conditions..<br />
<strong>Fertilizer</strong> imported into Kenya is sourced from the United States, Europe, the Middle East, <strong>and</strong><br />
South Africa. In 1999 there were 46 importers registered with the Ministry of Agriculture<br />
(MOA). However, only 22 firms imported more than 1,000 tons of fertilizer per year, <strong>and</strong> of<br />
these, only 10 imported over 10,000 tons in 1999. Therefore, these latter 10 are regarded by<br />
MOA as the major players in the fertilizer import business. The rest tend to enter the market on<br />
a speculative basis to take advantage of projected high dem<strong>and</strong> for a particular year.<br />
Five of the 10 major importers were interviewed for this study. Four of them had their<br />
headquarters in Nairobi, <strong>and</strong> one in the upcountry city of Kitale. Three of the five importers<br />
were Kenyan-owned companies at the time of the interviews, <strong>and</strong> two were subsidiaries of<br />
international fertilizer manufacturers. 3 Only one of these five entered the subsector after the<br />
government withdrawal in 1993; the rest had been involved in fertilizer trading for at least 10<br />
years. All the importers interviewed were diversified into other related distribution activities<br />
such as other agricultural inputs, grain trading, <strong>and</strong> hardware. The one exception is Norsk Hydro<br />
for whom fertilizer importing <strong>and</strong> distributing was its only activity in 1999.<br />
3 One of these importers is Norsk Hydro, the largest fertilizer manufacturer in the world. It has been selling<br />
fertilizer in Kenya under a USAID donor grant since the 1960’s <strong>and</strong> its fertilizer, DAP, dominates the grain market<br />
in Kenya today.<br />
14
Based on the interviews, traders were categorized on the basis of quantities purchased to<br />
facilitate analysis of marketing channels in the subsector. On this basis, two importers are<br />
categorized as large-scale (each purchasing an average of one million bags of fertilizer over the<br />
long-rains trading season). Three firms, purchasing an average of 300,000 bags over the same<br />
period were categorized as small-scale. One of these small-scale importers is vertically<br />
integrated. Therefore, importers are divided into 3 types for the purpose of this study: largescale<br />
importers (LSI); small-scale non-vertically integrated importers (SSI); <strong>and</strong> small-scale<br />
vertically integrated importers (VI).<br />
The large-scale importers typically purchased roughly 500,000 bags per consignment, while their<br />
small-scale counterparts typically purchased 100,000 to 150,000 bags per consignment. In<br />
general, all of the 10 serious importers in Kenya purchased a minimum of 100,000 bags (5,000<br />
tons) of fertilizer at one time; any less would be uneconomical since the FOB price <strong>and</strong> freight<br />
rates increase with smaller tonnages.<br />
4.1.2. Wholesalers<br />
Wholesalers are classified by this study as traders who buy fertilizer from importers <strong>and</strong><br />
transport the fertilizer to retailers or directly to large-scale farmers, cooperatives <strong>and</strong> estates<br />
throughout the country. In 1999, fertilizer wholesalers were located in the main cities in<br />
Western Kenya. Wholesalers’ functions include: placing <strong>and</strong> processing orders with importers;<br />
establishing credit arrangements either with their suppliers, with a bank, or with a personal<br />
contact; soliciting <strong>and</strong> processing orders from customers; delivering fertilizer to customers;<br />
providing credit to retailers, <strong>and</strong> storing fertilizer.<br />
The 14 fertilizer wholesalers interviewed for this study were located in six towns in three<br />
districts in the study area: six were in Kitale in Trans Nzoia district, four in Matunda in Lugari<br />
district; three in Eldoret in Uasin Gishu district; <strong>and</strong> one in Moi’s Bridge in Bungoma district.<br />
This number <strong>and</strong> spatial distribution has not changed significantly in the past 5 years. Arwing-<br />
Kodhek’s 1996 nationwide study on the evolution of fertilizer marketing in Kenya (which was<br />
carried out in 14 districts) found that in each major town visited in Western Kenya, between<br />
three <strong>and</strong> five firms were operating. This indicates that there has not been a major influx of<br />
wholesaler entrants.<br />
As was the case for importers, wholesalers were categorized into large-scale <strong>and</strong> small-scale by<br />
the number of bags of fertilizer they purchased. However, the quantities purchased by<br />
wholesalers in 1999 were biased by two factors: the 1999 shortage of DAP fertilizer, <strong>and</strong> poor<br />
record-keeping practices by some traders. During the 1999 season, one of the major importers<br />
experienced delays in securing credit for DAP importation, resulting in shortages during the first<br />
two months of the main fertilizer distribution period. This was corroborated by large-scale<br />
wholesalers reports of lower levels of DAP purchases for 1999 compared to previous years.<br />
One wholesaler, for example, reported that 1999 DAP purchases were 5,000 tons, down from<br />
7,000 tons he purchased in 1998. His purchases of the other types of fertilizer was the same for<br />
both years. Regarding poor record-keeping, some traders did not keep all their receipts. And for<br />
those who gave us total purchases over the season their memory <strong>and</strong>/or records may not have<br />
15
een perfect. Therefore, some of the categorizations may be incorrect since traders who would<br />
normally purchase larger quantities of bags were unable to. Keeping these caveats in mind, eight<br />
of the 14 wholesalers were categorized as large-scale <strong>and</strong> six were small-scale.<br />
Over the 1999 trading season, large-scale wholesalers (LSW) purchased on average 128,000<br />
bags of fertilizer <strong>and</strong> small-scale wholesalers (SSW) purchased on average 4,000 bags of<br />
fertilizer during the same period. Quantities purchased by wholesalers during the 1999 fertilizer<br />
trading season vary from 248 bags to 186,000 bags (Table 5). Five of the eight large-scale<br />
wholesalers are Asians, whereas all six of the small-scale wholesalers are Africans.<br />
Like importers, wholesalers in the sample are also involved in other businesses that are year<br />
round as opposed to seasonal like fertilizer trading. Wholesalers have diversified into<br />
agriculturally related activities such as grain trading, agricultural inputs, <strong>and</strong> hardware.<br />
There was no noticeable difference in degree of specialization between large-scale <strong>and</strong> smallscale<br />
wholesalers. However, although wholesalers have diversified, they are still more<br />
specialized than retailers; wholesalers reported that fertilizer generates, on average, 80% of their<br />
sales revenue, whereas for retailers this figure was 50%. One reason wholesalers may choose to<br />
limit the type of items they diversify into is to avoid competing with supermarkets. That is, in<br />
contrast to retailers who, in addition to agricultural inputs <strong>and</strong> hardware also sell general retail<br />
items such as foodstuffs, stationary, <strong>and</strong> shoes, wholesalers have not branched out into these<br />
other items. By contrast, there are no supermarkets in the smaller towns to compete against <strong>and</strong><br />
so retailers tend to serve as small convenience supermarkets, with fertilizer being one additional<br />
commodity for retailing.<br />
Table 5. Distribution of Wholesalers by Number of Bags Purchased<br />
Number of bags purchased Number of traders (n = 10) 1 % of fertilizer h<strong>and</strong>led<br />
0 - 1000 1 neg<br />
1001 - 5000 3 2<br />
5001 - 10,000 2 3<br />
10,001 - 20,000 1 4<br />
20,001 - 100,000 1 14<br />
100,000 - 200,000 2 77<br />
Total 10 100<br />
1 Ten of the 14 wholesalers interviewed gave us data on purchases; five were large-scale <strong>and</strong> 5 small-scale.<br />
Source: 1999 Trader Survey data.<br />
16
4.1.3. Retailers<br />
Retailers are marketing agents who purchase fertilizer from wholesalers <strong>and</strong> sell it to farmers,<br />
the final consumers. They are located in major cities <strong>and</strong> upcountry towns, as well as in the<br />
smaller market centers or ‘locations’ in the hinterl<strong>and</strong>s. Retailing functions include the buying<br />
<strong>and</strong> selling of fertilizer; rebagging into smaller quantities; provision of technical advice to<br />
farmers; delivering fertilizer to farmers; soliciting credit from their suppliers; <strong>and</strong> extending<br />
credit to farmers.<br />
The main task of retailers is to provide an ‘assortment’ or wide variety of fertilizer at a single<br />
location, making it convenient for farmers to purchase all their fertilizer needs from one location.<br />
They are typically the most numerous of marketing intermediaries, <strong>and</strong> as noted earlier, the<br />
number of fertilizer traders at the retail stage of the subsector is large relative to those at the<br />
importer <strong>and</strong> wholesaler stages (Kohls <strong>and</strong> Uhl, 1998). Three types of retailers can be identified.<br />
First, ‘speculative’ retailers: These are general retailers who sell a wide variety of items<br />
throughout the year, <strong>and</strong> only enter the fertilizer trade during the main trading season when they<br />
feel they can make a quick return. For this reason, out of the 96 retailers counted in the initial<br />
sampling frame, only 46 were still selling fertilizer at the time the interviews commenced, which<br />
was just after the main trading season had ended. The rest had already exited the industry in<br />
search of more lucrative activities for their capital. Second, there are “permanent” retailers for<br />
whom fertilizer retailing is a major part of their trade <strong>and</strong> hence they continue to sell fertilizer<br />
even after the peak season ends in May/June. The third category of retailer are traders who sell<br />
miscellaneous items on market days. During the fertilizer trading season they will buy one or<br />
two 50kg bags of fertilizer on market days (which occur once a week), typically from other<br />
retailers, <strong>and</strong> sell it in 1 or 2 kg quantities, along with their other offering. The 47 retail outlets<br />
interviewed for this survey were purposively chosen to be “permanent” retailers, <strong>and</strong> as such,<br />
this sample overestimates the sales volumes of fertilizer retailers when the universe of retailers is<br />
viewed to include the seasonal traders <strong>and</strong> petty-volume traders.<br />
For the 1999 trading season, quantities purchase by individual retailers varied from 198 bags to<br />
24,000 bags. Table 6 presents the distribution of retailer purchases (number of bags purchased<br />
in 1999).<br />
Twenty-five retailers are categorized as large-scale <strong>and</strong> 22 as small-scale. Twelve of the 25<br />
large-scale <strong>and</strong> 18 of the 22 small-scale retailers gave us data on purchases <strong>and</strong> prices. Over the<br />
1999 trading season, large-scale retailers (LSR) purchased a mean of 2000 bags of fertilizer <strong>and</strong><br />
small-scale retailers (SSR) purchased 1200 bags on average. Ownership at the retail level is<br />
dominated by Kenyan Africans regardless of scale, <strong>and</strong> 37 of the 47 retailers started trading in<br />
fertilizer after 1993.<br />
17
Table 6. Distribution of retailers by number of bags purchased<br />
Number of bags purchased Number of traders (n = 29) 1 % of fertilizer h<strong>and</strong>led<br />
0 - 500 5 2<br />
501 - 1000 11 9<br />
1001 - 2000 6 7<br />
2001 - 10,000 5 21<br />
10,001 - 20,000 1 14<br />
20,001 - 25000 2 47<br />
Total 30 100<br />
1 30 of the 47 retailers interviewed were willing to give us data on quantities purchased<br />
Source: 1999 Trader Survey data.<br />
4.2. Agents <strong>and</strong> Marketing Facilitators<br />
4.2.1. Agents<br />
The only agents involved in fertilizer trading are clearing agents at the port of Mombasa. They<br />
receive fertilizer on behalf of importers <strong>and</strong> clear it through customs at the port. In general,<br />
fertilizer traders do not use purchasing agents or brokers (to sell) because it is perceived to be too<br />
risky.<br />
4.2.2. Transporters<br />
Road transportation dominates the distribution of fertilizer within Kenya. In 1999, road<br />
transporters distributed 72% of the grain fertilizer imported into Kenya, <strong>and</strong> 80% of the total<br />
amount of fertilizer imported into Kenya (Kenya Railways, 1999). Traders at every stage of the<br />
subsector provide delivery of fertilizer as part of their customer service; however, the majority of<br />
this transportation is hired, as very few traders own their own trucks.<br />
There are two tiers of transporters catering to the fertilizer industry in Kenya. The first tier<br />
consists of the big transporters, operating trucks with a carrying capacity of between 28 <strong>and</strong> 32<br />
tons. Transportation of fertilizer from the port of Mombasa to the various upcountry destinations<br />
of Nairobi, Nakuru, Eldoret <strong>and</strong> Kitale is dominated by these big transporters. They typically<br />
own a fleet of at least 20 trucks, mainly Scanias or Mercedes Benz, <strong>and</strong> charge on a per ton per<br />
km basis, <strong>and</strong> according to the tonnage of the vehicle. That is, if the vehicle a trader hires can<br />
carry 32 tons, but the trader only loads 25 tons, s/he will be charged for 32 tons, unless the<br />
transporter is able to find another client to hire the remaining tonnage. (See Appendix, 2 for a<br />
18
detailed calculation of transport running costs <strong>and</strong> a breakdown of the components of<br />
transportation costs).<br />
The second tier of transporters are small transporters. Whereas large transporters charge on a per<br />
ton per km basis, travel on average 500 km, carry large loads, <strong>and</strong> travel on better roads, small<br />
transporters charge per bag, carry smaller loads, <strong>and</strong> travel shorter distances (on average 20 km)<br />
on poorer roads. They operate vehicles with a capacity of up to 16 tons <strong>and</strong> are the main form of<br />
fertilizer transportation within districts in Western Kenya. Small transporters typically own 1 or<br />
2 vehicles, which vary in type from 1-16 ton canters or small trucks, pick-ups, matatus <strong>and</strong><br />
finally, bicycles or “boda-bodas”. The canters <strong>and</strong> pick-ups are normally used to transport<br />
fertilizer from wholesalers to retailers, whereas the matatus are hired by farmers to transport the<br />
fertilizer from the retailer to drop-off points at varying distances from the farmgate. The<br />
remaining distances - ranging from a few hundred meters to several kilometers - are either<br />
covered on foot, or by boda-boda, i.e. bicycle traders that carry up to two 50kg bags at a time. 4<br />
Although two of the importers ship their l<strong>and</strong>ed fertilizer directly from Mombasa to their<br />
godowns <strong>and</strong>/or to customers upcountry, the majority of the wholesalers in cities <strong>and</strong> towns<br />
upcountry (such as Kitale, Eldoret, Webuye, Moi’s Bridge, <strong>and</strong> Matunda) receive their fertilizer<br />
from importers’ godowns in Nairobi.<br />
5. EMPIRICAL ANALYSIS OF THE COMPETITIVENESS OF MARKETING<br />
CHANNELS<br />
A variety of marketing channels existed in the fertilizer subsector in 1999. A particular type of<br />
trader often purchased fertilizer from two or three different types of suppliers <strong>and</strong> sold it to two<br />
or three types of buyers. Figure 6 provides a graphical illustration of the different types of<br />
suppliers <strong>and</strong> buyers that existed for each type of trader in 1999. The channels differed in terms<br />
of their length (number of stages) <strong>and</strong> breadth (number of traders at the same stage of each<br />
channel) which has implications for the competitiveness of the channels.<br />
Moreover, all the wholesalers sampled performed a dual function of retailing directly to farmers,<br />
in addition to selling to retailers. Therefore, retailers who purchased their fertilizer from<br />
wholesalers had to compete with these same wholesalers in the retail market. Presumably,<br />
4 The boda-bodas go where matatus will not go due to the bad condition of the road. Therefore, whether a<br />
road is serviced by a matatu <strong>and</strong> boda-boda, or by boda-boda only is a measure of the quality of the road.<br />
19
Figure 6.<br />
Multiplicity of Marketing Channe ls in the Fe rtiliz e r Subsector<br />
SSW VI<br />
LSW<br />
VI<br />
SSI<br />
LSWSSW<br />
LSI<br />
LSW<br />
VI<br />
LSI<br />
SSI<br />
OVERSEAS<br />
SUPPLIERS<br />
OVERSEAS<br />
SUPPLIERS<br />
OVERSEAS<br />
SUPPLIERS<br />
LSI<br />
SSR<br />
LSR<br />
SSW<br />
LSW SSI LSI<br />
VI<br />
SSR<br />
LSR<br />
SSW<br />
SSR<br />
LSR<br />
LSW<br />
LSR<br />
VI<br />
LSW SSW SSW LSR<br />
SSR<br />
FARMERS<br />
FARMERS<br />
FARMERS<br />
FARMERS<br />
wholesalers performed this dual function to increase their sales. However, this behavior at the<br />
wholesale level may have eroded the net returns <strong>and</strong>/or profit margins at the retail level. Some<br />
retailers purchased their fertilizer directly from importers, by-passing wholesalers completely.<br />
These kinds of behavior suggest that retailers <strong>and</strong> wholesalers are, to some extent, competing for<br />
the same farmers (mostly farmers who have the ability to buy fertilizer in larger volumes <strong>and</strong> in<br />
towns), which most likely increases competition to the benefit of these farmers.<br />
5.1. Specification of Marketing Channels<br />
Each marketing channel has been identified by the transactions that took place between traders at<br />
each stage along the marketing channel as fertilizer traveled from the importer to the farmgate.<br />
For example, in the case of a small-scale importer who sold to a small-scale wholesaler or<br />
directly to a farmer, these two transactions comprise one marketing channel. To delineate the<br />
number of marketing channels by which fertilizer reached the farmgate, traders were asked to<br />
give us information for each transaction which included buying <strong>and</strong> selling price, who they<br />
purchased each consignment from, <strong>and</strong> the location of this supplier. By mapping out the trail of<br />
each transaction for each trader, <strong>and</strong> grouping together the transactions that followed the same<br />
route to the farmgate, all of the different channels that existed in the private sector in 1999 were<br />
delineated based on the penultimate stage before the farmgate. Two marketing channels were<br />
20
Table 7. Marketing Channels for Performance Analysis<br />
Channel: Market Participants Channel Route<br />
Channel 1<br />
Large imported to large wholesaler to large<br />
retailer<br />
Nairobi - Eldoret<br />
Channel 2 Large importer to large retailer Nairobi - Eldoret<br />
Channel 3<br />
Channel 4<br />
Vertically integrated importer/wholesaler to<br />
small wholesaler to small retailer<br />
Large importer to large wholesaler to small<br />
wholesaler to small retailer<br />
Nairobi - Kitale - Matunda<br />
Nairobi - Eldoret - Matunda<br />
identified that had large-scale wholesalers as the penultimate stage; 4 had small-scale<br />
wholesalers; 5 had large-scale retailers; <strong>and</strong> 3 channels had small-scale retailers as the<br />
penultimate stage. Although wholesalers also sell fertilizer to farmers, retailers are the main<br />
suppliers of fertilizer to farmers. Therefore, the performance analysis will focus on four<br />
marketing channels that have retailers as the penultimate stage before the farmgate. These<br />
channels, their marketing participants, <strong>and</strong> the channel route indicating the location of the<br />
traders are depicted in Table 7.<br />
5.2. Cost Build-Ups<br />
A cost build-up is an accounting technique which estimates <strong>and</strong> adds all costs <strong>and</strong> margins at the<br />
various stages of the downstream fertilizer supply channel, from the factory (or, in the case of<br />
Kenya, from the port of export) to the final consumer. The basic approach, normally conducted<br />
at an aggregate level, consists of adding the FOB price to costs such as shipping costs, import<br />
duties, levies, taxes, transport, labor, storage <strong>and</strong> h<strong>and</strong>ling costs, <strong>and</strong> margins. The purpose is,<br />
first, to assess the contribution of various stages in the supply chain to the farm-gate price of<br />
fertilizer paid by farmers. A second objective to identify whether there are some stages or<br />
practices in the supply chain that are unnecessarily inflating costs <strong>and</strong> ultimately borne by<br />
farmers. If such bottlenecks in the supply chain can be identified <strong>and</strong> addressed, it may be<br />
possible to raise the profitability <strong>and</strong> dem<strong>and</strong> for fertilizer. After exploring the structure of costs<br />
in the supply chain through cost build-up analysis, we then examine the effects of potentially<br />
feasible cost-reductions on the profitability of using fertilizer in Section 6. This is done by<br />
conducting sensitivity analysis on the price of fertilizer used in the farm budgets presented in<br />
Section 2.<br />
Cost build-ups were constructed for each of the four marketing channels presented earlier in<br />
Table 7. The cost build-up results are presented in Tables 8.1 to 8.4.<br />
21
Table 8.1. PORT TO FARMGATE COST BUILD-UP FOR DAP FERTILIZER (APRIL, 1999): Channel 1<br />
CHANNEL ROUTE: NAIROBI - ELDORET (UASIN GISHU DISTRICT), CHANNEL 1: LSI - LSD - LSR<br />
CIF LINER IN (BULK). Exchange Rate: Ksh70 = US$1<br />
Kenya Shillings<br />
per 50 kg bag<br />
LARGE-SCALE IMPORTER (NAIROBI) 1<br />
1 Importer buying price = US FOB price in November 1998 2 707<br />
2 Freight rates (from port of Florida November 1998)) 98<br />
3 Insurance (1% of l<strong>and</strong>ed cost of fertilizer) 8<br />
4 CIF price (lines 1+2+3) 813<br />
5 Port charges 84<br />
6 IDF (2.75% of CIF price) 22<br />
7 KBS (.2% of CIF price) 2<br />
8 KARI (1% of CIF price) 8<br />
9 KPA Shore H<strong>and</strong>ling 3 16<br />
10 Misc.KPA charges 1<br />
11 Stevedoring 28<br />
12 Agency Fees (0.8% of CIF price) 7<br />
13<br />
15 Costs incurred at the port 75<br />
16 Bagging 26<br />
17 Bags 12<br />
18 Local transport (to Mombasa warehouse) 23<br />
19 Local h<strong>and</strong>ling charges 14<br />
20<br />
21 Importers Costs ex-Mombasa (line 4+5+21) 972<br />
22 Transport costs to Nairobi (Road) 125<br />
23 Transit losses 8<br />
24 Cost incurred in Nairobi 129<br />
25 Bank (LC) (3% of CIF price) 24<br />
26 H<strong>and</strong>ling Costs (cost of unloading (receiving) <strong>and</strong> loading (selling) fertilizer 6<br />
27 Labor costs to repair torn bag 0<br />
28 Transit losses 8<br />
30 Storage Costs(rent, labor, security, electricity) 23<br />
31 Cost of credit 1<br />
32 Opportunity cost of capital 67<br />
34 Total importers costs (line 21+22+23+24) 1234<br />
35 Importers selling price = wholesaler’s buying price (from survey data) 1300<br />
36 Importers net margin (line 35-34) 66<br />
37 % mark-up of importer 5.08<br />
38<br />
39 LARGE-SCALE WHOLESALER (ELDORET) 4<br />
40 Wholesaler’s buying price (line 35) 1300<br />
22
Table 8.1. PORT TO FARMGATE COST BUILD-UP FOR DAP FERTILIZER (APRIL, 1999): Channel 1, con’t.<br />
41 Operating Costs 138<br />
42 Wholesaler/distributor’s transport costs Nairobi - Eldoret 60<br />
43 H<strong>and</strong>ling Costs (cost of unloading (receiving) <strong>and</strong> loading (selling) fertilizer 6<br />
44 Labor costs to repair torn bag 0<br />
45 Transit losses 8<br />
47 Storage Costs(rent, labor, security, electricity) 10<br />
48 Cost of credit 1<br />
49 Opportunity cost of capital 53<br />
51<br />
Total Wholesalers Costs (lines 40+41) 1438<br />
52 Wholesalers’ selling price (from survey data) 1450<br />
53 Wholesalers’ net margin 12<br />
54 % mark-up of wholesaler 0.83<br />
55<br />
56 LARGE-SCALE RETAILER (ELDORET)<br />
57 Retailer buying price 1450<br />
58 Operating Costs 61<br />
59 Retailer transport costs (from wholesaler) 0<br />
60 H<strong>and</strong>ling Costs (cost of unloading (receiving) <strong>and</strong> loading (selling) fertilizer 4<br />
61 Labor costs to repair torn bag 0<br />
62 Transit losses 30<br />
63 Rebagging 10<br />
65 Storage Costs(rent, labor, security, electricity) 10<br />
66 Cost of credit 4<br />
67 Opportunity cost of capital 3<br />
68<br />
69 Total Retailer Costs (line 57+58) 1511<br />
70 Retailer actual selling price (from survey data) 1550<br />
71 Retailer net margin (line 70-69) 39<br />
72 % mark-up of retailer (line 71/70) 2.52<br />
73 Transport to farmgate (assuming matatu <strong>and</strong> boda-boda used) 80<br />
74 FARMGATE PRICE (line 70+73) 1630<br />
Source: 1999 <strong>Fertilizer</strong> Trader Survey<br />
1 Average number of bags of all types of fertilizer purcahsed per fertilizer trading season = 1,000,000<br />
2<br />
Source: <strong>Fertilizer</strong> Market Bulletin; Bureau of Labor Statistics<br />
3<br />
Shoreh<strong>and</strong>ling includes: unloading from the ship; rebagging; <strong>and</strong> loading onto the trucks. These services are<br />
provided by KPA personnel.<br />
4<br />
Average number of bags of all types of fertilizer purcahsed per fertilizer trading season = 128,000.<br />
5 Average number of bags of all types of fertilizer purcahsed per fertilizer trading season = 1200.<br />
* Supplier delivers when trader purchases at least 100 bags<br />
23
Table 8.2. PORT TO FARMGATE COST BUILD-UP FOR DAP FERTILIZER (APRIL, 1999): CHANNEL 2<br />
CHANNEL ROUTE: NAIROBI - ELDORET (UASIN GISHU DISTRICT)<br />
Kenya Shillings<br />
LARGE-SCALE IMPORTER (NAIROBI) 1<br />
per 50 kg bag<br />
1 Importer buying price = US FOB price in November 1998 2 707<br />
2 Freight rates (from port of Florida November 1998)) 98<br />
3 Insurance (1% of l<strong>and</strong>ed cost of fertilizer) 8<br />
4 CIF price (lines 1 + 2 + 3) 813<br />
5 Port charges (lines 6 to 12) 84<br />
6 IDF (2.75% of CIF price) 22<br />
7 KBS (.2% of CIF price) 2<br />
8 KARI (1% of CIF price) 8<br />
9 KPA Shore H<strong>and</strong>ling 3 16<br />
10 Misc.KPA charges 1<br />
11 Stevedoring 28<br />
12 Agency Fees (0.8% of CIF price) 7<br />
13<br />
15 Costs incurred at the port (lines 16 to 19) 75<br />
16 Bagging 26<br />
17 Bags 12<br />
18 Local transport (to Mombasa warehouse) 23<br />
19 Local h<strong>and</strong>ling charges 14<br />
20<br />
21 Importers Costs ex-Mombasa ( lines 4 + 5 + 15 ) 972<br />
22 Transport costs to Nairobi (Road) 125<br />
23 Transit losses 8<br />
24 Cost incurred in Nairobi (lines 25 to 32) 129<br />
25 Bank (LC) (3% of CIF price) 24<br />
H<strong>and</strong>ling Costs (cost of unloading (receiving) <strong>and</strong> loading (selling)<br />
26 fertilizer 6<br />
27 Labor costs to repair torn bag 0<br />
28 Transit losses 8<br />
30 Storage Costs(rent, labor, security, electricity) 23<br />
31 Cost of credit 1<br />
32 Opportunity cost of capital 67<br />
33<br />
34 Total importers costs (lines 21 + 22 + 23 + 24) 1234<br />
35 Importers selling price = wholesaler’s buying price (from survey data) 1300<br />
36 Importers net margin (line 35 - 34) 66<br />
37 % mark-up of importer (line 36/35) 5.08<br />
55<br />
56 LARGE-SCALE RETAILER (ELDORET)<br />
57 Retailer buying price (line 35) 1300<br />
58 Operating Costs 121<br />
59 Retailer transport costs (from wholesaler) 60<br />
24
Table 8.2. PORT TO FARMGATE COST BUILD-UP FOR DAP FERTILIZER (APRIL, 1999): CHANNEL 2,<br />
con’t.<br />
H<strong>and</strong>ling Costs (cost of unloading (receiving) <strong>and</strong> loading (selling)<br />
60 fertilizer 4<br />
61 Labor costs to repair torn bag 0<br />
62 Transit losses 30<br />
63 Rebagging 10<br />
65 Storage Costs(rent, labor, security, electricity) 10<br />
66 Cost of credit 4<br />
67 Opportunity cost of capital 3<br />
68<br />
69 Total Retailer Costs (line 57+58) 1421<br />
70 Retailer actual selling price (from survey data) 1550<br />
71 Retailer net margin (line 70-69) 129<br />
72 % mark-up of retailer (line 71/58) 9.08<br />
73 Transport to farmgate (assuming matatu <strong>and</strong> boda-boda used) 80<br />
74 FARMGATE PRICE (line 70+73) 1630<br />
Source: 1999 <strong>Fertilizer</strong> Trader Survey<br />
1 Average number of bags of all types of fertilizer purcahsed per fertilizer trading season = 1,000,000<br />
2<br />
Source: <strong>Fertilizer</strong> Market Bulletin; Bureau of Labor Statistics<br />
3<br />
Shoreh<strong>and</strong>ling includes: unloading from the ship; rebagging; <strong>and</strong> loading onto the trucks. These services<br />
are provided by KPA personnel.<br />
4<br />
Average number of bags of all types of fertilizer purcahsed per fertilizer trading season = 128,000.<br />
5 Average number of bags of all types of fertilizer purcahsed per fertilizer trading season = 1200.<br />
* Supplier delivers when trader purchases at least 100 bags<br />
25
TABLE 8.3 PORT TO FARMGATE COST BUILD-UP FOR DAP FERTILIZER (APRIL, 1999): CHANNEL<br />
Channel Route: Nairobi - Eldoret - Matunda (Uasin Gishu District); Exchange Rate: Ksh70 = US$1<br />
Kenya Shillings<br />
VERTICALLY INTEGRATED IMPORTER<br />
per 50kg bag<br />
Operating Costs<br />
1 Importer buying price = US FOB price in November 1998 3 1050<br />
2 Freight rates (from port of Florida November 1998)) 112<br />
3 Insurance (1% of l<strong>and</strong>ed cost of fertilizer) 12<br />
4 CIF price (lines 1-3) 1174<br />
5 Total Port charges (lines 6-12) 101<br />
6 IDF (2.75% of CIF price) 32<br />
7 KBS (.2% of CIF price) 3<br />
8 KARI (1% of CIF price) 12<br />
9 KPA Shore H<strong>and</strong>ling 4 16<br />
10 Misc.KPA charges 1<br />
11 Stevedoring 28<br />
12 Agency Fees (0.8% of CIF price) 9<br />
13<br />
15 Other costs incurred at the port (lines 16-19) 93<br />
16 Bagging 26<br />
17 Bags 12<br />
18 Local transport (to Mombasa warehouse) 23<br />
19 Local h<strong>and</strong>ling charges 32<br />
20<br />
21 Importers Costs ex-Mombasa (lines 4 + 5 + 15) 1368<br />
22 Other importer costs (lines 22 - 32) 309<br />
23 Transport costs to Kitale 175<br />
24 Transit losses 24<br />
25 Bank (LC) (3% of CIF price) 35<br />
26 H<strong>and</strong>ling Costs (cost of unloading (receiving) <strong>and</strong> loading (selling) fertilizer 10<br />
27 Labor costs to repair torn bag 1<br />
30 Storage Costs(rent, labor, security, electricity) 16<br />
31 Cost of credit 0<br />
32 Opportunity cost of capital 48<br />
33<br />
34 Total importers costs (lines 21 + 22) 1677<br />
35 Importers actual selling price = wholesaler’s buying price (from survey data) 1800<br />
36 Importers net margin (lines 35 - 34) 123<br />
37 % mark-up of importer (line 36/35) 6.83<br />
38<br />
39 SMALL-SCALE WHOLESALER<br />
40 Wholesaler’s buying price (line 35) 1800<br />
41 Operating Costs 67<br />
26
TABLE 8.3 PORT TO FARMGATE COST BUILD-UP FOR DAP FERTILIZER (APRIL, 1999): CHANNEL<br />
3, con’t.<br />
42 Wholesaler/distributor’s transport costs Kitale - Matunda 30<br />
43 H<strong>and</strong>ling Costs (cost of unloading (receiving) <strong>and</strong> loading (selling) fertilizer 0<br />
44 Labor costs to repair torn bag 0<br />
45 Transit losses 28<br />
47 Storage Costs(rent, labor, security, electricity) 4<br />
48 Cost of credit 1<br />
49 Opportunity cost of capital 4<br />
50<br />
51 Total Wholesaler Costs (lines 40 + 41) 1867<br />
52 Wholesalers’ actual selling price (from survey data) 1887<br />
53 Wholesalers’ net margin (lines 52 - 51) 20<br />
54 % mark-up of wholesaler (lines 53/53) 1.06<br />
55<br />
56 SMALL-SCALE RETAILER<br />
57 Retailer buying price 1887<br />
58 Operating Costs (lines 59 to 67) 66<br />
59 Retailer transport costs (from wholesaler) 0<br />
60 H<strong>and</strong>ling Costs (cost of unloading (receiving) <strong>and</strong> loading (selling) fertilizer 0<br />
61 Labor costs to repair torn bag 0<br />
62 Transit losses 47<br />
63 Rebagging 10<br />
65 Storage Costs(rent, labor, security, electricity) 8<br />
66 Cost of credit 1<br />
67 Opportunity cost of capital 0<br />
68<br />
69 Total Retailer Costs (lines 57 + 58) 1953<br />
70 Retailer actual selling price (from survey data) 2000<br />
71 Retailer net margin (lines 70 - 69) 47<br />
72 % mark-up of retailer (lines 71 / 70) 2.35<br />
73 Transport to farmgate (assuming matatu <strong>and</strong> boda-boda used) 80<br />
74 FARMGATE PRICE (lines 70 + 73) 2080<br />
Source: 1999 <strong>Fertilizer</strong> Trader Survey<br />
1 Average number of bags of all types of fertilizer purcahsed per fertilizer trading season = 1,000,000<br />
2 Source: <strong>Fertilizer</strong> Market Bulletin; Bureau of Labor Statistics<br />
3 Shoreh<strong>and</strong>ling includes: unloading from the ship; rebagging; <strong>and</strong> loading onto the trucks. These services<br />
are provided by KPA personnel.<br />
4 Average number of bags of all types of fertilizer purcahsed per fertilizer trading season = 128,000.<br />
5 Average number of bags of all types of fertilizer purcahsed per fertilizer trading season = 1200.<br />
* Supplier delivers when trader purchases at least 100 bags<br />
27
TABLE 8.4 PORT TO FARMGATE COST BUILD-UP FOR DAP FERTILIZER (APRIL, 1999): CHANNEL 4<br />
CHANNEL ROUTE: NAIROBI - ELDORET - MATUNDA (TNZ AND UASIN GISHU DISTRICT)<br />
TYPE OF CHANNEL: LSI - LSW - SSW - SSR<br />
Kenya Shillings<br />
LARGE-SCALE IMPORTER (NAIROBI) 1<br />
per 50kg bag<br />
1 Importer buying price = US FOB price in November 1998 2 707<br />
2 Freight rates (from port of Florida November 1998)) 98<br />
3 Insurance (1% of l<strong>and</strong>ed cost of fertilizer) 8<br />
4 CIF price (line 1+2+3) 813<br />
5 Port charges 84<br />
6 IDF (2.75% of CIF price) 22<br />
7 KBS (.2% of CIF price) 2<br />
8 KARI (1% of CIF price) 8<br />
9 KPA Shore H<strong>and</strong>ling 3 16<br />
10 Misc.KPA charges 1<br />
11 Stevedoring 28<br />
12 Agency Fees (0.8% of CIF price) 7<br />
13<br />
15 Costs incurred at the port 75<br />
16 Bagging 26<br />
17 Bags 12<br />
18 Local transport (to Mombasa warehouse) 23<br />
19 Local h<strong>and</strong>ling charges 14<br />
20<br />
21 Importers Costs ex-Mombasa (line 4+5+15) 972<br />
22 Transport costs to Nairobi (Road) 125<br />
23 Transit losses 8<br />
24 Cost incurred in Nairobi 121<br />
25 Bank (LC) (3% of CIF price) 24<br />
H<strong>and</strong>ling Costs (cost of unloading (receiving) <strong>and</strong> loading (selling)<br />
26 fertilizer 6<br />
27 Labor costs to repair torn bag 0<br />
30 Storage Costs(rent, labor, security, electricity) 23<br />
31 Cost of credit 1<br />
32 Opportunity cost of capital 67<br />
33<br />
34 Total importers costs (line 21+22+23+24) 1226<br />
35 Importers selling price = wholesaler’s buying price (from survey data) 1300<br />
36 Importers net margin (line 35-34) 74<br />
37 % mark-up of importer (line 36/35) 5.69<br />
38<br />
39 LARGE-SCALE WHOLESALER (KITALE) 4<br />
28
TABLE 8.4 PORT TO FARMGATE COST BUILD-UP FOR DAP FERTILIZER (APRIL, 1999): CHANNEL 4,<br />
con’t.<br />
40 Wholesaler’s buying price (line 35) 1300<br />
41 Operating Costs 148<br />
42 Wholesaler/distributor’s transport costs Nairobi - Kitale 70<br />
H<strong>and</strong>ling Costs (cost of unloading (receiving) <strong>and</strong> loading (selling)<br />
43 fertilizer 6<br />
44 Labor costs to repair torn bag 0<br />
45 Transit losses 8<br />
47 Storage Costs(rent, labor, security, electricity) 10<br />
48 Cost of credit 1<br />
49 Opportunity cost of capital 53<br />
51<br />
Total Wholesalers Costs 1448<br />
52 Wholesalers’ selling price 1550<br />
53 Wholesalers’ net margin 102<br />
54 % mark-up of large-scale wholesaler (line 53/52) 6.58<br />
SMALL-SCALE WHOLESALER<br />
55 Wholesaler’s buying price 1550<br />
56 Operating Costs 77<br />
57 Wholesaler/distributor’s transport costs Kitale - Matunda 40<br />
H<strong>and</strong>ling Costs (cost of unloading (receiving) <strong>and</strong> loading (selling)<br />
58 fertilizer 0<br />
59 Labor costs to repair torn bag 0<br />
60 Transit losses 28<br />
61 Storage Costs(rent, labor, security, electricity) 4<br />
62 Cost of credit 1<br />
63 Opportunity cost of capital 4<br />
64 Total Wholesaler Costs (line 55+56) 1627<br />
65 Wholesalers’ actual selling price (from survey data) 1650<br />
66 Wholesalers’ net margin (line 65-64) 23<br />
67 % mark-up of large-scale wholesaler (line 66/65) 1.39<br />
SMALL-SCALE RETAILER<br />
68 Retailer buying price 1650<br />
69 Operating Costs 66<br />
70 Retailer transport costs (from wholesaler) 0<br />
H<strong>and</strong>ling Costs (cost of unloading (receiving) <strong>and</strong> loading (selling)<br />
71 fertilizer 0<br />
72 Labor costs to repair torn bag 0<br />
73 Transit losses 47<br />
74 Rebagging 10<br />
75 Storage Costs(rent, labor, security, electricity) 8<br />
29
TABLE 8.4 PORT TO FARMGATE COST BUILD-UP FOR DAP FERTILIZER (APRIL, 1999): CHANNEL 4,<br />
con’t.<br />
76 Cost of credit 1<br />
77 Opportunity cost of capital 0<br />
78<br />
79 Total Retailer Costs (line 68+69) 1716<br />
80 Retailer actual selling price (from survey data) 1850<br />
81 Retailer net margin (line 80-79) 134<br />
82 % mark-up of retailer (line 81/80) 7.24<br />
83 Transport to farmgate (assuming matatu <strong>and</strong> boda-boda used) 80<br />
84 FARMGATE PRICE (line 80+83) 1930<br />
Source: 1999 <strong>Fertilizer</strong> Trader Survey<br />
1 Average number of bags of all types of fertilizer purcahsed per fertilizer trading season = 1,000,000<br />
2<br />
Source: <strong>Fertilizer</strong> Market Bulletin; Bureau of Labor Statistics<br />
3 Shoreh<strong>and</strong>ling includes: unloading from the ship; rebagging; <strong>and</strong> loading onto the trucks. These<br />
services are provided by KPA personnel.<br />
4<br />
Average number of bags of all types of fertilizer purcahsed per fertilizer trading season = 128,000.<br />
5 Average number of bags of all types of fertilizer purcahsed per fertilizer trading season = 1200.<br />
* Supplier delivers when trader purchases at least 100 bags<br />
30
The cost build-ups show several interesting findings. First, there are large differences in the<br />
prices paid by farmers through the four marketing channels. Farm-gate prices for DAP were as<br />
high as 2,080 Ksh per 50kg bag through Channel 3 (the vertically-integrated channel of<br />
importer/wholesaler to small wholesaler to small retailer in Matunda, a small town outside<br />
Kitale). This price was equivalent to $595 per tonne during the survey period (April 1999, 70<br />
Ksh=1 $US). However, Channel 4, which also services farmers in Matunda, was able to make<br />
DAP available at 1,930 Ksh per bag, equivalent to $533 per bag. In the other two Channels (1<br />
<strong>and</strong> 2), which retail DAP from the town center of Kitale <strong>and</strong> therefore face lower transport costs<br />
than the channels serving Matunda, farm-gate prices were both around 1,630 Ksh per bag ($430<br />
to $480 per tonne).<br />
A second important finding is that profit margins for fertilizer traders were all relatively low in<br />
this survey year. Importers’ mark-up margins (the difference between their selling price <strong>and</strong><br />
buying price divided by their buying price) were in the range of 5% to 6% in all four marketing<br />
channels. Wholesalers’ mark-up margins ranged from less than one percent in the case of<br />
Channel 1 to 7% in Channel 4. Retailers’ margins ranged from 2% in the cases of retailers in<br />
Channels 1 <strong>and</strong> 3, up to 9% in Channel 2. Channel 2 is unique in that only two traders were<br />
involved in the domestic supply chain, <strong>and</strong> mark-up margins were relatively high for both agents<br />
in this channel. Apparently they could by-pass the wholesaler stage <strong>and</strong> afford to take a higher<br />
cut as a result <strong>and</strong> still offer a relatively competitive price to farmers.<br />
Third, the generally low mark-up margins of traders indicates that the relatively high price of<br />
DAP fertilizer in western Kenya (when compared to other countries in the region) is due to high<br />
costs incurred in domestic distribution <strong>and</strong> not excessive profits of fertilizer traders. The<br />
relatively low mark-up margins at each stage is consistent with the observation that there appears<br />
to be strong competition in the survey areas at each stage, especially wholesaling <strong>and</strong> retailing.<br />
Fourth, there is also great price risk incurred by these traders. An example of how price risk may<br />
affect the margins of fertilizer traders occurred during the survey recall period in 1999. Two<br />
major importers were unable to import fertilizer because their local bank was having problems<br />
<strong>and</strong> as a result the international bank refused to guarantee their letters of credit. This created a<br />
shortage in the market which another major importer attempted to fill by ordering another<br />
consignment of fertilizer which began to arrive <strong>and</strong> be distributed in March/April. However, in<br />
the interim, there was a severe shortage of fertilizer in Kenya, <strong>and</strong> as a result, wholesalers <strong>and</strong><br />
retailer supplies were constrained <strong>and</strong> prices reached unprecedented levels of up to Ksh2000 in<br />
April 1999.<br />
Fifth, the c.i.f. price of DAP in Mombasa during the survey period was roughly 45% to 55% of<br />
the farm-gate price of DAP in western Kenya. Thus, a major portion of the farm-gate price is<br />
taken up in distributing DAP internally. The internal costs include transportation <strong>and</strong> h<strong>and</strong>ling,<br />
storage <strong>and</strong> interest charges for financing the fertilizer purchases, <strong>and</strong> charges for transit losses,<br />
<strong>and</strong> bagging. Most, if not all of these costs are beyond the control of fertilizer traders<br />
themselves. They hire out for these services <strong>and</strong> must simply absorb them as costs that are then<br />
passed on to the next buyer. Ultimately, farmers pay for these costs. There may be some scope<br />
to reduce these costs through procedures to improve efficiency. For example, traders reported<br />
31
that losses of fertilizer in transit add costs ranging from 38 Ksh per bag in the relatively short<br />
supply chain of Channel 2, to about 95 Ksh per bag in Channels 3 <strong>and</strong> 4. Transit losses were<br />
especially large toward the end of the marketing channel as fertilizer was transported to the<br />
smaller towns in rural areas. Retailers transit losses were on average about 3 times greater per<br />
unit shipped than for importers <strong>and</strong> large wholesalers. These transit loss costs are passed on to<br />
farmers in the form of higher prices. They amount to 3% of the farm-gate price in Channel 2 to<br />
almost 5% of the farm-gate price in Channels 3 <strong>and</strong> 4.<br />
However, the greatest scope for fertilizer cost reduction appears to rest with government, in<br />
terms of investments to reduce transport costs through infrastructure improvement <strong>and</strong> through<br />
reducing the taxes <strong>and</strong> charges incurred at the port of Mombasa. The cost build-ups show that<br />
port fees <strong>and</strong> taxes amount to about 64 Ksh/bag, which contributes about 3% to the retail farmgate<br />
price. Domestic transport costs (not including h<strong>and</strong>ling costs) in each of the supply chains<br />
contribute Ksh 222 <strong>and</strong> 302 per bag in Channels 1 <strong>and</strong> 2, <strong>and</strong> Ksh 285 <strong>and</strong> 315 per bag for<br />
Channels 3 <strong>and</strong> 4, which involve an extra transportation step in bringing the fertilizer from Kitale<br />
to Matunda. Transport costs per km traveled increase greatly toward the end of the supply chain<br />
as fertilizer is transported in smaller units along generally poorer-quality roads.<br />
Also, all of the surveyed traders indicated that they could not transport their fertilizer directly upcountry<br />
from the port of Mombasa but rather needed to transport the goods to a local warehouse<br />
near the port before securing road transport for subsequent movement up-country. This extra<br />
stage involves a 55 ksh per bag addition to transport <strong>and</strong> h<strong>and</strong>ling costs. The Kenya Port<br />
Authority (KPA) also has a stipulation that stevedoring <strong>and</strong> loading onto vehicles at the port can<br />
only be carried out by KPA employees or ‘gangs’ as they are commonly referred to. Moreover,<br />
only certain transporters are licensed to be on h<strong>and</strong> at the port to load <strong>and</strong> transport the fertilizer<br />
outside the port. This extra stage involves a 37 ksh per bag addition to transport <strong>and</strong> h<strong>and</strong>ling<br />
costs. Also, transit losses are incurred with each additional h<strong>and</strong>ling <strong>and</strong> transport stage. The<br />
net effect of these problems is to cause relatively high domestic transport rates per ton/kilometre.<br />
Under the assumption that transport costs <strong>and</strong> port charges could be reduced, in Section 6 we<br />
simulate the effects of a 20% transport cost reduction <strong>and</strong> a waiving of port taxes on the farmgate<br />
price of DAP <strong>and</strong> their implications for the profitability of using DAP on maize by farmers.<br />
6. FARM-BUDGET SIMULATIONS<br />
An important question for agricultural policy is whether there are feasible changes in policies<br />
<strong>and</strong>/or investment strategies that can reduce the farm-gate price of fertilizer. From the farm<br />
budgets for Western Kenya presented in Table 2, Section 1, it can be seen that farmers in the<br />
Trans Nzoia <strong>and</strong> Kakamega/Lugari undertake a number of additional activities in the cultivation<br />
of maize <strong>and</strong> operate with higher production costs per acre than farmers in Bungoma. Therefore,<br />
given similar levels of fertilizer application, fertilizer comprises a higher share of total costs of<br />
producing one acre of maize in Bungoma. Top dressing <strong>and</strong> basal fertilizer comprises 29.7% of<br />
the costs of production in Bungoma, compared to 27.6% in Kakamega/Lugari <strong>and</strong> 17.4% in<br />
Trans Nzoia. Therefore, in medium potential zones like Bungoma, profitability of fertilizer use<br />
may be more sensitive to the price of fertilizer, because it comprises a higher percentage of total<br />
production costs.<br />
32
To test these hypotheses, this section reports results of sensitivity analysis on the price of DAP,<br />
reflecting several scenarios that are envisioned to reduce farm-gate prices. These scenarios are<br />
(1) elimination of government taxes <strong>and</strong> fees charged at the port of Mombasa; (2) better<br />
coordination between port off-loading <strong>and</strong> up-country transport so that the extra step of<br />
transferring fertilizer from the port to local warehouses in Mombasa is avoided; (3) a 20%<br />
reduction in transport costs assumed to result from improvements in road infrastructure; <strong>and</strong> (4)<br />
the combined effects of all three of these sources of cost reduction. For exposition purposes, we<br />
selected the cost structure of Channel 3 as the base case.<br />
The exposition as to how the cost build-ups for Channel 3 are affected by these scenarios is<br />
shown in Appendix 1. Scenario 1 -- the elimination of government taxes <strong>and</strong> fees at the port --<br />
is assumed to reduce the farm-gate price of fertilizer by 64 Ksh per bag. Scenario 2 – the<br />
elimination of the need for storage in Mombasa – is assumed to reduce farm-gate prices by 55<br />
Ksh per bag. In Scenario 3, a 20% decline in transport costs is assumed to reduce farm-gate<br />
prices by 57 Ksh per bag. The combined total cost reduction if all three of these scenarios were<br />
introduced simultaneously (Scenario 4) would be roughly 176 Ksh per bag. These cost<br />
reductions would apply to all fertilizer transported through these supply chains, which include<br />
not only DAP but also top dressing fertilizers such as CAN <strong>and</strong> urea. We then examine the<br />
effects of each of these scenarios on total production costs per acre <strong>and</strong> profit per bag of maize<br />
produced.<br />
The simulation results are presented in Table 9. Costs per acre <strong>and</strong> profit per bag are copied<br />
from Table 2, which are based on the use of 75 kgs of DAP (basal) <strong>and</strong> 100 kgs of CAN (top<br />
dressing) per acre. Under Scenario 1, which reflects the abolition of Mombasa port fees, the<br />
profit per bag of maize increases 11.9% in Bungoma, 6.4% in Lugari, <strong>and</strong> 3.0% in Trans Nzoia.<br />
As mentioned earlier, maize profitability is more sensitive to the price of fertilizer in Bungoma<br />
because under recommended application rates, they form a higher proportion of total production<br />
costs compared to the other districts. While the removal of port taxes would not appreciably<br />
affect maize profitability per bag in areas with high production costs <strong>and</strong> high agronomic<br />
response rates to fertilizer application, such as Trans Nzoia, they appear to have a significant<br />
effect on the profitability of maize production in medium-potential areas such as eastern<br />
Bungoma, other factors constant. The impact on profitability of Scenarios 2 <strong>and</strong> 3 are<br />
comparable to those of Scenario 1.<br />
Over the long run, in which in may be more possible to capture the combined benefits of several<br />
of these scenarios, the implications of reducing marketing cost in the fertilizer supply chains are<br />
very important. As shown in the last row of Table 9, the combined effects of each of the three<br />
individual scenarios are dramatic. Using recommended rates of DAP <strong>and</strong> CAN in Bungoma, the<br />
profit per bag of maize produced increases by 32%, while in Lugari <strong>and</strong> Trans Nzoia, profits per<br />
bag increase by 17.8% <strong>and</strong> 10.5%, respectively.<br />
33
Table 9. Simulated Changes in Maize Profitability From Illustrative Reductions in<br />
<strong>Fertilizer</strong> Marketing Costs, Bungoma, Lugari, <strong>and</strong> Trans Nzoia Districts, 1999.<br />
Scenario Profit Measure Bungoma Lugari Trans<br />
Nzoia<br />
Base Case (as shown in<br />
Table 2):<br />
<strong>Fertilizer</strong> Costs as % of total<br />
production costs per acre:<br />
29.7<br />
27.6<br />
17.4<br />
Cost per acre (Ksh):<br />
Profit per 90kg bag maize (Ksh):<br />
11,607<br />
135<br />
13,567<br />
202<br />
19,870<br />
305<br />
Scenario 1: Remove<br />
Mombasa Port fees 1<br />
Cost per acre (Ksh):<br />
Profit per 90kg bag maize (Ksh):<br />
11,383<br />
151<br />
13,343<br />
215<br />
19,646<br />
314<br />
% increase profit/bag maize<br />
(relative to Base Case):<br />
+11.9<br />
+ 6.4<br />
+ 3.0<br />
Scenario 2: Port-to-upcountry<br />
transport<br />
coordination, obviating need<br />
for transport to warehouse<br />
<strong>and</strong> port storage 2<br />
Cost per acre (Ksh):<br />
Profit per 90kg bag maize (Ksh):<br />
% increase profit/bag maize<br />
(relative to Base Case):<br />
11,415<br />
148<br />
+10.4<br />
13,374<br />
213<br />
+ 5.4<br />
19,678<br />
313<br />
+ 2.6<br />
Scenario 3: 20%<br />
transportation cost reduction 3<br />
Cost per acre (Ksh):<br />
Profit per 90 kg bag maize (Ksh):<br />
11,408<br />
149<br />
13,367<br />
214<br />
19,671<br />
313<br />
% increase profit/bag maize<br />
(relative to Base Case):<br />
+10.5<br />
+5.4<br />
+2.6<br />
Scenario 4: combined<br />
effects of scenarios 1, 2,<br />
<strong>and</strong> 3 4<br />
Cost per acre (Ksh):<br />
Profit per 90 kg bag maize (Ksh):<br />
% increase profit/bag maize<br />
(relative to Base Case):<br />
1 This will result in a reduction of Ksh 64 per 50kg bag of DAP<br />
2<br />
This will result in a cost reduction of Ksh55 per 50kg bag of DAP<br />
3 This will result in a cost reduction of Ksh57 per 50kg bag of DAP<br />
4 This will result in an accumulated cost reduction of Ksh176 per 50kg bag of DAP<br />
10,991<br />
179<br />
+32.6<br />
12,951<br />
238<br />
+17.8<br />
19,080<br />
337<br />
+10.5<br />
These simulation results are likely to underestimate the actual increase in the profitability of<br />
using fertilizer on maize in western Kenya. This is because the simulations are based simply on<br />
benefits from lower fertilizer prices, holding application rates constant. In reality, farmers are<br />
likely to respond to lower fertilizer prices by increasing the quantity applied to maize, other<br />
factors constant. In theory, farmers would increase their use of an input until the marginal cost of<br />
applying an additional kg would equal the marginal value of output produced. While risk<br />
aversion issues are also important to consider, it is likely that the simulation results show a<br />
34
conservative estimate of changes in maize production profitability resulting from the illustrative<br />
reductions in fertilizer marketing costs.<br />
7. CONCLUSION AND POLICY RECOMMENDATIONS<br />
This paper set out to describe <strong>and</strong> analyze how the private sector has organized itself to supply<br />
fertilizer to farmers in Kenya, subsequent to government withdrawal from fertilizer distribution<br />
in 1993. The analysis indicates that DAP fertilizer marketing costs have declined in real terms<br />
over the 1990s. However, the maize/DAP price ratio has also declined over the 1990s. The<br />
decline in the maize/DAP price ratio has been associated with a gradual depreciation of the<br />
Kenyan shilling, which tends to increase the prices of internationally-traded commodities such as<br />
fertilizer relative to commodities such as maize that are primarily locally-traded.<br />
The study also found that overall, fertilizer use has increased by roughly 20% in the 1993-1998<br />
period compared to the 1985-1992 period. There has also been a shift in the composition of<br />
fertilizers used in Kenya, with those used on tea, wheat, <strong>and</strong> horticulture having increased, while<br />
DAP, which is primarily used on maize, has stagnated.<br />
The study also found that numerous types of private sector supply chains have evolved in the<br />
liberalization era. There appears to be strong competition at all stages of the supply chain, with<br />
relatively small mark-up margins being earned at importer <strong>and</strong> wholesaler levels. In the four<br />
supply chains analyzed, importer profit margins for DAP were about 5% to 7% of their selling<br />
price; wholesalers’ mark-up margins were between zero <strong>and</strong> 6%, <strong>and</strong> retailers’ mark-ups were<br />
from 2% to 9%. An examination of the cost structure of the marketing channels, using cost<br />
build-up accounting methods, revealed that port charges, transport costs, <strong>and</strong> transit losses were<br />
major cost components experienced by traders. There is room to reduce these costs by removing<br />
restrictions at the port that stipulate that only Kenya Port Authority-approved ‘gang’s can unload<br />
fertilizer form ships <strong>and</strong> load them onto trucks for transportation, <strong>and</strong> that only certain KPA<br />
approved transporters can be on h<strong>and</strong> to transport the fertilizer out of the port. If the fertilizer<br />
could be loaded directly onto trucks that transported the fertilizer directly upcountry to Nairobi<br />
or Eldoret/Kisumu, this would make unnecessary certain storage <strong>and</strong> transportation charges<br />
incurred at the port. The elimination of such costs would have non-marginal effects on farmlevel<br />
profitability of fertilizer use on maize in some areas in western Kenya, but not others. For<br />
example, the elimination of these extra transport, h<strong>and</strong>ling <strong>and</strong> storage costs at the port would<br />
reduce the per hectare costs of maize production by 10.4% in Bungoma, 5.4% in Lugari, <strong>and</strong> less<br />
than 3% in Trans Nzoia for farmers using recommended rates of DAP <strong>and</strong> CAN application per<br />
acre. If the government eliminated the various port fees <strong>and</strong> levies charged to importers, this<br />
alone would reduce maize production costs by almost 12% in Bungoma <strong>and</strong> by over 6% in<br />
Lugari.<br />
In the long run, it may be more possible to achieve cost reductions in several stages of the supply<br />
chain, <strong>and</strong> the cumulative effects of this on the profitability of maize production would be quite<br />
dramatic. The combination of removing port restrictions, eliminating port fees on fertilizer, <strong>and</strong><br />
reducing transit losses are estimated to increase the profits per bag of maize produced by over<br />
35
30% in Bungoma, 17% in Lugari, <strong>and</strong> close to 10% in Trans Nzoia. This would in turn alleviate<br />
the budget pressures faced by the Government of Kenya in supporting maize prices by the<br />
National Cereals Produce Board, <strong>and</strong> would also make Kenyan maize more competitive vis a vis<br />
the international market <strong>and</strong> neighboring countries. Currently, the government implements an<br />
import tax on maize <strong>and</strong> buys maize from farmers at a high price relative to market conditions in<br />
order to provide farmers with adequate production incentives. The Government of Kenya may<br />
wish to consider how a reduction in port fees on fertilizer might affect costs of domestic maize<br />
production <strong>and</strong> the required support price level needed to maintain the same expected profit<br />
margin per bag of maize produced. The strategy of reducing maize production costs rather than<br />
supporting output prices would also be anticipated to improve the food security position of poor<br />
urban consumers <strong>and</strong> rural households in maize-purchasing regions.<br />
36
APPENDIX A<br />
37
APPENDIX A. COST-REDUCTION SCENARIOS, FARMGATE COST BUILD-UPS FOR DAP FERTILIZER (APRIL, 1999)<br />
SIMULATION BASED ON CHANNEL 3 BASE CASE<br />
VERTICALLY INTEGRATED IMPORTER Base Case Eliminate<br />
Port Fees<br />
---------- All figures are in Kenya Shillings per 50kg Bag ----------<br />
Scenario 1: Sceario 2: Scenario 3: Scenario 4:<br />
Eliminate<br />
Need for<br />
Port<br />
Storage<br />
20%<br />
Reduction<br />
in<br />
Transport<br />
Cost<br />
Combined<br />
Effects<br />
of<br />
Scenarios<br />
1, 2, <strong>and</strong> 3<br />
Operating Costs<br />
1 Importer buying price = US FOB price in November 1998 3 1050 1050 1050 1050 1050<br />
2 Freight rates (from port of Florida November 1998)) 112 112 112 112 112<br />
3 Insurance (1% of l<strong>and</strong>ed cost of fertilizer) 12 12 12 12 12<br />
4 CIF price (lines 1-3) 1174 1174 1174 1174 1174<br />
5 Total Port charges (lines 6-12) 101 37 101 101 37<br />
6 IDF (2.75% of CIF price) 32 0 32 32 0<br />
7 KBS (.2% of CIF price) 3 0 3 3 0<br />
8 KARI (1% of CIF price) 12 0 12 12 0<br />
9 KPA Shore H<strong>and</strong>ling 4 16 0 16 16 0<br />
10 Misc.KPA charges 1 0 1 1 0<br />
11 Stevedoring 28 28 28 28 28<br />
12 Agency Fees (0.8% of CIF price) 9 9 9 9 9<br />
13<br />
15 Other costs incurred at the port (lines 16-19) 93 93 38 93 38<br />
16 Bagging 26 26 26 26 26<br />
17 Bags 12 12 12 12 12<br />
18 Local transport (to Mombasa warehouse) 23 23 0 18.4 0<br />
19 Local h<strong>and</strong>ling charges 32 32 0 32 0<br />
20<br />
21 Importers Costs ex-Mombasa (lines 4 + 5 + 15) 1368 1304 1313 138 1249<br />
38
APPENDIX A. COST-REDUCTION SCENARIOS, FARMGATE COST BUILD-UPS FOR DAP FERTILIZER (APRIL, 1999), con’t.<br />
22 Other importer costs (lines 22 - 32) 309 309 309 274 274<br />
23 Transport costs to Kitale 175 175 175 140 140<br />
24 Transit losses 24 24 24 24 24<br />
25 Bank (LC) (3% of CIF price) 35 35 35 35 35<br />
26 H<strong>and</strong>ling Costs (unloading, loading) 10 10 10 10 10<br />
27 Labor costs to repair torn bag 1 1 1 1 1<br />
30 Storage Costs(rent, labor, security, electricity) 16 16 16 16 16<br />
31 Cost of credit 0 0 0 0 0<br />
32 Opportunity cost of capital 48 48 48 48 48<br />
33<br />
34 Total importers costs (lines 21 + 22) 1677 1613 1622 1642 1523<br />
35 Importers actual selling price = wholesaler’s buying price 1800 1736 1745 1765 1646<br />
36 Importers net margin (lines 35 - 34) 123 123 123 123 123<br />
37 % mark-up of importer (line 36/35) 6.83 7.09 7.05 6.97 7.47<br />
38<br />
39 SMALL-SCALE WHOLESALER<br />
40 Wholesaler’s buying price (line 35) 1800 1736 1745 1765 1646<br />
41 Operating Costs 67 67 67 61 61<br />
42 Wholesaler/distributor’s transport costs Kitale - Matunda 30 30 30 24 24<br />
43 H<strong>and</strong>ling Costs (unloading, loading) 0 0 0 0 0<br />
44 Labor costs to repair torn bag 0 0 0 0 0<br />
45 Transit losses 28 28 28 28 28<br />
47 Storage Costs(rent, labor, security, electricity) 4 4 4 4 4<br />
48 Cost of credit 1 1 1 1 1<br />
49 Opportunity cost of capital 4 4 4 4 4<br />
50<br />
51 Total Wholesaler Costs (lines 40 + 41) 1867 1803 1812 1826 1707<br />
52 Wholesalers’ actual selling price (from survey data) 1887 1823 1832 1846 1727<br />
53 Wholesalers’ net margin (lines 52 - 51) 20 20 20 20 20<br />
54 % mark-up of wholesaler (lines 53/53) 1.06 1.10 1.09 1.08 1.16<br />
39
APPENDIX A. COST-REDUCTION SCENARIOS, FARMGATE COST BUILD-UPS FOR DAP FERTILIZER (APRIL, 1999), con’t.<br />
55<br />
56 SMALL-SCALE RETAILER<br />
57 Retailer buying price 1887 1823 1832 1846 1727<br />
58 Operating Costs (lines 59 to 67) 66 66 66 66 66<br />
59 Retailer transport costs (from wholesaler) 0 0 0 0 0<br />
60 H<strong>and</strong>ling Costs (unloading, loading) 0 0 0 0 0<br />
61 Labor costs to repair torn bag 0 0 0 0 0<br />
62 Transit losses 47 47 47 47 47<br />
63 Rebagging 10 10 10 10 10<br />
65 Storage Costs(rent, labor, security, electricity) 8 8 8 8 8<br />
66 Cost of credit 1 1 1 1 1<br />
67 Opportunity cost of capital 0 0 0 0 0<br />
68<br />
69 Total Retailer Costs (lines 57 + 58) 1953 1889 1898 1912 1793<br />
70 Retailer actual selling price (from survey data) 2000 1936 1945 1959 1840<br />
71 Retailer net margin (lines 70 - 69) 47 47 47 47 47<br />
72 % mark-up of retailer (lines 71 / 70) 2.35 2.43 2.42 2.40 2.55<br />
73<br />
Transport to farmgate (assuming matatu <strong>and</strong> boda-boda<br />
used) 80 80 80 64 64<br />
74 FARMGATE PRICE (lines 70 + 73) 2080 2016 2025 2023 1904<br />
Source: 1999 <strong>Fertilizer</strong> Trader Survey<br />
1 Average number of bags of all types of fertilizer purcahsed per fertilizer trading season = 1,000,000<br />
2 Average number of bags of all types of fertilizer purcahsed per fertilizer trading season = 300,000<br />
3<br />
Source: <strong>Fertilizer</strong> Market Bulletin; Bureau of Labor Statistics<br />
4<br />
Shoreh<strong>and</strong>ling includes: unloading from the ship; rebagging; <strong>and</strong> loading onto the trucks. These services are provided by KPA personnel.<br />
40
REFERENCES<br />
Allgood, J.H., <strong>and</strong> J. Kilungu. 1996. An Appraisal of the <strong>Fertilizer</strong> Market in Kenya <strong>and</strong><br />
Recommendations for Improving <strong>Fertilizer</strong> Use Practices by Smallholder Farmers: A Field<br />
Report. Muscle Shoals, AL: International <strong>Fertilizer</strong> Development Center.<br />
Arwings-Kodhek, G. 1996. The Impacts of <strong>Fertilizer</strong> Market Liberalization in Kenya. Nairobi:<br />
Policy Analysis Matrix Project of the Kenya Marketing Development Programme. Project<br />
Mimeo.<br />
Arwings-Kodhek, G. 1997. Factors Constraining <strong>Fertilizer</strong> Use in Kenya. Egerton University<br />
<strong>Tegemeo</strong> Institute of <strong>Agricultural</strong> Policy <strong>and</strong> Development unpublished working paper. Nairobi:<br />
<strong>Tegemeo</strong> Institute Egerton University.<br />
Arwings-Kodhek, G. 1999. Policy Issues Facing the Maize Sector in the North Rift. Background<br />
Document for the Maize <strong>and</strong> Wheat Stakeholder Consultation. Nairobi: <strong>Tegemeo</strong> Institute of<br />
<strong>Agricultural</strong> Policy <strong>and</strong> Development.<br />
Arwings-Kodhek, G., S.W. Omamo, F. Karin, <strong>and</strong> G. Okumu. 1991. <strong>Fertilizer</strong> Marketing in<br />
Kenya. Project Policy Analysis Matrix - Kenya Marketing Development Programme. Policy<br />
Analysis Matrix Project. Nairobi: Egerton University.<br />
Awuor, T. 2001. Competitiveness of Maize from Eastern Ug<strong>and</strong>a <strong>and</strong> Western Kenya in Kisumu<br />
Town of Kenya. Master’s Thesis, Michigan State University.<br />
Dembele, N.N. 1996. Implications of Market Reform for <strong>Fertilizer</strong> Technology Development<br />
<strong>and</strong> Implementation in Sub-Saharan Africa with Special Reference to the Soil <strong>Fertilizer</strong><br />
Management Initiative in Burkina Faso. Muscle Shoals, AL: International <strong>Fertilizer</strong><br />
Development Center.<br />
Demeke, M., V. Kelly, T.S. Jayne, A. Said, J.C. Le Vallee, <strong>and</strong> H. Chen. 1998. <strong>Agricultural</strong><br />
Market Performance <strong>and</strong> Determinants of <strong>Fertilizer</strong> Use in Ethiopia. Grain Market Research<br />
Project Working Paper No. 10. Addis Ababa, Ethiopia: Ministry of Economic Development <strong>and</strong><br />
Cooperation.<br />
Economic Review. 1999. November. Nairobi: Commercial Bank of Kenya.<br />
FAO. 1997. <strong>Fertilizer</strong> Yearbook. Rome.<br />
<strong>Fertilizer</strong> Extension Project. 1999. Ministry of Agriculture. Nairobi: Ministry of Agriculture.<br />
Karanja, Daniel, T.S. Jayne, <strong>and</strong> Paul Strasberg. 1999. Determinants of Input Use <strong>and</strong> Maize<br />
Productivity in Kenya: Implications of Cereal Market Reform. In Kenya <strong>Agricultural</strong> Monitoring<br />
<strong>and</strong> Policy Analysis, Conference Proceedings, ed. T.S. Jayne, W. Nguyo, <strong>and</strong> J. Keel. Nairobi:<br />
<strong>Tegemeo</strong> Institute of <strong>Agricultural</strong> Policy <strong>and</strong> Development/Egerton University.<br />
41
Koch, J. 1980. Industrial Organization <strong>and</strong> Prices. Saddle Brook, NJ: Prentice-Hall Inc.<br />
Kohls, R.L., <strong>and</strong> J.N. Uhl. 1998. Marketing of <strong>Agricultural</strong> Products. Saddle Brook, NJ:<br />
Prentice-Hall Inc.<br />
Mose, L.O. 1997. Factors Affecting the Distribution <strong>and</strong> Use of <strong>Fertilizer</strong> in Kenya: A<br />
Preliminary Assessment. In Kenya <strong>Agricultural</strong> Monitoring <strong>and</strong> Policy Analysis, Conference<br />
Proceedings, ed. T.S. Jayne, W. Nguyo, <strong>and</strong> J. Keel. Nairobi: <strong>Tegemeo</strong> Institute of <strong>Agricultural</strong><br />
Policy <strong>and</strong> Development/Egerton University.<br />
Nyambane, G. 2001. Relative Profitability of Alternative Crops in Kenya: Implications for<br />
Maize Pricing <strong>and</strong> Trade Policy. Master’s Thesis, Michigan State University.<br />
Nyoro, J.K., M.W. Kiiru, <strong>and</strong> T.S. Jayne. 1999. Evolution of Kenya’s Maize Marketing Systems<br />
in the Post-Liberalization Era. Paper presented at the 4 th <strong>Agricultural</strong> Transformation Workshop<br />
held in Nairobi, 27-30 June. Nairobi, Kenya.<br />
Omamo, S.W. 1996. <strong>Fertilizer</strong> Trade Under Market Liberalization: The Case of Njoro Division,<br />
Nakuru District, Kenya. Research Report Prepared for the Rockefeller Foundation, Nairobi<br />
Office. Nairobi, Kenya.<br />
Omamo, S.W. 1998a. Farm-to-Market Transaction Costs <strong>and</strong> Specialization in Small-Scale<br />
Agriculture: Explorations with a Nonseparable Household Model. Journal of Development<br />
Studies 35.2: 152-63.<br />
Omamo, S.W. 1998b. Transport Costs <strong>and</strong> Smallholder Cropping Choices: An Application to<br />
Siaya District, Kenya. American Journal of <strong>Agricultural</strong> Economics 80.1: 116-23.<br />
Scarborough, V., <strong>and</strong> J. Kydd. 1992. Economic Analysis of <strong>Agricultural</strong> <strong>Markets</strong>: A Manual.<br />
Chatham, U.K.: Natural Resources Institute.<br />
Statistical Abstract. Various Years. Statistical Abstract of Kenya. Nairobi: Government Printer.<br />
42