Improving Kenya's Domestic Horticultural Production and Marketing
Improving Kenya's Domestic Horticultural Production and Marketing
Improving Kenya's Domestic Horticultural Production and Marketing

Create successful ePaper yourself
Turn your PDF publications into a flip-book with our unique Google optimized e-Paper software.
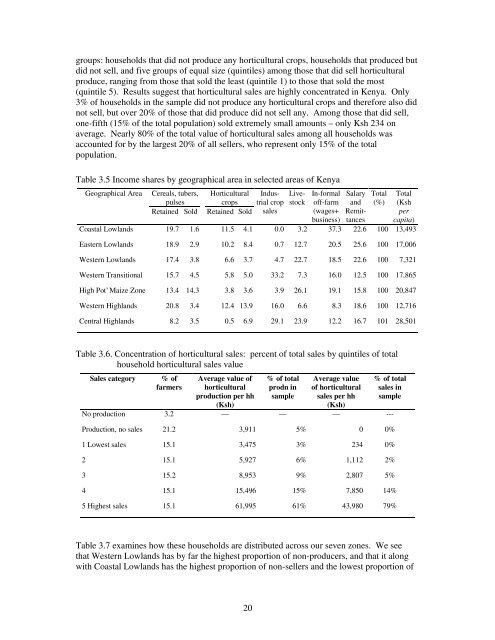
groups: households that did not produce any horticultural crops, households that produced but<br />
did not sell, <strong>and</strong> five groups of equal size (quintiles) among those that did sell horticultural<br />
produce, ranging from those that sold the least (quintile 1) to those that sold the most<br />
(quintile 5). Results suggest that horticultural sales are highly concentrated in Kenya. Only<br />
3% of households in the sample did not produce any horticultural crops <strong>and</strong> therefore also did<br />
not sell, but over 20% of those that did produce did not sell any. Among those that did sell,<br />
one-fifth (15% of the total population) sold extremely small amounts – only Ksh 234 on<br />
average. Nearly 80% of the total value of horticultural sales among all households was<br />
accounted for by the largest 20% of all sellers, who represent only 15% of the total<br />
population.<br />
Table 3.5 Income shares by geographical area in selected areas of Kenya<br />
Geographical Area Cereals, tubers, <strong>Horticultural</strong> IndusLive- In-formal Salary Total Total<br />
pulses crops trial crop stock off-farm <strong>and</strong> (%) (Ksh<br />
Retained Sold Retained Sold sales (wages+ Remit- per<br />
business) tances capita)<br />
Coastal Lowl<strong>and</strong>s 19.7 1.6 11.5 4.1 0.0 3.2 37.3 22.6 100 13,493<br />
Eastern Lowl<strong>and</strong>s 18.9 2.9 10.2 8.4 0.7 12.7 20.5 25.6 100 17,006<br />
Western Lowl<strong>and</strong>s 17.4 3.8 6.6 3.7 4.7 22.7 18.5 22.6 100 7,321<br />
Western Transitional 15.7 4.5 5.8 5.0 33.2 7.3 16.0 12.5 100 17,865<br />
High Pot’ Maize Zone 13.4 14.3 3.8 3.6 3.9 26.1 19.1 15.8 100 20,847<br />
Western Highl<strong>and</strong>s 20.8 3.4 12.4 13.9 16.0 6.6 8.3 18.6 100 12,716<br />
Central Highl<strong>and</strong>s 8.2 3.5 0.5 6.9 29.1 23.9 12.2 16.7 101 28,501<br />
Table 3.6. Concentration of horticultural sales: percent of total sales by quintiles of total<br />
household horticultural sales value<br />
Sales category % of<br />
farmers<br />
Average value of<br />
horticultural<br />
production per hh<br />
(Ksh)<br />
20<br />
% of total<br />
prodn in<br />
sample<br />
Average value<br />
of horticultural<br />
sales per hh<br />
(Ksh)<br />
% of total<br />
sales in<br />
sample<br />
No production 3.2 — — — ---<br />
<strong>Production</strong>, no sales 21.2 3,911 5% 0 0%<br />
1 Lowest sales 15.1 3,475 3% 234 0%<br />
2 15.1 5,927 6% 1,112 2%<br />
3 15.2 8,953 9% 2,807 5%<br />
4 15.1 15,496 15% 7,850 14%<br />
5 Highest sales 15.1 61,995 61% 43,980 79%<br />
Table 3.7 examines how these households are distributed across our seven zones. We see<br />
that Western Lowl<strong>and</strong>s has by far the highest proportion of non-producers, <strong>and</strong> that it along<br />
with Coastal Lowl<strong>and</strong>s has the highest proportion of non-sellers <strong>and</strong> the lowest proportion of