Improving Kenya's Domestic Horticultural Production and Marketing
Improving Kenya's Domestic Horticultural Production and Marketing
Improving Kenya's Domestic Horticultural Production and Marketing

Create successful ePaper yourself
Turn your PDF publications into a flip-book with our unique Google optimized e-Paper software.
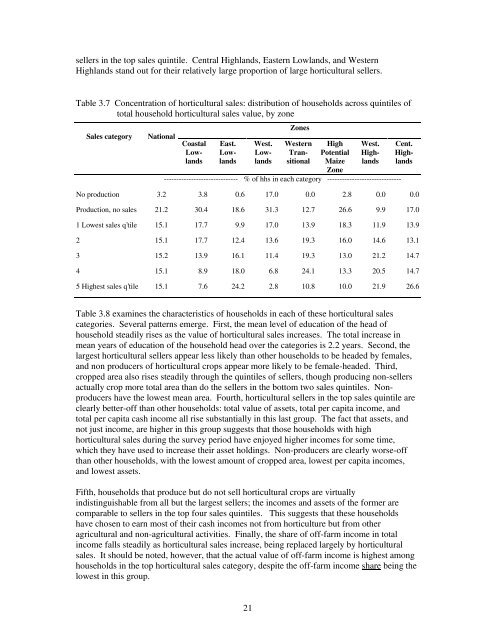
sellers in the top sales quintile. Central Highl<strong>and</strong>s, Eastern Lowl<strong>and</strong>s, <strong>and</strong> Western<br />
Highl<strong>and</strong>s st<strong>and</strong> out for their relatively large proportion of large horticultural sellers.<br />
Table 3.7 Concentration of horticultural sales: distribution of households across quintiles of<br />
total household horticultural sales value, by zone<br />
Sales category<br />
National Coastal<br />
Lowl<strong>and</strong>s<br />
East.<br />
Lowl<strong>and</strong>s<br />
21<br />
West.<br />
Lowl<strong>and</strong>s<br />
Zones<br />
Western<br />
Transitional<br />
High<br />
Potential<br />
Maize<br />
Zone<br />
West.<br />
Highl<strong>and</strong>s<br />
------------------------------ % of hhs in each category ------------------------------<br />
Cent.<br />
Highl<strong>and</strong>s<br />
No production 3.2 3.8 0.6 17.0 0.0 2.8 0.0 0.0<br />
<strong>Production</strong>, no sales 21.2 30.4 18.6 31.3 12.7 26.6 9.9 17.0<br />
1 Lowest sales q’tile 15.1 17.7 9.9 17.0 13.9 18.3 11.9 13.9<br />
2 15.1 17.7 12.4 13.6 19.3 16.0 14.6 13.1<br />
3 15.2 13.9 16.1 11.4 19.3 13.0 21.2 14.7<br />
4 15.1 8.9 18.0 6.8 24.1 13.3 20.5 14.7<br />
5 Highest sales q’tile 15.1 7.6 24.2 2.8 10.8 10.0 21.9 26.6<br />
Table 3.8 examines the characteristics of households in each of these horticultural sales<br />
categories. Several patterns emerge. First, the mean level of education of the head of<br />
household steadily rises as the value of horticultural sales increases. The total increase in<br />
mean years of education of the household head over the categories is 2.2 years. Second, the<br />
largest horticultural sellers appear less likely than other households to be headed by females,<br />
<strong>and</strong> non producers of horticultural crops appear more likely to be female-headed. Third,<br />
cropped area also rises steadily through the quintiles of sellers, though producing non-sellers<br />
actually crop more total area than do the sellers in the bottom two sales quintiles. Nonproducers<br />
have the lowest mean area. Fourth, horticultural sellers in the top sales quintile are<br />
clearly better-off than other households: total value of assets, total per capita income, <strong>and</strong><br />
total per capita cash income all rise substantially in this last group. The fact that assets, <strong>and</strong><br />
not just income, are higher in this group suggests that those households with high<br />
horticultural sales during the survey period have enjoyed higher incomes for some time,<br />
which they have used to increase their asset holdings. Non-producers are clearly worse-off<br />
than other households, with the lowest amount of cropped area, lowest per capita incomes,<br />
<strong>and</strong> lowest assets.<br />
Fifth, households that produce but do not sell horticultural crops are virtually<br />
indistinguishable from all but the largest sellers; the incomes <strong>and</strong> assets of the former are<br />
comparable to sellers in the top four sales quintiles. This suggests that these households<br />
have chosen to earn most of their cash incomes not from horticulture but from other<br />
agricultural <strong>and</strong> non-agricultural activities. Finally, the share of off-farm income in total<br />
income falls steadily as horticultural sales increase, being replaced largely by horticultural<br />
sales. It should be noted, however, that the actual value of off-farm income is highest among<br />
households in the top horticultural sales category, despite the off-farm income share being the<br />
lowest in this group.