Improving Kenya's Domestic Horticultural Production and Marketing
Improving Kenya's Domestic Horticultural Production and Marketing
Improving Kenya's Domestic Horticultural Production and Marketing

You also want an ePaper? Increase the reach of your titles
YUMPU automatically turns print PDFs into web optimized ePapers that Google loves.
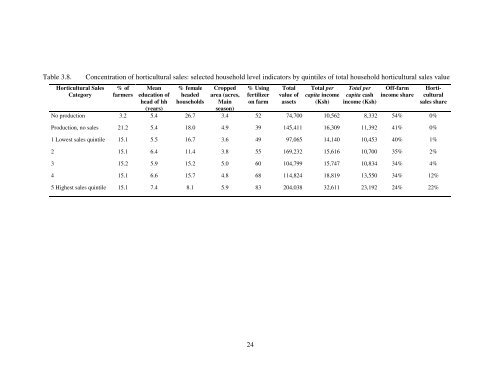
Table 3.8. Concentration of horticultural sales: selected household level indicators by quintiles of total household horticultural sales value<br />
<strong>Horticultural</strong> Sales<br />
Category<br />
% of<br />
farmers<br />
Mean<br />
education of<br />
head of hh<br />
(years)<br />
% female<br />
headed<br />
households<br />
Cropped<br />
area (acres,<br />
Main<br />
season)<br />
% Using<br />
fertilizer<br />
on farm<br />
24<br />
Total<br />
value of<br />
assets<br />
Total per<br />
capita income<br />
(Ksh)<br />
Total per<br />
capita cash<br />
income (Ksh)<br />
Off-farm<br />
income share<br />
No production 3.2 5.4 26.7 3.4 52 74,700 10,562 8,332 54% 0%<br />
<strong>Production</strong>, no sales 21.2 5.4 18.0 4.9 39 145,411 16,309 11,392 41% 0%<br />
1 Lowest sales quintile 15.1 5.5 16.7 3.6 49 97,065 14,140 10,453 40% 1%<br />
2 15.1 6.4 11.4 3.8 55 169,232 15,616 10,700 35% 2%<br />
3 15.2 5.9 15.2 5.0 60 104,799 15,747 10,834 34% 4%<br />
<strong>Horticultural</strong><br />
sales share<br />
4 15.1 6.6 15.7 4.8 68 114,824 18,819 13,550 34% 12%<br />
5 Highest sales quintile 15.1 7.4 8.1 5.9 83 204,038 32,611 23,192 24% 22%