Improving Kenya's Domestic Horticultural Production and Marketing
Improving Kenya's Domestic Horticultural Production and Marketing
Improving Kenya's Domestic Horticultural Production and Marketing
Create successful ePaper yourself
Turn your PDF publications into a flip-book with our unique Google optimized e-Paper software.
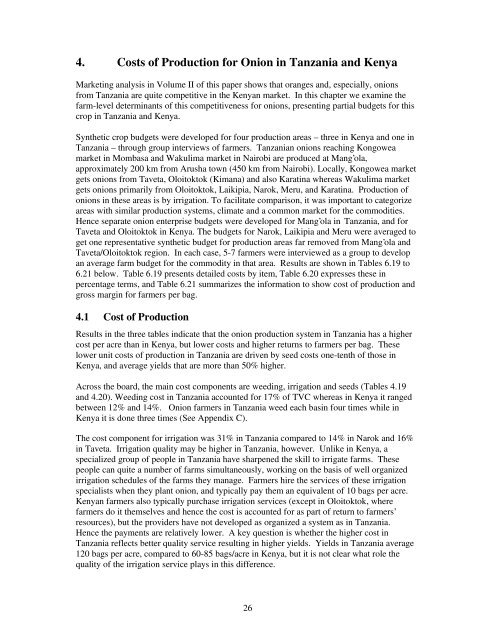
4. Costs of <strong>Production</strong> for Onion in Tanzania <strong>and</strong> Kenya<br />
<strong>Marketing</strong> analysis in Volume II of this paper shows that oranges <strong>and</strong>, especially, onions<br />
from Tanzania are quite competitive in the Kenyan market. In this chapter we examine the<br />
farm-level determinants of this competitiveness for onions, presenting partial budgets for this<br />
crop in Tanzania <strong>and</strong> Kenya.<br />
Synthetic crop budgets were developed for four production areas – three in Kenya <strong>and</strong> one in<br />
Tanzania – through group interviews of farmers. Tanzanian onions reaching Kongowea<br />
market in Mombasa <strong>and</strong> Wakulima market in Nairobi are produced at Mang’ola,<br />
approximately 200 km from Arusha town (450 km from Nairobi). Locally, Kongowea market<br />
gets onions from Taveta, Oloitoktok (Kimana) <strong>and</strong> also Karatina whereas Wakulima market<br />
gets onions primarily from Oloitoktok, Laikipia, Narok, Meru, <strong>and</strong> Karatina. <strong>Production</strong> of<br />
onions in these areas is by irrigation. To facilitate comparison, it was important to categorize<br />
areas with similar production systems, climate <strong>and</strong> a common market for the commodities.<br />
Hence separate onion enterprise budgets were developed for Mang’ola in Tanzania, <strong>and</strong> for<br />
Taveta <strong>and</strong> Oloitoktok in Kenya. The budgets for Narok, Laikipia <strong>and</strong> Meru were averaged to<br />
get one representative synthetic budget for production areas far removed from Mang’ola <strong>and</strong><br />
Taveta/Oloitoktok region. In each case, 5-7 farmers were interviewed as a group to develop<br />
an average farm budget for the commodity in that area. Results are shown in Tables 6.19 to<br />
6.21 below. Table 6.19 presents detailed costs by item, Table 6.20 expresses these in<br />
percentage terms, <strong>and</strong> Table 6.21 summarizes the information to show cost of production <strong>and</strong><br />
gross margin for farmers per bag.<br />
4.1 Cost of <strong>Production</strong><br />
Results in the three tables indicate that the onion production system in Tanzania has a higher<br />
cost per acre than in Kenya, but lower costs <strong>and</strong> higher returns to farmers per bag. These<br />
lower unit costs of production in Tanzania are driven by seed costs one-tenth of those in<br />
Kenya, <strong>and</strong> average yields that are more than 50% higher.<br />
Across the board, the main cost components are weeding, irrigation <strong>and</strong> seeds (Tables 4.19<br />
<strong>and</strong> 4.20). Weeding cost in Tanzania accounted for 17% of TVC whereas in Kenya it ranged<br />
between 12% <strong>and</strong> 14%. Onion farmers in Tanzania weed each basin four times while in<br />
Kenya it is done three times (See Appendix C).<br />
The cost component for irrigation was 31% in Tanzania compared to 14% in Narok <strong>and</strong> 16%<br />
in Taveta. Irrigation quality may be higher in Tanzania, however. Unlike in Kenya, a<br />
specialized group of people in Tanzania have sharpened the skill to irrigate farms. These<br />
people can quite a number of farms simultaneously, working on the basis of well organized<br />
irrigation schedules of the farms they manage. Farmers hire the services of these irrigation<br />
specialists when they plant onion, <strong>and</strong> typically pay them an equivalent of 10 bags per acre.<br />
Kenyan farmers also typically purchase irrigation services (except in Oloitoktok, where<br />
farmers do it themselves <strong>and</strong> hence the cost is accounted for as part of return to farmers’<br />
resources), but the providers have not developed as organized a system as in Tanzania.<br />
Hence the payments are relatively lower. A key question is whether the higher cost in<br />
Tanzania reflects better quality service resulting in higher yields. Yields in Tanzania average<br />
120 bags per acre, compared to 60-85 bags/acre in Kenya, but it is not clear what role the<br />
quality of the irrigation service plays in this difference.<br />
26


