MARUI CO., LTD.
MARUI CO., LTD.
MARUI CO., LTD.

You also want an ePaper? Increase the reach of your titles
YUMPU automatically turns print PDFs into web optimized ePapers that Google loves.
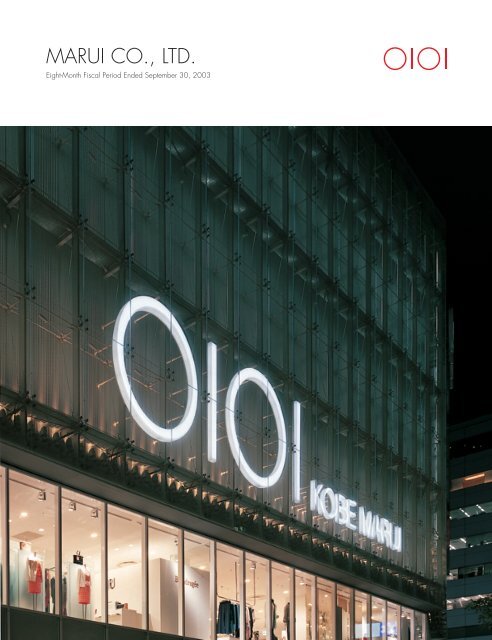
<strong>MARUI</strong> <strong>CO</strong>., <strong>LTD</strong>.<br />
Eight-Month Fiscal Period Ended September 30, 2003
FINANCIAL HIGHLIGHTS<br />
Marui Co., Ltd. and Its Consolidated Subsidiaries<br />
Eight months ended September 30, 2003, and years ended January 31, 2003 and 2002<br />
Thousands of United<br />
Millions of yen except<br />
States dollars except<br />
net income per share*<br />
net income per share**<br />
2003/9*** 2003/1 2002/1 2003/9<br />
Operating results:<br />
Operating revenues......................................................... ¥353,408 ¥558,867 ¥551,564 $3,183,856<br />
Merchandise sales........................................................ 273,608 443,933 443,358 2,464,937<br />
Interest income on consumer loans ............................ 36,558 53,500 46,324 329,351<br />
Operating income ........................................................... 16,009 34,317 32,929 144,225<br />
Ordinary income............................................................. 16,414 33,938 33,059 147,874<br />
Net income...................................................................... 6,154 17,620 14,910 55,441<br />
Net income per share (Yen and dollars):****<br />
Basic............................................................................. ¥17 ¥48 ¥40 $0.15<br />
Diluted......................................................................... 17 45 38 0.15<br />
Financial position:<br />
Working capital .............................................................. ¥232,776 ¥263,802 ¥213,289 $2,097,082<br />
Stockholders’ equity........................................................ 414,456 425,641 424,400 3,733,838<br />
Total assets...................................................................... 734,157 729,901 743,791 6,614,027<br />
* All yen figures in this annual report are represented based on accounting principles generally accepted in Japan.<br />
** All dollar figures in this annual report refer to U.S. currency. Yen amounts have been translated, for convenience only, at the rate of ¥111 to US$1.<br />
*** The fiscal period ended September 30, 2003, consists of the eight months from February 1, 2003, to September 30, 2003, because of the change<br />
**** of the year-end.<br />
**** See Note 2 of the notes to consolidated financial statements.<br />
Note on Irregular Accounting Periods<br />
Marui Co., Ltd., has changed its fiscal year-end from January 31 to<br />
March 31. During this transitional term, the Company will use<br />
irregular accounting periods of eight months and six months,<br />
respectively. The fiscal period reviewed in this report is from<br />
February 1, 2003, to September 30, 2003, while the current fiscal<br />
period is from October 1, 2003, to March 31, 2004. Consequently,<br />
performance comparisons of the fiscal period under review and the<br />
previous fiscal year have not been included.<br />
Forward-Looking Statements<br />
This report includes certain “forward-looking statements”. These<br />
statements are based on management’s current expectations and are<br />
subject to uncertainty and changes in circumstances. Actual results<br />
may differ due to changes in economic, business, competitive, technological,<br />
regulatory and other factors.<br />
Cover: Kobe Marui (Opened in October 2003)<br />
Contents<br />
Corporate Profile............................................................... 1<br />
To Our Stockholders and Friends ..................................... 2<br />
Enhancing the Marui Brand ............................................. 5<br />
Financial Review .............................................................. 10<br />
Consolidated Five-Year Summary ..................................... 12<br />
Non-Consolidated Five-Year Summary............................. 13<br />
Consolidated Financial Statements ................................... 14<br />
Notes to Consolidated Financial Statements..................... 19<br />
Independent Auditors’ Report .......................................... 27<br />
Store Information .............................................................. 28<br />
Marui Group Companies................................................... 30<br />
Board of Directors ............................................................. 32<br />
Corporate Data/Investor Information............................... 33<br />
c2
ENHANCING THE <strong>MARUI</strong> BRAND<br />
Thanks to its unique combination of retail and financial<br />
services operations, the Marui Group has established a<br />
distinctive position in Japan’s retail industry.<br />
In retail operations, young, trend-conscious customers<br />
highly evaluate Marui’s extensive lineups of fashion-leading<br />
apparel, accessories, and interior goods. Every year, roughly<br />
200 million people visit our network of 29 stores concentrated<br />
in metropolitan Tokyo.<br />
Meanwhile, in financial services we enhance shopping<br />
convenience for 4.2 million house credit card holders by<br />
offering credit sales, cashing, and other services. Our house<br />
credit card, Akai Card, is primarily issued to facilitate purchases<br />
at Marui stores. The synergy achieved between financial<br />
services and retail operations is the main engine of the<br />
Group’s strong profitability.<br />
In the fiscal period under review, we radically reformed<br />
our management organization to rebuild our operating<br />
platform and enhance Marui’s brand power. At the same<br />
time, we focused on creating a highly profitable store network,<br />
by continuing to pursue an aggressive store opening<br />
strategy and to renovate existing stores. Today, the Marui<br />
Group is dramatically improving its ability to respond to a<br />
changing operating environment, by strengthening its competitiveness<br />
and enhancing its management efficiency.<br />
1
TO OUR STOCKHOLDERS AND FRIENDS<br />
In the eight-month fiscal period under review, ended<br />
September 30, 2003, the Marui Group fundamentally<br />
restructured its management organization to build a solid<br />
business platform for a new era of growth. By optimizing<br />
the professional expertise of each of its employees, Marui<br />
aims to enhance its competitiveness and distinctive position<br />
in Japan’s retail industry. At the same time, the<br />
Company is striving to increase capital efficiency and to<br />
build an organization that can achieve steady profitability<br />
even in harsh operating conditions. Marui will continue<br />
implementing management reforms focused on raising<br />
enterprise value.<br />
Tadao Aoi, President<br />
PERFORMANCE OVERVIEW<br />
In the fiscal period under review, the Japanese economy<br />
showed some signs of bottoming out, including upturns<br />
in stock prices and corporate performance. However, consumer<br />
spending remained flat due to continuing uncertainty<br />
with regard to employment and personal income. In<br />
addition, difficult operating conditions in the retail industry<br />
were exacerbated by highly unseasonable weather.<br />
Faced with this environment, the Marui Group took<br />
decisive measures to strengthen its business base by radically<br />
revamping its management organization and implementing<br />
highly original sales strategies.<br />
In these efforts, we enhanced store competitiveness and<br />
efficiency by remodeling existing stores and creating sales<br />
areas to reflect the regional character of store locations.<br />
In addition, the Company plans to phase out its sales of<br />
electric appliances due to fierce competition in a marketplace<br />
that is becoming increasingly crowded with general<br />
merchandising stores selling low-priced electric appliances.<br />
Meanwhile, Marui leveraged its strengths to launch<br />
aggressive campaigns aimed at strengthening customer<br />
loyalty—mainly through Akai Card tie-ins—and expanding<br />
sales of seasonal products.<br />
2
Further, we sought to heighten the expertise and efficiency<br />
of our administrative division by forming it into the<br />
wholly owned subsidiary Marui Smart Support Co., Ltd., in<br />
January 2003. And, aiming to improve product lineups<br />
and sales area operations, we made our food division into<br />
the wholly owned subsidiary Marui Seasoning Co., Ltd., in<br />
May 2003. All Marui Group companies, including the new<br />
subsidiaries, undertook the fundamental restructuring of<br />
their management organization. Focused on such areas as<br />
personnel systems, these efforts sought to increase each<br />
company’s level of professional know-how and to enhance<br />
the competitiveness of the Marui Group.<br />
Reflecting these initiatives, consolidated total operating<br />
revenues were ¥353.4 billion and ordinary income was<br />
¥16.4 billion. The Company recorded ¥28.6 billion as a<br />
gain on winding up of the non-contributory defined benefit<br />
pension plan resulting from the liquidation of the<br />
Marui Welfare and Pension Fund. Meanwhile, Marui also<br />
reported a valuation loss on fixed assets of ¥14.0 billion<br />
associated with the sale of head office buildings that are<br />
used by the parent company and its subsidiaries to consolidated<br />
subsidiary AIM Create Co., Ltd., which conducts<br />
real estate operations. In October 2003, in conjunction<br />
with the transfer of approximately 5,100 parent company<br />
employees to Group subsidiaries, with the aim of heightening<br />
levels of professional expertise in its respective operations,<br />
the Company paid special termination benefits of<br />
¥14.9 billion to employees that opted for voluntary retirement.<br />
As a result, net income totaled ¥6.2 billion. Further,<br />
the Company expects total assets will have contracted<br />
approximately ¥60 billion due to such factors as the liquidation<br />
of the Marui Welfare and Pension Fund, the payment<br />
of retirement benefits to transferees, and the<br />
valuation loss on head office buildings.<br />
By segment, merchandising sales were ¥273.7 billion,<br />
while operating income amounted to ¥5.4 billion. Credit<br />
and consumer services posted revenues of ¥43.9 billion<br />
and operating income of ¥8.9 billion. Revenues from outside<br />
customers in the other segment totaled ¥35.8 billion<br />
and operating income was ¥4.0 billion. The proportion of<br />
earnings accounted for by the merchandising segment is<br />
lower than in previous fiscal periods; however, this is<br />
because the segment’s year-end sales spike is not included<br />
in the eight-month fiscal period under review. Based on a<br />
sales projection through January 2004, the merchandising<br />
segment represents approximately the same proportion of<br />
earnings as in the previous fiscal year.<br />
DIVIDEND POLICY<br />
Our basic profit distribution policy is to bolster our operating<br />
platform, increase ROE, and continue stable dividend<br />
payments while giving overall consideration to such<br />
factors as performance trends and dividend payout ratios.<br />
Marui will work to maintain stable dividends to stockholders<br />
and, when possible, to increase payments over the<br />
long-term by using retained earnings to strengthen its<br />
financial position, to facilitate business development, and<br />
to open and renovate stores.<br />
Cash dividends per share applicable to the period<br />
under review were ¥15, for a dividend payout ratio of<br />
87.1%. Dividends as a proportion of stockholders’ equity<br />
were 1.3%.<br />
In the period under review, the Company received<br />
authorization at the annual general meeting of stockholders<br />
to buy back 36.00 million shares with a price cap of<br />
¥50.0 billion. During the period, the Company repurchased<br />
10.40 million shares at ¥10.5 billion, giving a total<br />
of 17.14 million shares repurchased at ¥17.9 billion at the<br />
end of the period.<br />
OUTLOOK AND MEDIUM-TERM MANAGEMENT<br />
STRATEGY<br />
Looking ahead, there is increasing expectation of Japan’s<br />
economic recovery on the back of rising stock prices and<br />
signs of an upturn in the U.S. economy. However, the<br />
outlook remains difficult to forecast in light of such causes<br />
for concern as currency exchange rate and interest rate<br />
trends. Furthermore, we expect tough business conditions<br />
3
to continue in the retail industry due to the long-term<br />
slump in consumer confidence and increasingly fierce<br />
competition.<br />
Against this backdrop, the Company will accelerate its<br />
store scrap-and-build program while taking steps aimed<br />
at moving the Marui Group into a new era of growth.<br />
Aiming to expand our area of commercial operations,<br />
we will actively open stores in promising locations. In<br />
October 2003, we opened our first store in the Kansai<br />
region—Kobe Marui, a young and sophisticated fashion<br />
specialty store situated in front of Sannomiya Station.<br />
Also, we will open our largest-ever store, Kitasenju<br />
Marui, in February 2004. By including other major specialty<br />
stores, this new store will be able to cater to the<br />
diverse needs of a wide range of customers. Plans also<br />
call for the opening of new stores in front of Nanba<br />
Station in Osaka in 2006 and in front of Yurakucho<br />
Station in Tokyo in 2007. In addition, we will enhance<br />
the efficiency of our network of existing stores. Such<br />
efforts will involve continued investment in store remodeling<br />
aimed at heightening the competitiveness and<br />
freshness of our stores. At the same time, we will close<br />
stores for which it has become difficult to leverage<br />
Marui’s distinctive strengths due to size or to changes in<br />
the surrounding commercial environment. In line with<br />
that strategy, we closed three stores and two buildings<br />
in January 2004, including our stores in Tsuchiura,<br />
Hachioji, and Kawaguchi. And, our Numazu store is slated<br />
for closure in May 2004. Moreover, we intend to use<br />
internal reserves for capital expenditures, including all<br />
store openings. We therefore do not plan any new<br />
financing in relation to these measures.<br />
In financial services operations, we will continue efforts<br />
to steadily increase the membership of our house credit<br />
card, the Akai Card, and to expand the branch network of<br />
Zero First Co., Ltd. Thanks to ongoing prudent credit<br />
management, consolidated outstanding loans at the end<br />
of the fiscal period were ¥217.2 billion.<br />
As part of the Marui Group’s shift to an integrated management<br />
organization, on October 1, 2003, approximately<br />
5,100 of the parent company’s employees were transferred<br />
to Group subsidiaries according to their abilities<br />
and areas of expertise. Also, we introduced a more performance<br />
based salary system while creating a personnel<br />
organization that actively promotes individuals—irrespective<br />
of age or experience—who are able to translate high<br />
levels of expertise into concrete results.<br />
The Marui Group will achieve solid growth by implementing<br />
the abovementioned measures to further develop<br />
its unique business model, which is founded on retail and<br />
financial services operations. In the current fiscal period,<br />
ending March 31, 2004, which is an irregular six-month<br />
accounting period due to a change in the Company’s fiscal<br />
year-end, we expect consolidated total operating revenues<br />
of ¥293.0 billion, ordinary income of ¥20.0 billion,<br />
and net income of ¥8.0 billion. Factoring in planned store<br />
closures and the restructuring of our personnel system,<br />
we anticipate ordinary income of ¥40.0 billion and ROE<br />
of more than 5% in the fiscal year ending March 31,<br />
2005—the first 12-month accounting period after the<br />
change in fiscal year-end.<br />
In closing, I would like to take this opportunity to ask<br />
our stockholders and friends for their continued support.<br />
January 2004<br />
Tadao Aoi, President<br />
4
ENHANCING THE <strong>MARUI</strong> BRAND<br />
ENHANCING THE <strong>MARUI</strong> BRAND<br />
Marui Kit Center<br />
Marui Seasoning<br />
Marui Access<br />
Marui M’s Mode<br />
Moving<br />
Zero First<br />
CSC<br />
AIM Create<br />
M&C Systems<br />
Marui Fashion Freak Virgin Megastores Japan<br />
Marui Smart Support<br />
Marui will accelerate its growth through stepped-up efforts to<br />
open new stores efficiently and to broaden its customer base<br />
and area of operations. In October 2003, Marui made its<br />
first venture into the Kansai market when it opened the Kobe<br />
Marui store in Kobe, Hyogo Prefecture. We plan to open<br />
another store in the Kansai region in 2006—at Nanba,<br />
Osaka. In metropolitan Tokyo, meanwhile, plans call for<br />
store openings at prime locations in Kitasenju in February<br />
2004 and in Yurakucho in 2007.<br />
Further, the Marui Group revamped its management organization<br />
on an unprecedented scale in October 2003 and<br />
began Group management in earnest. The main aim of such<br />
reforms is to have Group companies work together toward<br />
strengthening customer loyalty and adding value to the<br />
Marui brand. Through these reforms, we are not simply trying<br />
to cut costs; our goal is to improve competitiveness and to<br />
establish a dynamic organization capable of stable longterm<br />
growth. At the same time, Marui will improve profitability<br />
by withdrawing from unprofitable stores and lineups.<br />
By building a highly profitable store network and implementing<br />
farsighted reform of our management organization,<br />
we will create stores that even more customers love to visit.<br />
5
STORE STRATEGY<br />
<strong>CO</strong>NTINUING HIGHLY EFFICIENT<br />
STORE OPENINGS<br />
Marui, which has until now developed its store network<br />
mainly in metropolitan Tokyo, is steadily opening stores<br />
in new regions with a view to creating a nationwide network.<br />
As the first step in these efforts, we opened Kobe<br />
Marui in the Kansai region in October 2003. As well as<br />
incorporating the chic presentation style that is Marui’s<br />
STORE LOCATIONS<br />
Kobe Marui<br />
Kitasenju Marui<br />
Nanba Store<br />
Yurakucho Store<br />
Tokyo Metropolitan Area<br />
Kansai Region<br />
trademark, we designed a highly original store by collaborating<br />
with local businesses and designers. Brisk sales<br />
have already put the store on track to outperform our<br />
sales forecast of ¥7.0 billion for the first year of operations<br />
and to achieve our target of turning a profit in the store’s<br />
first year.<br />
In addition to Kobe Marui, we will further strengthen<br />
our operating base in the Kansai region by opening a store<br />
in Osaka’s Nanba district, which is the center of Kansai’s<br />
political and economic life. Scheduled for opening in<br />
2006, the Nanba store will have a sales floor space of<br />
17,000 square meters—2.5 times larger than Kobe Marui.<br />
Meanwhile, in February 2004 we will unveil our<br />
largest-ever store, with 35,300 square meters of sales floor<br />
space, in Kitasenju. Four commuter lines meet at<br />
Kitasenju, making it the largest railway terminal in north<br />
Tokyo. Given that more than 700,000 people use the station<br />
a day, we are looking forward to attracting large<br />
numbers of customers. Plans call for a total investment<br />
of ¥28.5 billion. By drawing on store development knowhow<br />
accumulated over many years, we aim to create a<br />
store with extensive product lineups and services that<br />
NEWLY OPENED STORE<br />
Kobe Marui<br />
Date of Opening Location Sales Floor Space<br />
October 2003<br />
One of Kobe’s most popular downtown shopping areas<br />
6,940m 2<br />
NEW STORES SCHEDULED FOR OPENING<br />
Kitasenju Marui<br />
Nanba Store<br />
Yurakucho Store<br />
Date of Opening Location Sales Floor Space<br />
February 2004<br />
Autumn 2006<br />
Spring 2007<br />
Adjacent to Kitasenju Station, the largest railway terminal in north Tokyo<br />
Center of Kansai’s political and economic life<br />
Adjacent to Ginza, Tokyo’s prestigious downtown shopping area<br />
35,300m 2<br />
17,000m 2<br />
20,000m 2<br />
6
cater to a wide range of customers. The store will feature<br />
not only fashionable apparel and accessories but also food<br />
products as well as restaurants and large-scale specialty<br />
stores.<br />
Moreover, the Group intends to open a store in Yurakucho<br />
with sales floor space of 20,000 square meters in<br />
2007. The Yurakucho district is adjacent to Ginza—<br />
Tokyo’s prestigious downtown shopping area. It is also<br />
close to Marunouchi, which is Japan’s largest business<br />
district. Investment in this store is expected to amount to<br />
roughly ¥30.0 billion.<br />
Setting our sights on metropolitan Tokyo and the Kansai<br />
and Chukyo regions, we will step up highly efficient store<br />
network expansion efforts. As internal reserves will cover<br />
anticipated capital expenditures of approximately ¥60.0<br />
billion over the coming three years, we do not plan any<br />
new financing.<br />
MANAGEMENT REFORM GOALS<br />
BUILDING A NEW ORGANIZATION<br />
FOR GROWTH<br />
Marui Group companies made a concerted effort to<br />
implement reforms aimed at creating a new management<br />
organization that will maintain stable growth in Japan’s<br />
retail industry. These reforms focused on:<br />
●Heightening the professional specialization of each<br />
Group company in its respective business field<br />
→to increase the Group’s collective strength, to add value<br />
to the Marui brand, and to get on track for new growth.<br />
by increasing the level of expertise that employees bring<br />
to every aspect of our operations. Through reform of our<br />
management organization, we aim to add value to the<br />
Marui brand and to strengthen customer loyalty.<br />
We expect intensified competition in Japan’s retail<br />
industry. Mindful of this, Marui has to implement fundamental<br />
reforms that enable flexible responses to changing<br />
customer needs and market trends while the Group is still<br />
strong. At the same time, we must improve competitiveness,<br />
profitability, and capital efficiency to ensure steady<br />
growth.<br />
STRATEGY 1<br />
CREATING INDEPENDENT BUSINESSES TO<br />
HEIGHTEN SPECIALIZATION<br />
As part of the reform of our management organization, we<br />
transferred roughly 5,100 parent company employees,<br />
excluding managers and executives, to Group subsidiaries<br />
on October 1, 2003.<br />
Under the new management organization, the Marui<br />
Group’s operations have been reorganized by function<br />
and entrusted to 12 Group subsidiaries. Our aim is for<br />
each subsidiary to enhance its specialization and competitiveness<br />
in its particular business area and thereby<br />
contribute value to the Marui brand.<br />
Moreover, we revamped our personnel organization by<br />
introducing a salary system based on position and performance.<br />
We have built a dynamic, results-driven regime<br />
that promotes employees who are able to draw on an<br />
Based on the fundamental retailing tenet of always<br />
putting the customer first, Marui has consistently won the<br />
endorsement of customers by offering the latest fashions.<br />
In recent years, however, growing homogeneity among<br />
rival stores has become a major problem in an increasingly<br />
overcrowded marketplace. It is therefore crucial for<br />
Marui to develop and market its own distinctive brands<br />
that cater precisely to market demand. Accordingly, to<br />
remain competitive in today’s environment, we must further<br />
strengthen our ability to provide customers with<br />
fashionable products and outstanding customer service<br />
7
BUSINESS LINES OF <strong>MARUI</strong> GROUP <strong>CO</strong>MPANIES<br />
Group Company<br />
Marui Co., Ltd.<br />
Moving Co., Ltd.<br />
Zero First Co., Ltd.<br />
CSC Co., Ltd.<br />
AIM Create Co., Ltd.<br />
M&C Systems Co., Ltd.<br />
Virgin Megastores Japan Ltd.<br />
Marui Smart Support Co., Ltd.<br />
Marui Fashion Freak Co., Ltd.<br />
Marui M’s Mode Co., Ltd.<br />
Marui Access Co., Ltd.<br />
Marui Seasoning Co., Ltd.<br />
Marui Kit Center Co., Ltd.<br />
Field of Business<br />
Operation of Marui department stores and service operations, including cashing and credit-card-related services<br />
Delivery of merchandise for Marui and other companies; general transportation services<br />
Operation of roadside branches that provide cashing and other credit-card-related services and travel agency services<br />
Building security and maintenance for Marui and other companies<br />
Advertising, design and display of commercial facilities, and public relations for Marui and other companies<br />
Information processing services and sales of computer software developed for use in credit and marketing management<br />
Retailing of entertainment software products<br />
Administrative services for Marui Group companies and Marui stores<br />
Operation of Marui’s women’s and children’s fashion private brand shops, including ru and tasse tasse, and Marui’s women’s<br />
shoe, bag, and accessory shops<br />
Operation of Marui’s men’s fashion and sports private brand shops, including Visaruno and ON BOARD<br />
Operation of Marui’s watch, eyeglass, accessory, and interior goods specialty shops<br />
Operation of Marui’s sales floor of foodstuffs<br />
Sorting of certain product inventories and store supplies<br />
in-depth understanding of their business field to get<br />
results—irrespective of age or length of service. The<br />
models for our new Group organization were the successful<br />
product development and sales systems that we introduced<br />
in recent years to improve selling power and store<br />
management. In 1998, the Company launched private<br />
brands wholly developed by Marui. And, a sales subsidiary<br />
staffed by employees dispatched from the parent<br />
company began operations in 2000.<br />
In other words, we have changed our philosophy on the<br />
development of employees’ abilities. Rather than focusing<br />
on general skills, as is common among Japanese companies,<br />
we aim to create specialists in each operational area.<br />
Each Group company will independently hire new staff as<br />
necessary. Employees that perform well will be steadily<br />
elevated to positions of greater responsibility. Eventually,<br />
the most talented individuals will be promoted to Marui’s<br />
management team.<br />
products and services, we set basic salaries slightly above<br />
the average for each company’s industry. In addition, all<br />
Group employees receive bonus payments that reflect the<br />
Company’s consolidated performance. Meanwhile, we<br />
created a profit structure that is less susceptible to retirement<br />
benefit liabilities. The Company wound up its noncontributory<br />
defined benefit pension plan due to its<br />
foreseeable failure. And, the parent company settled<br />
retirement benefit liabilities for employees transferred to<br />
Group companies. Due to these organizational reforms, in<br />
the fiscal period under review the Company recorded<br />
one-time expenses associated with the payment of<br />
ORDINARY IN<strong>CO</strong>ME<br />
¥40 billion<br />
¥34 billion<br />
STRATEGY 2<br />
BUILDING A PROFIT STRUCTURE UNAFFECTED<br />
BY RETIREMENT BENEFIT LIABILITIES<br />
The reorganization of the Marui Group’s management<br />
has laid the foundations for a more entrepreneurial culture<br />
that rewards individual business success. Because<br />
each Marui Group company offers high-value-added<br />
6.1%<br />
7.0%<br />
’03/1 ’05/3<br />
(Estimated)<br />
Ordinary income ratio<br />
8
etirement benefits to employees transferred to Group<br />
companies and special termination benefits paid to<br />
employees opting for voluntary retirement. Overall, we<br />
anticipate that personnel expenses will decrease and<br />
profitability will improve significantly going forward as a<br />
result of the Group’s reorganization. However, lowering<br />
wages is not the main aim of these reforms. Rather, we<br />
are seeking to raise the quality of employees’ work and to<br />
facilitate growth of the Marui Group.<br />
Further, in order to put our reforms on track as soon as<br />
possible, we have launched a strategy of aggressive investment<br />
in television commercials and other advertising—an<br />
area in which, over the past decade, we have been gradually<br />
reducing spending. This advertising strategy aims to<br />
increase customer visits by reinforcing the Marui brand<br />
and the image of Marui stores.<br />
Also, we are taking steps to reduce assets in a bid to<br />
improve capital efficiency. For example, in conjunction<br />
with the shift to Group management, Marui sold head<br />
office buildings that are used by the parent company and<br />
its subsidiaries to subsidiary AIM Create Co., Ltd. As a<br />
result, the Company recorded a valuation loss of ¥14.0<br />
billion and lowered assets. We expect that those measures,<br />
combined with the impact of reducing the reserve<br />
for payment of severance and retirement benefits, will<br />
result in consolidated total assets contracting approximately<br />
¥60.0 billion.<br />
STRATEGY 3<br />
WITHDRAWING FROM UNPROFITABLE STORES<br />
AND LINEUPS TO BOOST EARNINGS<br />
As part of the reform of our management organization, we<br />
will actively scrap existing stores that have become<br />
uncompetitive. In January 2004, we closed three stores<br />
and two buildings, including stores in Tsuchiura, Hachioji,<br />
and Kawaguchi. In our view, continuing operations at<br />
those stores would not regain the support of customers.<br />
We felt that because of changes in the stores’ commercial<br />
districts and such considerations as fixtures and the scale<br />
of the stores it would have been difficult to enhance competitiveness.<br />
Also,<br />
we timed these closures<br />
to coincide<br />
with the opening of<br />
our large-scale store<br />
in Kitasenju. Given<br />
that scrapping lowprofit<br />
stores is essential<br />
in the creation of<br />
a highly profitable<br />
store network, we intend to continue implementing closures.<br />
In line with this strategy, Marui will close its<br />
Numazu store in May 2004. Further, we have withdrawn<br />
from our low-profit electric appliance retail operations<br />
and converted related sales areas to operations centered<br />
on cell phone retailing. For Marui stores in which<br />
we think electric appliances are needed, we have consigned<br />
those operations to electric appliance general<br />
merchandising stores.<br />
STORE AND BUILDING CLOSURES<br />
Tsuchiura Store<br />
Hachioji Store<br />
Kawaguchi Store<br />
in The Room Jiyugaoka<br />
Marui One Shibuya<br />
Numazu Store<br />
Date of Closure<br />
January 2004<br />
January 2004<br />
January 2004<br />
January 2004<br />
January 2004<br />
May 2004<br />
Sales Floor Space<br />
4,774m 2<br />
11,797m 2<br />
6,299m 2<br />
1,724m 2<br />
5,980m 2<br />
3,868m 2<br />
9
FINANCIAL REVIEW<br />
OPERATING RESULTS BY BUSINESS SEGMENT<br />
Merchandising<br />
In the eight-month fiscal period under review, ended<br />
September 30, 2003, Japan’s retail industry continued to be<br />
characterized by harsh business conditions. While certain<br />
sectors of the Japanese economy showed signs of recovery,<br />
as in the previous fiscal year consumer spending remained<br />
lackluster due to anxiety over job security and personal<br />
income. Also, the retail industry was adversely affected by<br />
an unseasonably cool summer followed by hot weather.<br />
In this business environment, Marui strengthened its<br />
competitiveness by remodeling existing stores to reflect the<br />
distinctive regional characteristics of each store’s location.<br />
Those efforts included a full remodeling of our store in<br />
Kokubunji, Tokyo. In addition, the Company sought to<br />
enhance store efficiency by significantly downsizing electric<br />
appliance sales areas with a view to eventual withdrawal<br />
from its electric appliance operations. Further, aiming to<br />
strengthen product lineups and the operation of food<br />
division sales areas, the Company established Marui<br />
Seasoning Co., Ltd., in May 2003. This new subsidiary is<br />
responsible for the management of food sales areas and<br />
related personnel at Marui stores.<br />
As a result of these initiatives, the merchandising segment<br />
posted operating revenues of ¥273.7 billion and operating<br />
income of ¥5.4 billion.<br />
With regard to store openings, in October 2003 we<br />
opened Kobe Marui—our first store in the Kansai region.<br />
Moreover, plans call for the opening of Marui’s largest-ever<br />
store, in Kitasenju in north Tokyo, in February 2004; a<br />
second Kansai region store in autumn 2006, in Nanba, Osaka;<br />
and a store in the Yurakucho district of central Tokyo in 2007.<br />
Sales Breakdown by Merchandise Category<br />
Billions of yen (% of total)<br />
2003/9* 2003/1 2002/1 2001/1<br />
Women’s apparel.................................................. ¥ 94.9 (34.7) ¥150.5 (33.9) ¥145.6 (32.8) ¥139.5 (32.1)<br />
Men’s apparel and sporting goods ....................... 49.3 (18.0) 87.3 (19.7) 90.9 (20.5) 90.7 (20.9)<br />
Luxury and accessory goods ............................... 87.1 (31.8) 141.3 (31.8) 147.9 (33.4) 144.3 (33.2)<br />
Furniture and household appliances................... 15.1 (5.5) 24.7 (5.5) 26.0 (5.9) 28.6 (6.6)<br />
Foodstuffs and restaurant sales ........................... 27.2 (10.0) 40.2 (9.1) 33.0 (7.4) 31.2 (7.2)<br />
Total ................................................................. ¥273.6 (100.0) ¥444.0 (100.0) ¥443.4 (100.0) ¥434.3 (100.0)<br />
* Eight months ended September 30, 2003.<br />
Credit and Consumer Services<br />
In credit and consumer services operations, Marui steadily<br />
expanded its network of Zero First branches and grew Akai<br />
Card membership. Thanks to a consistently prudent credit<br />
management policy, we maintained a sound default rate of<br />
2.1% in our mainstay consumer loan business despite the<br />
deterioration of conditions in the consumer loan market in<br />
recent years. Outstanding loans at the end of the fiscal<br />
period rose 3.1% from January 31, 2003, to ¥217.2 billion,<br />
while interest income on consumer loans for the period<br />
totaled ¥36.6 billion. As a result, credit and consumer<br />
services operating revenues were ¥43.9 billion and operating<br />
income was ¥8.9 billion.<br />
Other<br />
The other segment—mainly comprising the operations of<br />
subsidiaries—recorded operating revenues from outside<br />
customers of ¥35.8 billion and operating income of ¥4.0<br />
billion.<br />
Total Operating Revenues<br />
Sales Breakdown by Merchandise Category<br />
Composition of Customer Base<br />
by Age and Gender<br />
(Billion ¥)<br />
600<br />
500<br />
400<br />
300<br />
200<br />
100<br />
0<br />
’00/1 ’01/1 ’02/1 ’03/1’03/9* ’05/3**<br />
(Estimated)<br />
572<br />
(%)<br />
5.5<br />
31.8<br />
10.0<br />
34.7<br />
18.0<br />
Women’s Apparel<br />
Men’s Apparel and<br />
Sporting Goods<br />
Luxury and Accessory<br />
Goods<br />
Furniture and Household<br />
Appliances<br />
Foodstuffs and Restaurant<br />
Sales<br />
(%)<br />
6.9 6.2<br />
15.3<br />
20.4<br />
79.6<br />
71.6<br />
Women<br />
Men<br />
10s~20s<br />
30s<br />
40s<br />
50s<br />
* Eight months ended September 30, 2003<br />
** Full year ending March 31, 2005<br />
10
<strong>CO</strong>NSOLIDATED OPERATIONS<br />
In the fiscal period under review, total operating revenues<br />
amounted to ¥353.4 billion. Cost of goods sold of ¥227.0<br />
billion and gross profit of ¥126.4 billion gave a gross profit<br />
ratio of 35.8%. Selling, general and administrative (SGA)<br />
expenses totaled ¥110.4 billion. And, SGA expenses as a<br />
ratio of operating revenues were 31.2%. Consequently, the<br />
Company posted operating income of ¥16.0 billion and<br />
ordinary income of ¥16.4 billion.<br />
In special gains (losses), loss on devaluation of fixed<br />
assets of ¥14.0 billion and special termination benefits paid<br />
to employees of ¥14.9 billion offset a ¥28.6 billion gain on<br />
winding up of the non-contributory defined benefit pension<br />
plan, associated with the liquidation of the Marui Welfare<br />
and Pension Fund. As a result, total special losses were ¥3.3<br />
billion.<br />
Marui therefore recorded income before income taxes and<br />
minority interests of ¥13.2 billion and net income of ¥6.2<br />
billion. Diluted net income per share was ¥17. Return on<br />
total assets was 0.8%, while return on stockholders’ equity<br />
was 1.5%.<br />
CASH FLOW AND FINANCIAL <strong>CO</strong>NDITION<br />
The Company generates adequate cash flow to fund timely<br />
strategic capital investment for growth. Also, Marui<br />
maintains and strengthens the soundness of its financial<br />
position by taking steps to reduce total assets. Thanks to<br />
such measures in the fiscal period under review, we were<br />
able to maintain our solid financial position.<br />
In cash flows from operating activities, income before<br />
income taxes and minority interests of ¥13.2 billion,<br />
depreciation and amortization of ¥12.2 billion, and income<br />
taxes paid in cash of ¥10.6 billion contributed to net cash<br />
provided by operating activities of ¥15.9 billion.<br />
In cash flows from investing activities, net cash used in<br />
investing activities totaled ¥5.3 billion, which was mainly<br />
related to payments for purchase of property and equipment<br />
for the opening of new stores and the remodeling of<br />
existing stores.<br />
DIVIDENDS<br />
Cash dividends per share were ¥15, giving a dividend<br />
payout ratio of 87.1%. Dividends as a proportion of<br />
stockholders’ equity were 1.3%. In addition, the Company<br />
In cash flows from financing activities, payments for<br />
purchase of treasury stock of ¥10.5 billion largely offset an<br />
¥11.7 billion net increase in short-term loans and long-term<br />
debt. Consequently, net cash used in financing activities was<br />
¥6.8 billion.<br />
As a result, cash and cash equivalents at the end of the<br />
fiscal period increased ¥3.8 billion from the previous fiscal<br />
year-end, to ¥68.6 billion.<br />
At the end of the fiscal period, total current assets stood at<br />
¥413.6 billion and total current liabilities amounted to<br />
¥180.9 billion. Working capital was ¥232.8 billion and the<br />
current ratio was 2.3 times. Meanwhile, total assets were<br />
¥734.2 billion, total stockholders’ equity was ¥414.5 billion,<br />
and the equity ratio was 56.5%.<br />
paid ¥10.5 billion for the purchase of treasury stock in the<br />
fiscal period under review.<br />
Operating Income<br />
Net Income<br />
Total Assets and Stockholders’ Equity<br />
(Billion ¥)<br />
50<br />
(Billion ¥)<br />
20<br />
20<br />
(%)<br />
5<br />
(Billion ¥)<br />
800<br />
(%)<br />
100<br />
40<br />
41<br />
15<br />
4<br />
600<br />
80<br />
30<br />
20<br />
10<br />
3<br />
2<br />
400<br />
60<br />
40<br />
10<br />
5<br />
1<br />
200<br />
20<br />
0<br />
’00/1 ’01/1 ’02/1 ’03/1’03/9* ’05/3**<br />
(Estimated)<br />
* Eight months ended September 30, 2003<br />
** Full year ending March 31, 2005<br />
0<br />
0<br />
’00/1 ’01/1 ’02/1 ’03/1’03/9* ’05/3**<br />
(Estimated)<br />
Return on Total Assets (right scale) Return on Equity (right scale)<br />
* Eight months ended September 30, 2003<br />
** Full year ending March 31, 2005<br />
0<br />
’00/1 ’01/1 ’02/1 ’03/1 ’03/9*<br />
Stockholders’ Equity Equity Ratio (right scale)<br />
* Eight months ended September 30, 2003<br />
0<br />
11
<strong>CO</strong>NSOLIDATED FIVE-YEAR SUMMARY<br />
Marui Co., Ltd. and Its Consolidated Subsidiaries<br />
Eight months ended September 30, 2003, and years ended January 31, 2003, 2002, 2001 and 2000<br />
Thousands of United<br />
Millions of yen except<br />
States dollars except<br />
per share amounts and other information*<br />
per share amounts**<br />
2003/9*** 2003/1 2002/1 2001/1 2000/1 2003/9<br />
Operating results:<br />
Total operating revenues ......................... ¥353,408 ¥558,867 ¥551,564 ¥530,485 ¥521,802 $3,183,856<br />
Merchandise sales ................................ 273,608 443,933 443,358 434,206 432,579 2,464,937<br />
Finance charges earned<br />
on installment sales ........................... 1,417 2,348 2,509 2,537 2,679 12,766<br />
Interest income on<br />
consumer loans.................................. 36,558 53,500 46,324 37,591 36,950 329,351<br />
Other revenues..................................... 41,825 59,086 59,373 56,151 49,594 376,802<br />
Cost of goods sold................................... 226,966 356,558 353,252 341,763 330,195 2,044,739<br />
Selling, general and<br />
administrative expenses ........................ 110,433 167,992 165,383 159,580 159,060 994,892<br />
Operating income.................................... 16,009 34,317 32,929 29,142 32,547 144,225<br />
Ordinary income ..................................... 16,414 33,938 33,059 29,381 33,092 147,874<br />
Net income.............................................. 6,154 17,620 14,910 8,335 17,354 55,441<br />
Per share amounts (Yen and dollars):<br />
Net income**** – Basic....................... ¥17 ¥48 ¥40 ¥23 ¥47 $0.15<br />
– Diluted................... 17 45 38 22 44 0.15<br />
Cash dividends .................................... 15 22 22 22 22 0.14<br />
Financial position at period-end and year-end:<br />
Working capital....................................... ¥232,776 ¥263,802 ¥213,289 ¥227,038 ¥217,206 $2,097,082<br />
Receivables .............................................. 247,327 247,924 239,862 194,855 186,910 2,228,171<br />
Stockholders’ equity ................................ 414,456 425,641 424,400 417,396 417,890 3,733,838<br />
Total assets .............................................. 734,157 729,901 743,791 675,239 661,063 6,614,027<br />
Long-term debt, less current maturities... 129,689 129,689 82,889 99,562 99,562 1,168,369<br />
Other information:<br />
Average number of shares<br />
outstanding (thousands)....................... 353,810 367,512 368,656 368,658 368,657<br />
Sales floor space (m 2 ) .............................. 488,875 488,875 475,245 456,219 447,275<br />
Number of employees ............................. 9,181 10,379 9,957 10,171 10,164<br />
* All yen figures in this annual report are represented based on accounting principles generally accepted in Japan.<br />
** All dollar figures in this annual report refer to U.S. currency. Yen amounts have been translated, for convenience only, at the rate of ¥111 to US$1.<br />
*** The fiscal period ended September 30, 2003, consists of the eight months from February 1, 2003, to September 30, 2003, because of the change<br />
of the year-end.<br />
**** See Note 2 of the notes to consolidated financial statements.<br />
12
NON-<strong>CO</strong>NSOLIDATED FIVE-YEAR SUMMARY<br />
Marui Co., Ltd.<br />
Eight months ended September 30, 2003, and years ended January 31, 2003, 2002, 2001 and 2000<br />
Thousands of United<br />
Millions of yen except<br />
States dollars except<br />
per share amounts and other information*<br />
per share amounts**<br />
2003/9*** 2003/1 2002/1 2001/1 2000/1 2003/9<br />
Operating results:<br />
Total operating revenues ......................... ¥313,830 ¥504,329 ¥498,507 ¥482,090 ¥480,882 $2,827,297<br />
Merchandise sales ................................ 273,598 443,840 443,156 433,904 432,579 2,464,847<br />
Finance charges earned<br />
on installment sales ........................... 1,417 2,348 2,509 2,537 2,679 12,765<br />
Interest income on<br />
consumer loans.................................. 32,292 48,529 42,969 35,348 35,291 290,919<br />
Other revenues..................................... 6,523 9,612 9,873 10,301 10,333 58,766<br />
Cost of goods sold................................... 196,310 315,970 313,342 306,623 299,901 1,768,558<br />
Selling, general and<br />
administrative expenses ........................ 103,414 157,297 156,801 150,623 152,965 931,658<br />
Operating income.................................... 14,106 31,062 28,364 24,844 28,016 127,081<br />
Ordinary income ..................................... 14,703 30,940 28,750 25,254 28,682 132,459<br />
Net income.............................................. 4,944 16,255 12,815 9,360 15,516 44,541<br />
Per share amounts (Yen and dollars):<br />
Net income**** – Basic....................... ¥14 ¥44 ¥35 ¥25 ¥42 $0.13<br />
– Diluted................... 14 42 33 25 40 0.13<br />
Cash dividends .................................... 15 22 22 22 22 0.14<br />
Financial position at period-end and year-end:<br />
Working capital....................................... ¥215,182 ¥229,544 ¥188,545 ¥206,762 ¥195,977 $1,938,577<br />
Receivables .............................................. 214,261 221,310 219,781 180,514 175,628 1,930,279<br />
Stockholders’ equity ................................ 376,108 388,522 388,640 383,754 382,588 3,388,360<br />
Total assets .............................................. 645,147 652,919 675,465 614,322 609,277 5,812,135<br />
Long-term debt, less current maturities.. 119,839 119,839 79,839 99,562 99,562 1,079,631<br />
Other information:<br />
Average number of shares<br />
outstanding (thousands)....................... 353,810 367,512 368,656 368,658 368,657<br />
Sales floor space (m 2 ) .............................. 488,875 488,875 475,245 456,219 447,275<br />
Number of employees ............................. 1,477 2,335 2,458 4,904 7,050<br />
* All yen figures in this annual report are represented based on accounting principles generally accepted in Japan.<br />
** All dollar figures in this annual report refer to U.S. currency. Yen amounts have been translated, for convenience only, at the rate of ¥111 to US$1.<br />
*** The fiscal period ended September 30, 2003, consists of the eight months from February 1, 2003, to September 30, 2003, because of the change<br />
of the year-end.<br />
**** See Note 2 of the notes to consolidated financial statements.<br />
13
<strong>CO</strong>NSOLIDATED BALANCE SHEETS<br />
Marui Co., Ltd. and Its Consolidated Subsidiaries<br />
September 30 and January 31, 2003<br />
Thousands of<br />
U.S. dollars<br />
Millions of yen (Note 3)<br />
ASSETS 2003/9 2003/1 2003/9<br />
Current assets:<br />
Cash (Note 4)................................................................................................. ¥ 68,616 ¥ 64,754 $ 618,162<br />
Receivables:<br />
– Merchandise sales........................................................................................ 39,013 45,054 351,468<br />
– Consumer loans .......................................................................................... 217,214 210,670 1,956,883<br />
– Allowance for doubtful accounts ................................................................ (8,900) (7,800) (80,180)<br />
247,327 247,924 2,228,171<br />
Securities (Note 6) ......................................................................................... 10,000 – 90,090<br />
Inventories (Note 5)....................................................................................... 52,041 51,566 468,838<br />
Deferred income tax assets (Note 11)............................................................ 9,490 3,150 85,496<br />
Other current assets ....................................................................................... 26,172 13,435 235,784<br />
Total current assets.................................................................................. 413,646 380,829 3,726,541<br />
Property and equipment, at cost:<br />
Land ............................................................................................................... 94,213 107,784 848,766<br />
Buildings and improvements ......................................................................... 263,737 267,662 2,376,009<br />
Store fixtures and equipment......................................................................... 39,832 39,707 358,847<br />
Construction in progress................................................................................ 8,768 6,564 78,991<br />
406,550 421,717 3,662,613<br />
Less accumulated depreciation ...................................................................... (190,630) (192,586) (1,717,388)<br />
Net property and equipment................................................................... 215,920 229,131 1,945,225<br />
Other assets:<br />
Investments in securities (Note 6)................................................................. 11,434 19,474 103,009<br />
Prepaid rents and lease deposits – principally for stores (Note 7)................. 64,096 72,673 577,441<br />
Deferred income tax assets (Note 11)............................................................ 5,800 17,530 52,252<br />
Other assets.................................................................................................... 23,261 10,264 209,559<br />
Total other assets..................................................................................... 104,591 119,941 942,261<br />
¥ 734,157 ¥ 729,901 $ 6,614,027<br />
See accompanying notes to consolidated financial statements.<br />
14
Thousands of<br />
U.S. dollars<br />
Millions of yen (Note 3)<br />
LIABILITIES AND STOCKHOLDERS’ EQUITY 2003/9 2003/1 2003/9<br />
Current liabilities:<br />
Short-term loans and current maturities of long-term debt (Note 8)............ ¥ 57,790 ¥ 46,100 $ 520,631<br />
Payables – principally trade ........................................................................... 48,907 41,981 440,603<br />
Income taxes payable ..................................................................................... 695 9,610 6,261<br />
Other current liabilities.................................................................................. 73,478 19,336 661,964<br />
Total current liabilities ............................................................................ 180,870 117,027 1,629,459<br />
Long-term liabilities:<br />
Long-term debt, less current maturities (Note 8).......................................... 129,689 129,689 1,168,369<br />
Deferred income tax liabilities (Note 11) ...................................................... 1,900 1,600 17,117<br />
Severance and retirement benefits for employees (Note 10) ......................... 1,300 50,391 11,712<br />
Severance and retirement benefits for directors and<br />
corporate statutory auditors......................................................................... 1,318 1,350 11,874<br />
Other long-term liabilities.............................................................................. 2,195 2,223 19,775<br />
Total long-term liabilities ........................................................................ 136,402 185,253 1,228,847<br />
Minority interests ............................................................................................. 2,429 1,980 21,883<br />
Contingent liabilities (Note 12)<br />
Stockholders’ equity:<br />
Common stock:<br />
Authorized – 1,400,000 thousand shares<br />
Issued – 368,660 thousand shares.............................................................. 35,921 35,921 323,613<br />
Capital surplus ............................................................................................... 91,274 91,274 822,288<br />
Retained earnings........................................................................................... 304,444 306,339 2,742,739<br />
431,639 433,534 3,888,640<br />
Net unrealized holding gains (losses) on securities....................................... 689 (532) 6,207<br />
Less treasury stock, at cost............................................................................. (17,872) (7,361) (161,009)<br />
Total stockholders’ equity ....................................................................... 414,456 425,641 3,733,838<br />
¥734,157 ¥729,901 $6,614,027<br />
15
<strong>CO</strong>NSOLIDATED STATEMENTS OF IN<strong>CO</strong>ME<br />
Marui Co., Ltd. and Its Consolidated Subsidiaries<br />
Eight months ended September 30, 2003, and years ended January 31, 2003 and 2002<br />
Thousands of<br />
U.S. dollars<br />
Millions of yen (Note 3)<br />
2003/9 2003/1 2002/1 2003/9<br />
Operating revenues:<br />
Merchandise sales............................................................................ ¥273,608 ¥443,933 ¥443,358 $2,464,937<br />
Finance charges earned on installment sales .................................. 1,417 2,348 2,509 12,766<br />
Interest income on consumer loans ................................................ 36,558 53,500 46,324 329,351<br />
Other revenues................................................................................ 41,825 59,086 59,373 376,802<br />
Total operating revenues .......................................................... 353,408 558,867 551,564 3,183,856<br />
Operating expenses:<br />
Cost of goods sold........................................................................... 226,966 356,558 353,252 2,044,739<br />
Selling, general and administrative expenses.................................. 110,433 167,992 165,383 994,892<br />
Total operating expenses .......................................................... 337,399 524,550 518,635 3,039,631<br />
Operating income .............................................................................. 16,009 34,317 32,929 144,225<br />
Non-operating income (expenses):<br />
Interest income ............................................................................... 300 416 436 2,703<br />
Interest expenses............................................................................. (1,221) (2,533) (1,900) (11,000)<br />
Other, net ........................................................................................ 1,326 1,738 1,594 11,946<br />
Total non-operating income (expenses)................................... 405 (379) 130 3,649<br />
Ordinary income................................................................................ 16,414 33,938 33,059 147,874<br />
Special gains (losses):<br />
Gain on sale of property and equipment......................................... 623 15 3,568 5,613<br />
Gain on sale of investments in securities........................................ – – 17 –<br />
Gain on winding up of the non-contributory defined<br />
benefit pension plan (Notes 2 and 10) ......................................... 28,564 – – 257,333<br />
Loss on disposal of property and equipment .................................. (2,038) (2,682) (3,240) (18,361)<br />
Loss on sale of investments in securities ........................................ – (48) (399) –<br />
Loss on devaluation of property and equipment ............................ (14,024) – – (126,342)<br />
Loss on devaluation of investments in securities............................ (40) (145) (984) (360)<br />
Loss on devaluation of investment in an affiliated company.......... – (100) – –<br />
Loss on devaluation of golf memberships....................................... – – (26) –<br />
Loss on the net transition obligation of severance and<br />
retirement benefits for employees (Note 2) .................................. – – (5,395) –<br />
Loss on partial termination of lump-sum severance and<br />
retirement benefits for employees and privately held<br />
pension plan (Notes 2 and 10) ..................................................... (396) – – (3,568)<br />
Special termination benefits paid to employees (Note 10) ............. (14,901) – – (134,243)<br />
Other, net ........................................................................................ (1,038) – – (9,351)<br />
Total special losses ................................................................... (3,250) (2,960) (6,459) (29,279)<br />
Income before income taxes and minority interests ........................ 13,164 30,978 26,600 118,595<br />
Income taxes (Note 11):<br />
Current............................................................................................ 1,720 17,143 16,133 15,495<br />
Deferred........................................................................................... 4,833 (3,915) (4,610) 43,541<br />
Total income taxes.................................................................... 6,553 13,228 11,523 59,036<br />
Minority interests .............................................................................. (457) (130) (167) (4,118)<br />
Net income......................................................................................... ¥ 6,154 ¥ 17,620 ¥ 14,910 $ 55,441<br />
U.S. dollars<br />
Yen (Note 3)<br />
Net income per share:<br />
Basic ................................................................................................ ¥17 ¥48 ¥40 $0.15<br />
Diluted ............................................................................................ 17 45 38 0.15<br />
Cash dividends per share applicable to the year ............................. 15 22 22 0.14<br />
See accompanying notes to consolidated financial statements.<br />
16
<strong>CO</strong>NSOLIDATED STATEMENTS OF STOCKHOLDERS’ EQUITY<br />
Marui Co., Ltd. and Its Consolidated Subsidiaries<br />
Eight months ended September 30, 2003, and years ended January 31, 2003 and 2002<br />
Millions of yen<br />
Thousands of<br />
Net unrealized<br />
shares of Common Capital Retained holding gains Less treasury<br />
common stock stock surplus earnings (losses)on securities stock, at cost<br />
Balance at January 31, 2001 .................................... 368,660 ¥35,921 ¥91,274 ¥290,202 ¥ – ¥ (1)<br />
Net income ............................................................ – – – 14,910 – –<br />
Cash dividends paid (¥22 per share)..................... – – – (8,111) – –<br />
Directors’ bonuses.................................................. – – – (86) – –<br />
Net unrealized holding gains on securities............ – – – – 315 –<br />
Treasury stock acquired, net.................................. – – – – – (24)<br />
Balance at January 31, 2002 .................................... 368,660 35,921 91,274 296,915 315 (25)<br />
Net income ............................................................ – – – 17,620 – –<br />
Cash dividends paid (¥22 per share)..................... – – – (8,110) – –<br />
Directors’ bonuses.................................................. – – – (86) – –<br />
Net unrealized holding losses on securities........... – – – – (847) –<br />
Treasury stock acquired, net.................................. – – – – – (7,336)<br />
Balance at January 31, 2003 .................................... 368,660 35,921 91,274 306,339 (532) (7,361)<br />
Net income ............................................................ – – – 6,154 – –<br />
Cash dividends paid (¥15 per share)..................... – – – (7,963) – –<br />
Directors’ bonuses.................................................. – – – (86) – –<br />
Net unrealized holding gains on securities............ – – – – 1,221 –<br />
Treasury stock acquired, net.................................. – – – – – (10,511)<br />
Balance at September 30, 2003................................ 368,660 ¥35,921 ¥91,274 ¥304,444 ¥ 689 ¥(17,872)<br />
Thousands of U.S. dollars (Note 3)<br />
Thousands of<br />
Net unrealized<br />
shares of Common Capital Retained holding gains Less treasury<br />
common stock stock surplus earnings (losses)on securities stock, at cost<br />
Balance at January 31, 2003 .................................... 368,660 $323,613 $822,288 $2,759,812 $ (4,793) $ (66,315)<br />
Net income ............................................................ – – – 55,441 – –<br />
Cash dividends paid ($0.14 per share).................. – – – (71,739) – –<br />
Directors’ bonuses.................................................. – – – (775) – –<br />
Net unrealized holding gains on securities............ – – – – 11,000 –<br />
Treasury stock acquired, net.................................. – – – – – (94,694)<br />
Balance at September 30, 2003................................ 368,660 $323,613 $822,288 $2,742,739 $ 6,207 $(161,009)<br />
See accompanying notes to consolidated financial statements.<br />
17
<strong>CO</strong>NSOLIDATED STATEMENTS OF CASH FLOWS<br />
Marui Co., Ltd. and Its Consolidated Subsidiaries<br />
Eight months ended September 30, 2003, and years ended January 31, 2003 and 2002<br />
Thousands of<br />
U.S. dollars<br />
Millions of yen (Note 3)<br />
2003/9 2003/1 2002/1 2003/9<br />
Cash flows from operating activities:<br />
Income before income taxes and minority interests ....................... ¥ 13,164 ¥ 30,978 ¥ 26,600 $ 118,595<br />
Adjustments to reconcile income before income taxes and minority<br />
interests to net cash provided by (used in) operating activities:<br />
Depreciation and amortization .................................................... 12,242 18,780 18,038 110,288<br />
Increase (decrease) in accrued bonuses....................................... 4,270 10 (283) 38,469<br />
(Decrease) increase in severance and retirement benefits<br />
for employees and prepaid pension expense ............................. (33,343) 4,898 7,189 (300,387)<br />
Interest and dividends income .................................................... (389) (533) (548) (3,505)<br />
Interest expenses ......................................................................... 1,221 2,533 1,900 11,000<br />
Issuance costs of bonds ............................................................... – 240 212 –<br />
Gain on sale of property and equipment ..................................... (623) (15) (3,568) (5,613)<br />
Gain on sale of investments in securities .................................... – – (17) –<br />
Gain on winding up of the non-contributory defined<br />
benefit pension plan .................................................................. (28,564) – – (257,333)<br />
Loss on disposal of property and equipment............................... 1,463 2,173 2,937 13,180<br />
Loss on sale of investments in securities..................................... – 48 399 –<br />
Loss on devaluation of investments in securities ........................ 40 145 984 360<br />
Loss on devaluation of property and equipment......................... 14,024 – – 126,342<br />
Loss on devaluation of investment in an affiliated company ...... – 100 – –<br />
Loss on devaluation of golf memberships ................................... – – 26 –<br />
Decrease (increase) in receivables, less allowance for<br />
doubtful accounts...................................................................... 596 (8,062) (45,007) 5,369<br />
(Increase) decrease in inventories ............................................... (474) 2,590 (2,833) (4,270)<br />
Increase in tax refund receivable ................................................. (7,220) – – (65,045)<br />
Increase (decrease) in payables – principally trade ..................... 6,926 (2,686) (2,277) 62,397<br />
Increase in payables of lump-sum severance payments and<br />
special severance indemnities.................................................... 49,862 – – 449,207<br />
Bonuses paid to directors............................................................. (86) (86) (86) (775)<br />
Other, net..................................................................................... (6,299) (3,150) 528 (56,748)<br />
Subtotal .................................................................................... 26,810 47,963 4,194 241,531<br />
Interest and dividends income received in cash.......................... 413 523 572 3,721<br />
Interest expenses paid in cash ..................................................... (711) (2,413) (1,801) (6,405)<br />
Income taxes paid in cash............................................................ (10,634) (17,649) (12,103) (95,802)<br />
Net cash provided by (used in) operating activities ................ 15,878 28,424 (9,138) 143,045<br />
Cash flows from investing activities:<br />
Payments for purchase of property and equipment ........................ (11,493) (22,797) (29,754) (103,540)<br />
Proceeds from sale of property and equipment............................... 1,070 181 4,988 9,640<br />
Purchases of investments in securities............................................ (22) (156) (34) (198)<br />
Proceeds from sale of investments in securities.............................. – 147 191 –<br />
Payments of leasehold deposits....................................................... (187) (2,169) (3,603) (1,685)<br />
Refunds of leasehold deposits ......................................................... 5,482 3,302 4,636 49,387<br />
Other, net ........................................................................................ (173) 32 (1,402) (1,559)<br />
Net cash used in investing activities ........................................ (5,323) (21,460) (24,978) (47,955)<br />
Cash flows from financing activities:<br />
Net increase in short-term loans and long-term debt ..................... 11,690 5,450 6,810 105,316<br />
Proceeds from issuance of bonds .................................................... – 39,760 39,788 –<br />
Redemption of convertible bonds ................................................... – (59,962) – –<br />
Payments for purchase of treasury stock ........................................ (10,510) (7,348) – (94,685)<br />
Dividends paid ................................................................................ (7,963) (8,110) (8,111) (71,739)<br />
Other, net ........................................................................................ (10) (11) (34) (90)<br />
Net cash (used in) provided by financing activities................. (6,793) (30,221) 38,453 (61,198)<br />
Net increase (decrease) in cash and cash equivalents ..................... 3,762 (23,257) 4,337 33,892<br />
Cash and cash equivalents at beginning of year............................... 64,754 88,011 83,574 583,369<br />
Increase in cash and cash equivalents due to inclusion of<br />
additional subsidiaries in the consolidation .................................. 100 – 100 901<br />
Cash and cash equivalents at end of year......................................... ¥ 68,616 ¥ 64,754 ¥ 88,011 $ 618,162<br />
See accompanying notes to consolidated financial statements.<br />
18
NOTES TO <strong>CO</strong>NSOLIDATED FINANCIAL STATEMENTS<br />
Marui Co., Ltd. and Its Consolidated Subsidiaries<br />
September 30, 2003 and January 31, 2003 and 2002<br />
1. BASIS OF PRESENTING <strong>CO</strong>NSOLIDATED FINANCIAL STATEMENTS<br />
Marui Co., Ltd. (the “Company”) and its consolidated subsidiaries<br />
(the “Companies”) maintain their accounts and records in<br />
accordance with the provisions set forth in the Japanese Commercial<br />
Code (the “Code”) and the Securities and Exchange Law and in<br />
conformity with accounting principles and practices generally<br />
accepted in Japan, which are different from International Accounting<br />
Standards and standards in other countries in certain respects as to<br />
application and disclosure requirements. Accordingly, the accompanying<br />
financial statements are intended for use by those who are<br />
informed about Japanese accounting principles and practices.<br />
The accompanying consolidated financial statements are a translation<br />
of the audited consolidated financial statements of the Company<br />
which were prepared in accordance with accounting principles and<br />
practices generally accepted in Japan from the accounts and records<br />
maintained by the Company and its consolidated subsidiaries and<br />
were filed with the appropriate Local Finance Bureau of the Ministry<br />
of Finance as required by the Securities and Exchange Law.<br />
In preparing the accompanying consolidated financial statements,<br />
certain reclassifications and modifications have been made<br />
in the consolidated financial statements issued domestically in<br />
order to present them in a form which is more familiar to readers<br />
outside Japan. The consolidated statements of stockholders’ equity<br />
for the eight months ended September 30, 2003, and for the years<br />
ended January 31, 2003 and 2002, have been prepared for the<br />
purpose of inclusion in the consolidated financial statements,<br />
although such statements were not customarily prepared in Japan<br />
and not filed with the regulatory authorities.<br />
The Company and its consolidated subsidiaries changed the<br />
year-end from January 31 to March 31 in accordance with the resolution<br />
of change in a part of the Company’s articles at the annual<br />
general meeting of the stockholders held on April 25, 2003. As the<br />
transitional period of the change of the fiscal year-end, the most<br />
recent fiscal period ended September 30, 2003, which consists of<br />
the eight months from February 1, 2003 to September 30, 2003.<br />
2. SUMMARY OF SIGNIFICANT AC<strong>CO</strong>UNTING POLICIES<br />
(a) PRINCIPLES OF <strong>CO</strong>NSOLIDATION<br />
The consolidated financial statements include the accounts of the<br />
Company and its significant subsidiaries, which are all Japanese<br />
corporations. All companies in Japan are required to consolidate<br />
all significant investees which are controlled through substantial<br />
ownership of majority voting rights or through certain other<br />
means. The application of this rule to the Company’s consolidated<br />
financial statements had no effect. All significant intercompany<br />
transactions and unrealized profits among the Companies have<br />
been eliminated in consolidation. Investments in 20%–50%<br />
owned affiliates are carried at cost, since the amounts are insignificant.<br />
In the elimination of investments in subsidiaries, the assets<br />
and liabilities of the subsidiaries, including the portion attributable<br />
to minority stockholders, are evaluated using the fair value at the<br />
time the Company acquired control of the respective subsidiaries.<br />
The excess of investment cost over the net assets of a subsidiary<br />
acquired is amortized on a straight-line basis over a period of five<br />
years. However, the excess is charged (or credited) to income in<br />
the period of acquisition when the amounts are immaterial.<br />
(b) CASH AND CASH EQUIVALENTS<br />
In preparing the consolidated statements of cash flows, cash,<br />
readily-available deposits and short-term highly liquid investments<br />
with maturities of not exceeding three months at the time<br />
of purchase are considered to be cash and cash equivalents.<br />
(c) UNEARNED FINANCE CHARGES<br />
At the balance sheet date, unearned finance charges included in<br />
receivables of merchandise sales under installment sales and<br />
consumer loans are deferred.<br />
(d) INVESTMENTS IN SECURITIES<br />
Effective February 1, 2001, the Companies have adopted the<br />
“Accounting Standard for Financial Instruments”, issued by the<br />
Business Accounting Deliberation Council on January 22, 1999.<br />
Upon applying this accounting standard, all companies are<br />
required to examine the intent of holding each security and<br />
classify those securities as (a) securities held for trading purposes,<br />
(b) debt securities intended to be held to maturity (hereafter,<br />
“held-to-maturity debt securities”), (c) equity securities issued by<br />
subsidiaries and affiliated companies and (d) all other securities<br />
that are not classified in any of the above categories (hereafter,<br />
“available-for-sale securities”).<br />
Based on the examination of the intent of holding, the<br />
Companies classified their securities as held-to-maturity debt<br />
securities, equity securities issued by subsidiaries and affiliated<br />
companies and available-for-sale securities. Held-to-maturity debt<br />
securities maturing within one year from the balance sheet date<br />
are included in current assets. Other securities are included in<br />
investments in securities.<br />
Held-to-maturity debt securities are stated at amortized cost.<br />
Equity securities issued by subsidiaries and affiliated companies<br />
that are not consolidated or accounted for using the equity<br />
method are stated at cost by the moving average method. Availablefor-sale<br />
securities with available fair market values are stated at the<br />
market value. Unrealized gains and losses on these securities are<br />
reported, net of applicable income taxes, as a separate component<br />
of stockholders’ equity. Realized gains and losses on sale of such<br />
securities are computed by the moving average method. Availablefor-sale<br />
securities without available fair market value are stated at<br />
cost by the moving average method.<br />
(e) ALLOWANCE FOR DOUBTFUL AC<strong>CO</strong>UNTS<br />
Effective February 1, 2001, the Companies have adopted the<br />
“Opinion Concerning Establishment of Accounting Standard for<br />
Financial Instruments”, issued by the Business Accounting<br />
Deliberation Council on January 22, 1999.<br />
Under this accounting standard, the Companies provide for a<br />
sufficient allowance for doubtful accounts to cover probable losses<br />
on collection by estimating uncollectible amounts individually in<br />
addition to amounts for possible losses based on actual losses on<br />
collection in the past.<br />
(f) MERCHANDISE INVENTORIES<br />
Merchandise inventories are principally determined on the retail<br />
inventory method and are stated at cost, which is lower than<br />
market.<br />
(g) PROPERTY AND EQUIPMENT AND DEPRECIATION<br />
Property and equipment are carried at cost. Depreciation is<br />
computed over the estimated useful lives of the assets on a<br />
declining-balance method. Estimated useful lives of the assets are<br />
as follows:<br />
Number of years<br />
Buildings.................................................................. 39–50<br />
Improvements.......................................................... 3–15<br />
Store fixtures and equipment .................................. 3–10<br />
(h) INTANGIBLE ASSETS AND AMORTIZATION<br />
The Companies amortize intangible assets (except for software to<br />
be sold) based on the straight-line method in accordance with the<br />
Japanese Corporate Tax Law. The annual amortization of software<br />
to be sold is provided by the greater of the amount computed<br />
using the expected sales revenues or the amount computed using<br />
the straight-line method over the expected marketable period<br />
(within three years).<br />
(i) SEVERANCE AND RETIREMENT BENEFITS FOR<br />
EMPLOYEES<br />
Employees severing their connection with the Companies on retirement<br />
are generally entitled to annuity payments covered by three<br />
19
severance and retirement benefit pension plans—a non-contributory<br />
defined benefit pension plan supported by the government, a<br />
lump-sum severance and retirement payment plan and a privately<br />
held pension plan—based on rates of pay, length of service and<br />
certain other factors.<br />
Effective February 1, 2001, the Companies adopted the new<br />
accounting standard, “Opinion on Setting Accounting Standard<br />
for Employees’ Severance and Pension Benefits”, issued by the<br />
Business Accounting Deliberation Council on June 16, 1998.<br />
The excess of the present value of the future obligations<br />
required for severance and retirement benefit plans over the<br />
total of the fair value of the pension plan assets as of February 1,<br />
2001, and the obligations for severance and retirement benefits<br />
recorded as of February 1, 2001 (the “net transition obligation”),<br />
amounted to ¥5,395 million and was expensed and presented as<br />
a special loss in the year ended January 31, 2002.<br />
Actuarial gains and losses are amortized using the straightline<br />
method over the estimated average remaining service lives<br />
(from ten years to fourteen years) of employees commencing<br />
with the following period.<br />
As a result of the adoption of the new accounting standard, in<br />
the year ended January 31, 2002, income before income taxes<br />
decreased by ¥5,395 million compared with what would have<br />
been recorded under the previous accounting standard.<br />
In connection with enforcement of the Defined Benefit Enterprise<br />
Pension Law, the Company and some of its consolidated subsidiaries<br />
received approval from the Minister of Health, Labor and<br />
Welfare for winding up the non-contributory defined benefit pension<br />
plan supported by the government and exemption from payment<br />
of future benefits on March 18 and September 26, 2003.<br />
Under this condition, the Company and some of its<br />
consolidated subsidiaries adopted the Accounting Standard<br />
Implementation Guidance No. 1, “Implementation Guidance on<br />
Accounting Standard for the Transitions Between the Retirement<br />
Benefit Plans”, issued by the Accounting Standards Board<br />
of Japan. In accordance with the standard, the Company and<br />
some of its consolidated subsidiaries recorded a gain which was<br />
the difference between the present value of the future obligations<br />
for retirement benefit plans and the pension plan assets, which<br />
were related to the dissolution, and unamortized actuarial losses<br />
corresponding to the dissolved portion of present value of the<br />
future obligations charged to income.<br />
As a result of adopting the accounting standard, gain on<br />
winding up of the non-contributory defined benefit pension plan<br />
amounted to ¥28,564 million ($257,333 thousand) and it was recognized<br />
as special gains for the fiscal period ended September 30,<br />
2003.<br />
As a part of management reforms, many of the Company’s<br />
employees transferred to the Company’s subsidiaries in accordance<br />
with the transition toward the new personnel system on<br />
September 30, 2003.<br />
Also, the Company’s consolidated subsidiaries demolished<br />
their privately held pension plan and lump-sum severance and<br />
retirement payment plan on September 30, 2003. As a result, the<br />
Company and its consolidated subsidiaries reversed the severance<br />
and retirement benefits for employees amounted to ¥34,814<br />
million ($313,640 thousand) for the payment of lump-sum<br />
severance and retirement payment, and also recognized loss on<br />
partial termination of privately held pension plan and loss on partial<br />
termination of lump-sum severance and retirement payment<br />
plan as part of special losses amounted to ¥396 million ($3,568<br />
thousand), on September 30, 2003 in accordance with the Accounting<br />
Standard Implementation Guidance No. 1, “Implementation<br />
Guidance on Accounting Standard for the Transitions Between<br />
the Retirement Benefit Plans”, issued by the Accounting Standards<br />
Board of Japan.<br />
(j) SEVERANCE AND RETIREMENT BENEFITS FOR<br />
DIRECTORS AND <strong>CO</strong>RPORATE STATUTORY AUDITORS<br />
For directors and corporate statutory auditors, the Companies<br />
offer a lump-sum retirement benefit plan. The Companies accrue<br />
100% of amounts calculated based on the Companies’ retirement<br />
rules under the assumption that all directors and corporate<br />
statutory auditors retired from the Companies on the balance<br />
sheet date in order to prepare future payments of retirement<br />
benefits. Retirement benefits to be paid to directors and corporate<br />
statutory auditors are subject to an approval of the general meeting<br />
of stockholders before the retirement benefits are paid in accordance<br />
with the Code.<br />
(k) APPROPRIATION OF RETAINED EARNINGS<br />
Cash dividends and bonuses to directors and corporate statutory<br />
auditors are recorded in the fiscal period or year when the<br />
proposed appropriation of retained earnings is approved at the<br />
general meeting of stockholders.<br />
(l) STOCKHOLDERS’ EQUITY<br />
Under the Commercial Code of Japan, the entire amount of the<br />
issue price of shares is required to be accounted for as capital,<br />
although a company may, by resolution of its Board of Directors,<br />
account for an amount not exceeding one-half of the issue price of<br />
the new shares as additional paid-in capital, which is included in<br />
capital surplus.<br />
Effective October 1, 2001, the Commercial Code provides that<br />
an amount equal to at least 10% of cash dividends and other cash<br />
appropriations shall be appropriated and set aside as a legal<br />
earnings reserve until the total amount of legal earnings reserve<br />
and additional paid-in capital equals 25% of common stock. The<br />
legal earnings reserve and additional paid-in capital may be used<br />
to eliminate or reduce a deficit by resolution of the stockholders’<br />
meeting or may be capitalized by resolution of the Board of<br />
Directors. On condition that the total amount of legal earnings<br />
reserve and additional paid-in capital remains being equal to or<br />
exceeding 25% of common stock, they are available for distribution<br />
by resolution of the stockholders’ meeting. Legal earnings<br />
reserve is included in retained earnings. The maximum amount<br />
that the Company can distribute as dividends is calculated based on<br />
the non-consolidated financial statements of the Company in<br />
accordance with the Commercial Code.<br />
Effective from the period ended September 30, 2003, the components<br />
of the stockholders’ equity are presented in accordance<br />
with the change in Japanese disclosure requirements.<br />
(m) TREASURY STOCK AND REDUCTION OF STATUTORY<br />
RESERVES<br />
The Companies have adopted Accounting Standard No. 1,<br />
“Accounting Standard for Treasury Stock and Reduction of<br />
Statutory Reserves”, issued by the Accounting Standards Board of<br />
Japan on February 21, 2002.<br />
The effect on the accompanying consolidated financial<br />
statements would be immaterial.<br />
(n) AC<strong>CO</strong>UNTING FOR LEASES<br />
Finance lease transactions, except those leases for which the<br />
ownership of the leased assets is considered to be transferred to the<br />
lessee, are accounted for in the same manner as operating leases.<br />
(o) IN<strong>CO</strong>ME TAXES<br />
The Companies provide for income taxes applicable to all items<br />
included in the consolidated statements of income regardless of<br />
when such taxes are currently payable. Income taxes based on<br />
temporary differences between tax and financial reporting<br />
purposes are reflected as deferred income taxes in the consolidated<br />
financial statements using the asset and liability method.<br />
(p) NET IN<strong>CO</strong>ME PER SHARE<br />
Basic net income per share is computed by dividing income<br />
available to common stockholders by the weighted-average<br />
number of common shares outstanding for the period. Diluted net<br />
income per share reflects the potential dilution that could occur if<br />
securities or other contracts to issue common stock were<br />
exercised or converted into common stock.<br />
Effective February 1, 2003, the Company adopted the new<br />
accounting standard for earnings per share and related guidance<br />
(Accounting Standards Board Statement No. 2, “Accounting<br />
Standard for Earnings Per Share” and Financial Standards<br />
Implementation Guidance No. 4, “Implementation Guidance for<br />
Accounting Standard for Earnings Per Share”, issued by the<br />
Accounting Standards Board of Japan on September 25, 2002).<br />
20
The new accounting standard requires calculating net income<br />
available to common stockholders by deducting of amounts not<br />
belonging to common stock (e.g. bonuses to directors appropriated<br />
from retained earnings which is to be resolved at the annual<br />
3. TRANSLATION INTO UNITED STATES DOLLARS<br />
The accompanying consolidated financial statements are stated in<br />
Japanese yen. The translations of the Japanese yen amounts into<br />
U.S. dollars are included solely for the convenience of readers,<br />
using the prevailing exchange rate at September 30, 2003, which<br />
stockholders’ meeting held after the period-end) from net income<br />
to figure out the basis for the net income per share. The effect on<br />
net income per share by the adoption of the new accounting<br />
standard would be immaterial.<br />
was ¥111 to U.S.$1. The convenience translations should not be<br />
construed as representations that the Japanese yen amounts have<br />
been, could have been, or could in the future be, converted into<br />
U.S. dollars at this or any other rate of exchange.<br />
4. RE<strong>CO</strong>NCILIATION OF “CASH” AND “CASH AND CASH EQUIVALENTS”<br />
Millions of yen<br />
Thousands of<br />
U.S. dollars<br />
2003/9 2003/1 2003/9<br />
Cash shown in the consolidated balance sheet ................................................................................... ¥68,616 ¥64,754 $618,162<br />
Cash equivalents.................................................................................................................................. – – –<br />
Cash and cash equivalents................................................................................................................... ¥68,616 ¥64,754 $618,162<br />
5. INVENTORIES<br />
Inventories consist of the following:<br />
Thousands of<br />
Millions of yen<br />
U.S. dollars<br />
2003/9 2003/1 2003/9<br />
Merchandise ........................................................................................................................................ ¥50,911 ¥50,268 $458,658<br />
Work in progress ................................................................................................................................. 804 920 7,243<br />
Supplies ............................................................................................................................................... 326 378 2,937<br />
Total ......................................................................................................................................... ¥52,041 ¥51,566 $468,838<br />
6. SECURITIES<br />
(i) Acquisition costs, book value and fair value of securities with available fair value as of September 30 and January 31, 2003,<br />
are as follows:<br />
Held-to-maturity debt securities Millions of yen Thousands of U.S. dollars<br />
2003/9 2003/1 2003/9<br />
Book Fair Book Fair Book Fair<br />
value value Difference value value Difference value value Difference<br />
Securities with available fair value exceeding book value:<br />
Government bonds...................................................... ¥ – ¥ – ¥ – ¥ – ¥ – ¥ – $ – $ – $ –<br />
Corporate bonds.......................................................... 10,000 10,017 17 10,000 10,011 11 90,090 90,243 153<br />
Others.......................................................................... – – – – – – – – –<br />
Total.....................................................................¥10,000 ¥10,017 ¥17 ¥10,000 ¥10,011 ¥11 $90,090 $90,243 $153<br />
Securities with available fair value not exceeding<br />
book value:<br />
Government bonds...................................................... ¥ – ¥ – ¥ – ¥ – ¥ – ¥ – $– $– $ –<br />
Corporate bonds.......................................................... – – – – – – – – –<br />
Others.......................................................................... – – – – – – – – –<br />
Total..................................................................... ¥ – ¥ – ¥ – ¥ – ¥ – ¥ – $ – $ – $ –<br />
Available-for-sale securities Millions of yen Thousands of U.S. dollars<br />
2003/9 2003/1 2003/9<br />
Acquisition Book Acquisition Book Acquisition Book<br />
cost value Difference cost value Difference cost value Difference<br />
Securities with book value exceeding acquisition costs:<br />
Equity securities.......................................................... ¥2,176 ¥5,937 ¥3,761 ¥917 ¥3,229 ¥2,312 $19,604 $53,487 $33,883<br />
Bonds........................................................................... – – – – – – – – –<br />
Others.......................................................................... – – – – – – – – –<br />
Total..................................................................... ¥2,176 ¥5,937 ¥3,761 ¥917 ¥3,229 ¥2,312 $19,604 $53,487 $33,883<br />
Securities with book value not exceeding<br />
acquisition costs:<br />
Equity securities.......................................................... ¥7,700 ¥5,101 ¥(2,599) ¥8,948 ¥5,720 ¥(3,228) $69,369 $45,955 $(23,414)<br />
Bonds........................................................................... – – – – – – – – –<br />
Others.......................................................................... – – – – – – – – –<br />
Total..................................................................... ¥7,700 ¥5,101 ¥(2,599) ¥8,948 ¥5,720 ¥(3,228) $69,369 $45,955 $(23,414)<br />
21
(ii) Book values of securities with no available fair value as of September 30 and January 31, 2003, are as follows:<br />
Thousands of<br />
Available-for-sale securities Millions of yen U.S. dollars<br />
2003/9 2003/1 2003/9<br />
Book value<br />
Non-listed equity securities (over-the-counter securities are excluded) ............................................ ¥166 ¥204 $1,495<br />
(iii) Book values of securities by contractual maturities for securities classified as held-to-maturity as of September 30 and January 31, 2003,<br />
are as follows:<br />
Held-to-maturity debt securities Millions of yen Thousands of U.S. dollars<br />
2003/9 2003/1 2003/9<br />
Due within Due after one year Due within Due after one year Due within Due after one year<br />
one year through five years one year through five years one year through five years<br />
Government bonds..................................... ¥ – ¥ – ¥ – ¥ – $ – $ –<br />
Corporate bonds......................................... 10,000 – – 10,000 90,090 –<br />
Others ........................................................ – – – – – –<br />
Total ............................................... ¥10,000 ¥ – ¥ – ¥10,000 $90,090 $ –<br />
(iv) No available-for-sale securities were sold for the period ended September 30, 2003. For the year ended January 31, 2003, total sales of<br />
available-for-sale securities amounted to ¥147 million and related losses amounted to ¥48 million.<br />
7. PREPAID RENTS AND LEASE DEPOSITS<br />
The Company operates a number of stores under various lease<br />
arrangements. Typically, the Company advances the costs of construction<br />
of a store to the lessor and, upon completion of construction,<br />
leases the property for an initial period of generally 20 years.<br />
Approximately 30% of the construction advance is considered a<br />
lease deposit, refundable at the end of the lease term. The remaining<br />
portion of the advance is refundable in installments over the<br />
second half of the lease term together with nominal interest. The<br />
Company accounts for this remaining portion as prepaid rents in<br />
the accompanying consolidated financial statements. Rent<br />
payments under store leases are normally fixed amounts that are<br />
renegotiated every two or three years.<br />
8. SHORT-TERM LOANS AND LONG-TERM DEBT<br />
(a) Short-term loans including bank overdrafts at September 30 and January 31, 2003, consist of the following:<br />
Millions of yen<br />
Thousands of<br />
U.S. dollars<br />
2003/9 2003/1 2003/9<br />
Short-term loans.................................................................................................................................. ¥57,790 ¥46,100 $520,631<br />
The weighted-average interest rates applicable to the bank borrowings are 1.0% per annum in September 30, 2003, and 1.1% per<br />
annum in January 31, 2003.<br />
(b) Long-term debt at September 30 and January 31, 2003, consists of the following:<br />
Thousands of<br />
Millions of yen<br />
U.S. dollars<br />
2003/9 2003/1 2003/9<br />
1.70% unsecured bonds due in 2012 .................................................................................................. ¥ 20,000 ¥ 20,000 $ 180,180<br />
1.15% unsecured bonds due in 2009 .................................................................................................. 20,000 20,000 180,180<br />
0.99% unsecured bonds due in 2008 .................................................................................................. 40,000 40,000 360,360<br />
1.15% unsecured convertible bonds, convertible into common stock at ¥2,153.0 per share, due in 2012.. 39,839 39,839 358,910<br />
Unsecured loans from banks and an insurance company, 1.42% per annum .................................... 9,850 9,850 88,739<br />
Less current maturities........................................................................................................................ – – –<br />
Total ............................................................................................................................................. ¥129,689 ¥129,689 $1,168,369<br />
The annual maturities of long-term debt as of September 30, 2003, are as follows:<br />
Thousands of<br />
Millions of yen U.S. dollars<br />
2004 ......................................................................................................................................................................... ¥ 3,600 $ 32,432<br />
2005 ......................................................................................................................................................................... 2,000 18,018<br />
2006 ......................................................................................................................................................................... 2,750 24,775<br />
2007 ......................................................................................................................................................................... 1,500 13,513<br />
2008 and thereafter .................................................................................................................................................. 119,839 1,079,631<br />
Total.................................................................................................................................................................. ¥129,689 $1,168,369<br />
22
9. LEASES<br />
(a) Pro forma information relating to acquisition cost, accumulated depreciation and book values for property held under finance leases<br />
which do not transfer ownership of the leased property to the lessee on an “as if capitalized” basis for the period ended September 30,<br />
2003, and the year ended January 31, 2003, was as follows:<br />
Thousands of<br />
Millions of yen<br />
U.S. dollars<br />
2003/9 2003/1 2003/9<br />
Store fixtures and equipment<br />
Acquisition cost................................................................................................................................... ¥ 4,528 ¥ 4,573 $ 40,793<br />
Accumulated depreciation................................................................................................................... (2,257) (1,970) (20,333)<br />
Book value ........................................................................................................................................... ¥ 2,271 ¥ 2,603 $ 20,460<br />
(b) Future minimum lease payments under finance leases as of September 30 and January 31, 2003, were as follows:<br />
Millions of yen<br />
Thousands of<br />
U.S. dollars<br />
2003/9 2003/1 2003/9<br />
Due within one year ............................................................................................................................ ¥ 903 ¥ 950 $ 8,135<br />
Due after one year ............................................................................................................................... 1,368 1,653 12,324<br />
Total................................................................................................................................................. ¥2,271 ¥2,603 $20,459<br />
The pro forma information above does not exclude the imputed interest portion from the acquisition cost because the remaining<br />
finance lease obligations are not material compared with the book value of property and equipment.<br />
(c) Total payments for finance lease transactions without ownership transfer to lessees for the period ended September 30, 2003, and the<br />
year ended January 31, 2003, were as follows:<br />
Thousands of<br />
Millions of yen<br />
U.S. dollars<br />
2003/9 2003/1 2003/9<br />
Lease payments.................................................................................................................................... ¥682 ¥1,025 $6,144<br />
Depreciation expense .......................................................................................................................... 682 1,025 6,144<br />
(d) The minimum rental commitments under noncancellable operating leases as of September 30 and January 31, 2003,<br />
were as follows:<br />
Thousands of<br />
Millions of yen<br />
U.S. dollars<br />
2003/9 2003/1 2003/9<br />
(As lessee)<br />
Due within one year ........................................................................................................................ ¥ 3,991 ¥ 4,110 $ 35,955<br />
Due after one year ........................................................................................................................... 21,110 26,855 190,180<br />
Total ............................................................................................................................................. ¥25,101 ¥30,965 $226,135<br />
(As lessor)<br />
Due within one year ........................................................................................................................ ¥316 ¥316 $2,847<br />
Due after one year ........................................................................................................................... 379 590 3,414<br />
Total ............................................................................................................................................. ¥695 ¥906 $6,261<br />
10. SEVERANCE AND RETIREMENT BENEFITS FOR EMPLOYEES<br />
The Company and its consolidated subsidiaries had adopted a Also, the Company’s consolidated subsidiaries demolished the<br />
non-contributory defined pension plan supported by the privately held pension plan and the lump-sum severance and<br />
government, a privately held pension plan and a lump-sum retirement payment plan, and many of the Company’s employees<br />
severance and retirement plan as defined benefit plans for transferred to the subsidiaries in accordance with the transition<br />
employees.<br />
toward the new personnel system as a part of management<br />
In connection with enforcement of the Defined Benefit reforms on September 30, 2003.<br />
Enterprise Pension Law, the Company and some of its As a result, the Company’s privately held pension plan and<br />
consolidated subsidiaries received approval from the Minister of lump-sum severance and retirement payment plan only exist on<br />
Health, Labor and Welfare for winding up the non-contributory September 30, 2003.<br />
defined benefit pension plan supported by the government and The liabilities for severance and retirement benefits included in<br />
exemption from payment of future benefits on March 18 and the liability section of the consolidated balance sheets as of<br />
September 26, 2003.<br />
September 30 and January 31, 2003, consist of the following:<br />
23
Millions of yen<br />
Thousands of<br />
U.S. dollars<br />
2003/9 2003/1 2003/9<br />
(a) Present value of the future obligations .......................................................................................... ¥ (6,320) ¥(149,076) $ (56,937)<br />
(b) Pension plan assets........................................................................................................................ 22,317 61,367 201,054<br />
(c) Unfunded obligations of severance and retirement benefits ((a)+(b)) ......................................... 15,997 (87,709) 144,117<br />
(d) Unrecognized actuarial losses ....................................................................................................... 1,560 43,359 14,054<br />
(e) Subtotal ((c)+(d)).......................................................................................................................... 17,557 (44,350) 158,171<br />
(f) Prepaid pension expense............................................................................................................... 18,857 6,041 169,883<br />
(g) Severance and retirement benefits for employees ((e)–(f)) .......................................................... ¥ (1,300) ¥ (50,391) $ (11,712)<br />
Severance and retirement benefit costs included in the consolidated statements of income for the period ended September 30, 2003,<br />
and the year ended January 31, 2003, are comprised of the following:<br />
Thousands of<br />
Millions of yen<br />
U.S. dollars<br />
2003/9 2003/1 2003/9<br />
Service costs ........................................................................................................................................ ¥2,187 ¥ 4,890 $19,702<br />
Interest costs........................................................................................................................................ 1,322 3,826 11,910<br />
Expected return on plan assets............................................................................................................ (573) (1,953) (5,162)<br />
Amortization of actuarial gains and losses .......................................................................................... 1,201 2,041 10,820<br />
Severance and retirement benefit costs for employees........................................................................ ¥4,137 ¥ 8,804 $37,270<br />
Gain on winding up of the non-contributory defined benefit pension plan....................................... ¥(28,564) ¥ – $(257,333)<br />
Loss on partial termination of privately held pension plan and loss on partial termination<br />
of lump-sum severance and retirement payment plan ...................................................................... 396 – 3,568<br />
In addition to the above, the Company and its consolidated subsidiaries recognized special termination benefits paid to employees,<br />
which consist of premium severance pay, etc., amounted to ¥14,901 million ($134,243 thousand) as part of special losses.<br />
The discount rate and the rate of expected return on plan assets used by the Companies are 2.0% and 2.5%, respectively.<br />
The estimated amount of all severance and retirement benefits to be paid in the future is allocated equally to each service year using the<br />
estimated number of total service years.<br />
11. IN<strong>CO</strong>ME TAXES<br />
The Companies are subject to a number of income taxes, which, in the aggregate, indicate a statutory rate in Japan of approximately<br />
40.5% for the period ended September 30, 2003, and 42.1% for the years ended January 31, 2003 and 2002.<br />
(a) Significant components of the Companies’ deferred income tax assets and liabilities as of September 30 and January 31, 2003,<br />
were as follows:<br />
Thousands of<br />
Millions of yen<br />
U.S. dollars<br />
2003/9 2003/1 2003/9<br />
Deferred income tax assets:<br />
Retirement benefits.......................................................................................................................... ¥ – ¥13,618 $ –<br />
Depreciation .................................................................................................................................... 4,470 4,447 40,270<br />
Accrued bonuses.............................................................................................................................. 2,644 – 23,820<br />
Unrealized profits for property and equipment transferred among the Companies ....................... 2,515 2,306 22,658<br />
Accrued enterprise tax..................................................................................................................... – 826 –<br />
Tax loss carry forward ..................................................................................................................... 16,354 821 147,333<br />
Allowance for doubtful accounts..................................................................................................... 1,399 1,044 12,604<br />
Other ............................................................................................................................................... 3,762 4,006 33,892<br />
Gross deferred income tax assets................................................................................................. 31,144 27,068 280,577<br />
Valuation allowance..................................................................................................................... (691) (394) (6,225)<br />
Total deferred income tax assets .............................................................................................. 30,453 26,674 274,352<br />
Deferred income tax liabilities:<br />
Deferred gains on sales of property and equipment ........................................................................ (4,763) (4,608) (42,910)<br />
Prepaid pension expense ................................................................................................................. (8,625) – (77,703)<br />
Reserve for special depreciation ...................................................................................................... (2,299) (2,255) (20,712)<br />
Profits on installment sales.............................................................................................................. (259) (712) (2,333)<br />
Other ............................................................................................................................................... (1,117) (19) (10,063)<br />
Total deferred income tax liabilities......................................................................................... (17,063) (7,594) (153,721)<br />
Net deferred income tax assets ............................................................................................ ¥13,390 ¥19,080 $120,631<br />
24
(b) The reconciliation between the Japanese statutory tax rate and the Company’s effective tax rate for the period ended September 30, 2003, is<br />
summarized as follows:<br />
Statutory tax rate................................................................................................................................................................................. 42.1 %<br />
Non-deductible expenses.................................................................................................................................................................... 0.5<br />
Non-taxable dividend income............................................................................................................................................................. (0.5)<br />
Unrealized taxable income of deficit subsidiary ................................................................................................................................. 2.7<br />
Per capita inhabitants’ tax................................................................................................................................................................... 0.9<br />
Adjustment on deferred tax assets due to change of income tax rate................................................................................................. 0.9<br />
Other ................................................................................................................................................................................................... 3.2<br />
Effective tax rate.......................................................................................................................................................................... 49.8 %<br />
Disclosure of the reconciliation between the statutory tax rate and the effective tax rate for the year ended January 31, 2003, is omitted since<br />
the difference is immaterial.<br />
(c) Change in effective tax rates to be used in calculating deferred taxes due to the revised local tax law<br />
The aggregate statutory income tax rate used for calculation of deferred income tax assets and liabilities was 42.1% for the years<br />
ended January 31, 2003 and 2002. According to the Act for Partial Revision of Local Tax Law proclaimed March 31, 2003, the<br />
statutory effective tax rate, which is used for calculation of deferred tax assets and liabilities relating to temporary differences for the<br />
periods after April 1, 2004, is changed from 42.1% to 40.5%. The effect of this change is immaterial.<br />
(d) Change in effective tax rates to be used in calculating deferred taxes due to the revised Tokyo Metropolitan Bylaw (changed after September 30, 2003)<br />
According to the Partial Revision of Tokyo Metropolitan Bylaw proclaimed October 14, 2003, the statutory effective tax rate, which<br />
is used for calculation of deferred tax assets and liabilities relating to temporary differences for the periods after April 1, 2004, is<br />
changed from 40.5% to 40.7%. The effect of this change is immaterial.<br />
12. <strong>CO</strong>NTINGENT LIABILITIES<br />
The Companies were contingently liable at September 30, 2003, for the following:<br />
Thousands of<br />
Millions of yen U.S. dollars<br />
Loan guarantees made for employees.......................................................................................................................... ¥24 $216<br />
13. NET IN<strong>CO</strong>ME PER SHARE<br />
Effective February 1, 2003, the Company adopted the new<br />
accounting standard for earnings per share and related guidance<br />
(Accounting Standards Board Statement No. 2, “Accounting<br />
Standard for Earnings Per Share” and Financial Standards<br />
Implementation Guidance No. 4, “Implementation Guidance for<br />
Accounting Standard for Earnings Per Share”, issued by the<br />
Accounting Standards Board of Japan on September 25, 2002).<br />
Reconciliation of the difference between basic and diluted net<br />
income per share (“EPS”) for the period ended September 30,<br />
2003, is as follows:<br />
Period ended September 30, 2003<br />
Thousands<br />
Millions of yen of shares Yen U.S. Dollars<br />
Weightedaverage<br />
number<br />
Net income of shares EPS<br />
Net income................................................................................................................... ¥6,154<br />
Amounts not belonged to common stock<br />
(Bonuses to directors from retained earnings)....................................................... 58<br />
Basic EPS<br />
Net income available to common stockholders ....................................................... 6,096 353,810 ¥17 $0.15<br />
Effect of dilutive securities<br />
Convertible bonds .................................................................................................... 179 18,503<br />
Diluted EPS<br />
Net income for computation .................................................................................... 6,275 372,313 17 0.15<br />
The information above was not required to be disclosed by the Ministry of Finance Ordinance for the years ended January 31, 2003 and 2002.<br />
14. SEGMENT INFORMATION<br />
The Companies operate principally in two business segments,<br />
Merchandising and Credit and Consumer Services.<br />
Merchandising involves the sale of apparel, luxury and<br />
accessory goods, furniture and household appliances and<br />
foodstuffs. Credit and Consumer Services involve finance charges<br />
earned on installment sales, annual fees for the Marui Card and<br />
the Akai Card and consumer loans—principally cash dispensing<br />
services and general purpose loans—and referral and agency<br />
services for travel, driving schools, insurance and others. Credit<br />
and Consumer Services revenues consist of commissions and<br />
interest income on consumer loans.<br />
Other segment revenues include interior design, construction and<br />
advertising services; information processing services and sales of<br />
computer software; and transportation services. Intersegment prices<br />
are determined by negotiations between the parties involved.<br />
25
Operating income includes revenues less operating expenses<br />
but excluding general corporate expenses, interest expenses,<br />
unrealized foreign currency exchange gain (loss), other income<br />
and provision for income taxes. Identifiable assets are those assets<br />
used in the Companies’ operations in each segment. Corporate assets<br />
consist principally of cash, deposits and short-term investments.<br />
Millions of yen<br />
Period ended September 30, 2003<br />
Credit and<br />
Merchan- Consumer Corporate or<br />
dising Services Other Total Elimination Consolidated<br />
Operating revenues:<br />
Outside customers.............................................. ¥273,713 ¥43,927 ¥35,768 ¥353,408 ¥ – ¥353,408<br />
Intersegment ...................................................... – – 29,534 29,534 (29,534) –<br />
Total................................................................ 273,713 43,927 65,302 382,942 (29,534) 353,408<br />
Operating expenses................................................ 268,303 35,075 61,321 364,699 (27,300) 337,399<br />
Operating income .................................................. ¥ 5,410 ¥ 8,852 ¥ 3,981 ¥ 18,243 ¥ (2,234) ¥ 16,009<br />
Identifiable assets ................................................... ¥309,534 ¥290,056 ¥65,617 ¥665,207 ¥68,950 ¥734,157<br />
Depreciation and amortization............................... 9,697 1,741 1,371 12,809 (567) 12,242<br />
Capital expenditures,<br />
including lease advances...................................... 9,875 1,534 940 12,349 (669) 11,680<br />
Millions of yen<br />
Year ended January 31, 2003<br />
Credit and<br />
Merchan- Consumer Corporate or<br />
dising Services Other Total Elimination Consolidated<br />
Operating revenues:<br />
Outside customers.............................................. ¥444,013 ¥64,926 ¥49,928 ¥558,867 ¥ – ¥558,867<br />
Intersegment ...................................................... – – 40,563 40,563 (40,563) –<br />
Total................................................................ 444,013 64,926 90,491 599,430 (40,563) 558,867<br />
Operating expenses................................................ 428,798 47,355 84,943 561,096 (36,546) 524,550<br />
Operating income .................................................. ¥ 15,215 ¥17,571 ¥ 5,548 ¥ 38,334 ¥ (4,017) ¥ 34,317<br />
Identifiable assets ................................................... ¥296,606 ¥284,278 ¥68,757 ¥649,641 ¥80,260 ¥729,901<br />
Depreciation and amortization............................... 14,351 2,664 2,377 19,392 (612) 18,780<br />
Capital expenditures,<br />
including lease advances...................................... 21,260 3,473 1,237 25,970 (1,004) 24,966<br />
Thousands of U.S. dollars<br />
Period ended September 30, 2003<br />
Credit and<br />
Merchan- Consumer Corporate or<br />
dising Services Other Total Elimination Consolidated<br />
Operating revenues:<br />
Outside customers........................................... $2,465,883 $395,739 $322,234 $3,183,856 $ – $3,183,856<br />
Intersegment.................................................... – – 266,072 266,072 (266,072) –<br />
Total ............................................................. 2,465,883 395,739 588,306 3,449,928 (266,072) 3,183,856<br />
Operating expenses ............................................. 2,417,144 315,991 552,442 3,285,577 (245,946) 3,039,631<br />
Operating income................................................ $ 48,739 $ 79,748 $ 35,864 $ 164,351 $ (20,126) $ 144,225<br />
Identifiable assets ................................................ $2,788,595 $2,613,117 $591,144 $5,992,856 $621,171 $6,614,027<br />
Depreciation and amortization............................ 87,360 15,685 12,351 115,396 (5,108) 110,288<br />
Capital expenditures,<br />
including lease advances ................................... 88,964 13,820 8,468 111,252 (6,027) 105,225<br />
15. SUBSEQUENT EVENT<br />
The following appropriations of retained earnings were approved at the annual general meeting of the stockholders held on<br />
December 25, 2003:<br />
Thousands of<br />
Millions of yen U.S. dollars<br />
Cash dividends (¥15=$0.14 per share) ......................................................................................................................... ¥5,272 $47,495<br />
Bonuses to directors ...................................................................................................................................................... 58 522<br />
26
INDEPENDENT AUDITORS’ REPORT<br />
To the Stockholders and Board of Directors of<br />
Marui Co., Ltd.<br />
We have audited the accompanying consolidated balance sheets of Marui Co., Ltd. (a Japanese corporation)<br />
and its consolidated subsidiaries as of September 30, 2003, and January 31, 2003, and the related<br />
consolidated statements of income, stockholders’ equity and cash flows for the period ended September 30,<br />
2003, and the two years in the period ended January 31, 2003 and 2002, expressed in Japanese yen. These<br />
consolidated financial statements are the responsibility of the Company’s management. Our responsibility is<br />
to express an opinion on these consolidated financial statements based on our audits.<br />
We conducted our audits in accordance with auditing standards generally accepted in Japan. Those standards<br />
require that we plan and perform the audit to obtain reasonable assurance about whether the financial<br />
statements are free of material misstatement. An audit includes examining, on a test basis, evidence<br />
supporting the amounts and disclosures in the financial statements. An audit also includes assessing the<br />
accounting principles used and significant estimates made by management, as well as evaluating the overall<br />
financial statement presentation. We believe that our audits provide a reasonable basis for our opinion.<br />
In our opinion, the consolidated financial statements referred to above present fairly, in all material respects,<br />
the consolidated financial position of Marui Co., Ltd. and its consolidated subsidiaries as of September 30,<br />
2003, and January 31, 2003, and the consolidated results of their operations and their cash flows for the<br />
period ended September 30, 2003, and the two years in the period ended January 31, 2003 and 2002, in<br />
conformity with accounting principles generally accepted in Japan as described in Note 1 to the consolidated<br />
financial statements.<br />
Without qualifying our opinion, we draw attention to Note 2 to the consolidated financial statements; Marui<br />
Co., Ltd. and its consolidated subsidiaries have adopted the new Japanese accounting standards for severance<br />
and retirement benefits for employees and financial instruments in the year ended January 31, 2002.<br />
The consolidated financial statements as of and for the period ended September 30, 2003, have been translated<br />
into United States dollars solely for the convenience of the reader. We have recomputed the translation and,<br />
in our opinion, the consolidated financial statements expressed in Japanese yen have been translated into<br />
United States dollars on the basis set forth in Note 3 to the consolidated financial statements.<br />
Tokyo, Japan<br />
December 25, 2003<br />
27
STORE INFORMATION<br />
(As of January 31, 2004)<br />
STORE LOCATIONS<br />
Kawagoe<br />
4<br />
Omiya<br />
Tokorozawa<br />
Family Shiki<br />
Kawaguchi<br />
Soka<br />
10 Kashiwa<br />
Koriyama<br />
Mito 14<br />
Tsuchiura<br />
Kobe Marui Numazu<br />
13 Shizuoka<br />
Nanba<br />
Ikebukuro<br />
Kitasenju Marui<br />
11 2<br />
mini Tachikawa Kichijoji<br />
City Ueno<br />
Shinjuku<br />
7<br />
1<br />
8 Kinshicho<br />
Hachioji Family Kokubunji Nakano<br />
Yurakucho<br />
5 Shibuya<br />
Family<br />
Mizonokuchi<br />
3<br />
Oimachi<br />
Tsudanuma<br />
9<br />
Machida<br />
12 Kawasaki<br />
City Yokohama<br />
6<br />
15 Family Ebina<br />
Totsuka 16<br />
Fujisawa<br />
Number of stores: 29<br />
Newly opened store<br />
Scheduled store opening<br />
Closed store<br />
Scheduled store closure<br />
NEWLY OPENED STORE<br />
NEW STORES SCHEDULED FOR OPENING<br />
Kobe Marui<br />
(Opened in October 2003)<br />
Kitasenju Marui<br />
(Scheduled to open in February 2004)<br />
Yurakucho Store<br />
(Scheduled to open in spring 2007)<br />
Nanba Store<br />
(Scheduled to open in autumn 2006)<br />
*Store designing in progress<br />
MAJOR STORES<br />
1<br />
Shinjuku Store<br />
City Shinjuku<br />
Men Shinjuku Field Shinjuku Young Shinjuku One Shinjuku in The Room<br />
28
2 City Ueno<br />
3 Family Mizonokuchi<br />
4 Omiya Store 5 Shibuya Store<br />
City Shibuya<br />
Young Shibuya<br />
6 City Yokohama 7 Family Kokubunji 8 Kinshicho Store<br />
9<br />
Machida Store<br />
be Machida<br />
mini Machida<br />
10<br />
Kashiwa Store<br />
11<br />
Ikebukuro Store<br />
12<br />
Kawasaki Store<br />
Marui Kashiwa<br />
VAT<br />
City Ikebukuro<br />
in The Room<br />
13<br />
Shizuoka Store<br />
14<br />
Mito Store<br />
15<br />
Family Ebina<br />
16<br />
Totsuka Store<br />
Marui Shizuoka<br />
Keyaki Plaza Shizuoka<br />
29
<strong>MARUI</strong> GROUP <strong>CO</strong>MPANIES<br />
(As of October 1, 2003)<br />
TRANSPORTATION<br />
Moving Co., Ltd.*<br />
This company, a 92.7%-owned subsidiary of<br />
Marui Co., Ltd., provides delivery of merchandise<br />
for Marui and other companies as well as general<br />
transportation services, such as parcel delivery<br />
and moving.<br />
Head Office:<br />
1-28-11, Shinjuku, Shinjuku-ku,<br />
Tokyo 160-0022, Japan<br />
Incorporated: October 1960<br />
Capitalization: ¥1,450 million<br />
Number of Employees: 1,179<br />
* Consolidated subsidiary<br />
CASHING AND CREDIT-CARD-RELATED SERVICES<br />
Zero First Co., Ltd.*<br />
This company, a wholly owned subsidiary of<br />
Marui Co., Ltd., operates roadside branches that<br />
provide cashing and other credit-card-related<br />
services and travel agency services.<br />
Head Office:<br />
5-49-4, Chuo, Nakano-ku,<br />
Tokyo 164-8606, Japan<br />
Incorporated: February 1991<br />
Capitalization: ¥300 million<br />
Number of Employees: 949<br />
BUILDING SECURITY AND MAINTENANCE<br />
CSC Co., Ltd.*<br />
This company, a 78.6%-owned subsidiary of<br />
Marui Co., Ltd., handles building security and<br />
maintenance for Marui and other companies.<br />
Head Office:<br />
4-60-3, Chuo, Nakano-ku,<br />
Tokyo 164-0011, Japan<br />
Incorporated: July 1987<br />
Capitalization: ¥490 million<br />
Number of Employees: 578<br />
ADVERTISING AND DISPLAY<br />
AIM Create Co., Ltd.*<br />
This company, a wholly owned subsidiary of<br />
Marui Co., Ltd., handles advertising, design and<br />
display of commercial facilities, and public relations<br />
for Marui and other companies.<br />
Head Office:<br />
3-31-1, Nakano, Nakano-ku,<br />
Tokyo 164-0001, Japan<br />
Incorporated: August 1959<br />
Capitalization: ¥100 million<br />
Number of Employees: 425<br />
INFORMATION PROCESSING SERVICES<br />
M&C Systems Co., Ltd.*<br />
This company, a wholly owned subsidiary of<br />
Marui Co., Ltd., provides information processing<br />
services and sells computer software that it develops<br />
for use in credit and marketing management.<br />
Head Office:<br />
1-16-18, Minami-Ikebukuro,<br />
Toshima-ku, Tokyo 171-0022, Japan<br />
Incorporated: September 1984<br />
Capitalization: ¥100 million<br />
Number of Employees: 185<br />
ENTERTAINMENT SOFTWARE PRODUCTS<br />
Virgin Megastores Japan Ltd.<br />
This company, a wholly owned subsidiary of<br />
Marui Co., Ltd., is an exciting and innovative<br />
retailer of entertainment software products and<br />
was established as a joint venture with the Virgin<br />
Group, of the U.K.<br />
Head Office:<br />
2nd floor, Kishino Building,<br />
3-30-13, Nishi-Ikebukuro, Toshima-ku,<br />
Tokyo 171-0021, Japan<br />
Incorporated: June 1990<br />
Capitalization: ¥100 million<br />
Number of Employees: 222<br />
30
ADMINISTRATIVE SERVICES<br />
Marui Smart Support Co., Ltd.*<br />
This company, a wholly owned subsidiary of<br />
Marui Co., Ltd., provides administrative services<br />
for Marui Group companies and Marui stores.<br />
Head Office:<br />
4-3-2, Nakano, Nakano-ku,<br />
Tokyo 164-8701, Japan<br />
Incorporated: January 2003<br />
Capitalization: ¥100 million<br />
Number of Employees: 626<br />
SALES<br />
Marui Fashion Freak Co., Ltd.*<br />
This company, a wholly owned subsidiary of<br />
Marui Co., Ltd., operates Marui’s women’s and<br />
children’s fashion private brand shops, including<br />
ru and tasse tasse, and Marui’s women’s shoe, bag,<br />
and accessory shops.<br />
Head Office:<br />
4-3-2, Nakano, Nakano-ku,<br />
Tokyo 164-8701, Japan<br />
Incorporated: February 1996<br />
Capitalization: ¥100 million<br />
Number of Employees: 2,261<br />
Marui M’s Mode Co., Ltd.*<br />
This company, a wholly owned subsidiary of<br />
Marui Co., Ltd., operates Marui’s men’s fashion<br />
and sports private brand shops, including<br />
Visaruno and ON BOARD.<br />
Head Office:<br />
4-3-2, Nakano, Nakano-ku,<br />
Tokyo 164-8701, Japan<br />
Incorporated: February 2001<br />
Capitalization: ¥100 million<br />
Number of Employees: 1,527<br />
Marui Access Co., Ltd.*<br />
This company, a wholly owned subsidiary of<br />
Marui Co., Ltd., operates Marui’s watch, eyeglass,<br />
accessory, and interior goods specialty shops.<br />
Head Office:<br />
4-3-2, Nakano, Nakano-ku,<br />
Tokyo 164-8701, Japan<br />
Incorporated: December 1971<br />
Capitalization: ¥100 million<br />
Number of Employees: 973<br />
Marui Seasoning Co., Ltd.*<br />
This company, a wholly owned subsidiary of<br />
Marui Co., Ltd., operates Marui’s sales floor of<br />
foodstuffs.<br />
Head Office:<br />
4-3-2, Nakano, Nakano-ku,<br />
Tokyo 164-8701, Japan<br />
Incorporated: May 2003<br />
Capitalization: ¥100 million<br />
Number of Employees: 139<br />
LOGISTICS SUPPORT<br />
Marui Kit Center Co., Ltd.<br />
This company, a wholly owned subsidiary of<br />
Marui Co., Ltd., sorts certain product inventories<br />
and store supplies.<br />
Head Office:<br />
2nd Building, Toda Shohin Center,<br />
2-5-1, Bijyogi Higashi, Toda-shi,<br />
Saitama 335-8792, Japan<br />
Incorporated: October 2003<br />
Capitalization: ¥10 million<br />
Number of Employees: 20<br />
31
BOARD OF DIRECTORS<br />
(As of December 25, 2003)<br />
Tadao Aoi<br />
President<br />
President<br />
Tadao Aoi<br />
Executive Vice President<br />
Chuzaburo Aoi<br />
Senior Managing Director<br />
Yoneaki Sakai<br />
Managing Directors<br />
Takeshi Kida<br />
Hiroshi Aoi<br />
Ryoichi Horiuchi<br />
Directors<br />
Kyojiro Kitade<br />
Shigeru Omori<br />
Yuji Kawashita<br />
Tatsuya Shinose<br />
Corporate Auditors<br />
Yasuyuki Watanabe<br />
Shozo Uchino<br />
Yukihisa Inamura<br />
Sumio Yoshizawa<br />
Chuzaburo Aoi<br />
Executive Vice President<br />
Yoneaki Sakai<br />
Senior Managing Director<br />
Takeshi Kida<br />
Managing Director<br />
Hiroshi Aoi<br />
Managing Director<br />
Ryoichi Horiuchi<br />
Managing Director<br />
Kyojiro Kitade<br />
Director<br />
Shigeru Omori<br />
Director<br />
Yuji Kawashita<br />
Director<br />
Tatsuya Shinose<br />
Director<br />
32
<strong>CO</strong>RPORATE DATA<br />
(As of September 30, 2003)<br />
INVESTOR INFORMATION<br />
(As of September 30, 2003)<br />
Head Office<br />
Stock Listing<br />
4-3-2, Nakano, Nakano-ku, Tokyo 164-8701, Japan<br />
Tel: (03) 3384-0101<br />
Fax: (03) 5343-6640<br />
URL: http://www.0101.co.jp<br />
Date of Foundation<br />
February 17, 1931<br />
Date of Establishment<br />
March 30, 1937<br />
Consolidated Stockholders’ Equity<br />
¥414,456 million<br />
Common Stock<br />
Authorized: 1,400,000 thousand shares<br />
Issued: 368,660 thousand shares<br />
Number of Employees (Consolidated)<br />
9,181<br />
Sales Floor Space<br />
488,875 m 2<br />
Tokyo Stock Exchange<br />
Transfer Agent<br />
UFJ Trust Bank Limited<br />
1-4-3, Marunouchi, Chiyoda-ku, Tokyo 100-0005, Japan<br />
Composition of Stockholders<br />
By number of stockholders<br />
Financial Institutions<br />
Security Companies<br />
Other Companies and Institutions<br />
Major Stockholders (Top 5)<br />
Japan Trustee Services Bank, Ltd.<br />
The Master Trust Bank of Japan, Ltd.<br />
The Bank of Tokyo-Mitsubishi, Ltd.<br />
Nippon Life Insurance Company<br />
The Chase Manhattan Bank, N.A. London<br />
Stock Price/Trading Volume<br />
By number of stocks held<br />
Foreign Investors<br />
Individuals and Other<br />
Treasury Stock<br />
2,000<br />
(¥)<br />
1,500<br />
1,000<br />
500<br />
0<br />
50,000<br />
(Thousand shares)<br />
25,000<br />
0<br />
’03/2 ’03/3 ’03/4 ’03/5 ’03/6 ’03/7 ’03/8 ’03/9<br />
Marui’s Head Office<br />
Photographs of board of directors by Sanae Numata<br />
Other major photographs by Nobuyuki Suzuki<br />
33
<strong>MARUI</strong> <strong>CO</strong>., <strong>LTD</strong>.<br />
Head Office: 4-3-2, Nakano, Nakano-ku, Tokyo 164-8701, Japan<br />
Tel: (03) 3384-0101 Fax: (03) 5343-6640 URL: http://www.0101.co.jp<br />
Printed in Japan