MARUI CO., LTD.
MARUI CO., LTD.
MARUI CO., LTD.

You also want an ePaper? Increase the reach of your titles
YUMPU automatically turns print PDFs into web optimized ePapers that Google loves.
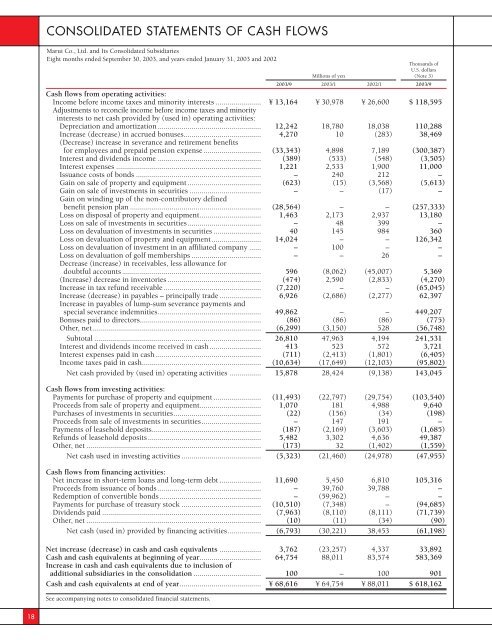
<strong>CO</strong>NSOLIDATED STATEMENTS OF CASH FLOWS<br />
Marui Co., Ltd. and Its Consolidated Subsidiaries<br />
Eight months ended September 30, 2003, and years ended January 31, 2003 and 2002<br />
Thousands of<br />
U.S. dollars<br />
Millions of yen (Note 3)<br />
2003/9 2003/1 2002/1 2003/9<br />
Cash flows from operating activities:<br />
Income before income taxes and minority interests ....................... ¥ 13,164 ¥ 30,978 ¥ 26,600 $ 118,595<br />
Adjustments to reconcile income before income taxes and minority<br />
interests to net cash provided by (used in) operating activities:<br />
Depreciation and amortization .................................................... 12,242 18,780 18,038 110,288<br />
Increase (decrease) in accrued bonuses....................................... 4,270 10 (283) 38,469<br />
(Decrease) increase in severance and retirement benefits<br />
for employees and prepaid pension expense ............................. (33,343) 4,898 7,189 (300,387)<br />
Interest and dividends income .................................................... (389) (533) (548) (3,505)<br />
Interest expenses ......................................................................... 1,221 2,533 1,900 11,000<br />
Issuance costs of bonds ............................................................... – 240 212 –<br />
Gain on sale of property and equipment ..................................... (623) (15) (3,568) (5,613)<br />
Gain on sale of investments in securities .................................... – – (17) –<br />
Gain on winding up of the non-contributory defined<br />
benefit pension plan .................................................................. (28,564) – – (257,333)<br />
Loss on disposal of property and equipment............................... 1,463 2,173 2,937 13,180<br />
Loss on sale of investments in securities..................................... – 48 399 –<br />
Loss on devaluation of investments in securities ........................ 40 145 984 360<br />
Loss on devaluation of property and equipment......................... 14,024 – – 126,342<br />
Loss on devaluation of investment in an affiliated company ...... – 100 – –<br />
Loss on devaluation of golf memberships ................................... – – 26 –<br />
Decrease (increase) in receivables, less allowance for<br />
doubtful accounts...................................................................... 596 (8,062) (45,007) 5,369<br />
(Increase) decrease in inventories ............................................... (474) 2,590 (2,833) (4,270)<br />
Increase in tax refund receivable ................................................. (7,220) – – (65,045)<br />
Increase (decrease) in payables – principally trade ..................... 6,926 (2,686) (2,277) 62,397<br />
Increase in payables of lump-sum severance payments and<br />
special severance indemnities.................................................... 49,862 – – 449,207<br />
Bonuses paid to directors............................................................. (86) (86) (86) (775)<br />
Other, net..................................................................................... (6,299) (3,150) 528 (56,748)<br />
Subtotal .................................................................................... 26,810 47,963 4,194 241,531<br />
Interest and dividends income received in cash.......................... 413 523 572 3,721<br />
Interest expenses paid in cash ..................................................... (711) (2,413) (1,801) (6,405)<br />
Income taxes paid in cash............................................................ (10,634) (17,649) (12,103) (95,802)<br />
Net cash provided by (used in) operating activities ................ 15,878 28,424 (9,138) 143,045<br />
Cash flows from investing activities:<br />
Payments for purchase of property and equipment ........................ (11,493) (22,797) (29,754) (103,540)<br />
Proceeds from sale of property and equipment............................... 1,070 181 4,988 9,640<br />
Purchases of investments in securities............................................ (22) (156) (34) (198)<br />
Proceeds from sale of investments in securities.............................. – 147 191 –<br />
Payments of leasehold deposits....................................................... (187) (2,169) (3,603) (1,685)<br />
Refunds of leasehold deposits ......................................................... 5,482 3,302 4,636 49,387<br />
Other, net ........................................................................................ (173) 32 (1,402) (1,559)<br />
Net cash used in investing activities ........................................ (5,323) (21,460) (24,978) (47,955)<br />
Cash flows from financing activities:<br />
Net increase in short-term loans and long-term debt ..................... 11,690 5,450 6,810 105,316<br />
Proceeds from issuance of bonds .................................................... – 39,760 39,788 –<br />
Redemption of convertible bonds ................................................... – (59,962) – –<br />
Payments for purchase of treasury stock ........................................ (10,510) (7,348) – (94,685)<br />
Dividends paid ................................................................................ (7,963) (8,110) (8,111) (71,739)<br />
Other, net ........................................................................................ (10) (11) (34) (90)<br />
Net cash (used in) provided by financing activities................. (6,793) (30,221) 38,453 (61,198)<br />
Net increase (decrease) in cash and cash equivalents ..................... 3,762 (23,257) 4,337 33,892<br />
Cash and cash equivalents at beginning of year............................... 64,754 88,011 83,574 583,369<br />
Increase in cash and cash equivalents due to inclusion of<br />
additional subsidiaries in the consolidation .................................. 100 – 100 901<br />
Cash and cash equivalents at end of year......................................... ¥ 68,616 ¥ 64,754 ¥ 88,011 $ 618,162<br />
See accompanying notes to consolidated financial statements.<br />
18