MARUI CO., LTD.
MARUI CO., LTD.
MARUI CO., LTD.

You also want an ePaper? Increase the reach of your titles
YUMPU automatically turns print PDFs into web optimized ePapers that Google loves.
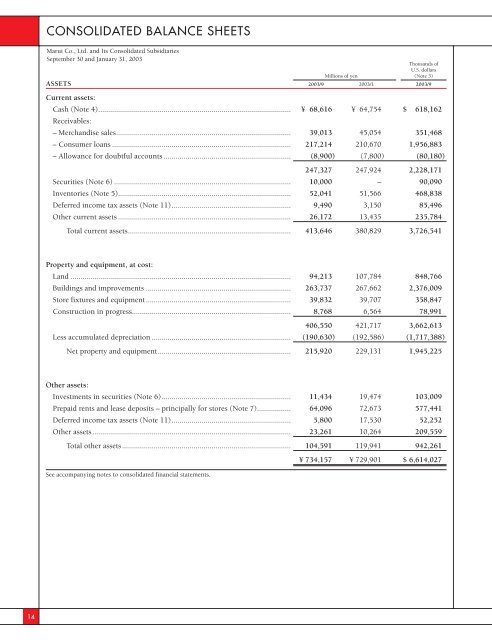
<strong>CO</strong>NSOLIDATED BALANCE SHEETS<br />
Marui Co., Ltd. and Its Consolidated Subsidiaries<br />
September 30 and January 31, 2003<br />
Thousands of<br />
U.S. dollars<br />
Millions of yen (Note 3)<br />
ASSETS 2003/9 2003/1 2003/9<br />
Current assets:<br />
Cash (Note 4)................................................................................................. ¥ 68,616 ¥ 64,754 $ 618,162<br />
Receivables:<br />
– Merchandise sales........................................................................................ 39,013 45,054 351,468<br />
– Consumer loans .......................................................................................... 217,214 210,670 1,956,883<br />
– Allowance for doubtful accounts ................................................................ (8,900) (7,800) (80,180)<br />
247,327 247,924 2,228,171<br />
Securities (Note 6) ......................................................................................... 10,000 – 90,090<br />
Inventories (Note 5)....................................................................................... 52,041 51,566 468,838<br />
Deferred income tax assets (Note 11)............................................................ 9,490 3,150 85,496<br />
Other current assets ....................................................................................... 26,172 13,435 235,784<br />
Total current assets.................................................................................. 413,646 380,829 3,726,541<br />
Property and equipment, at cost:<br />
Land ............................................................................................................... 94,213 107,784 848,766<br />
Buildings and improvements ......................................................................... 263,737 267,662 2,376,009<br />
Store fixtures and equipment......................................................................... 39,832 39,707 358,847<br />
Construction in progress................................................................................ 8,768 6,564 78,991<br />
406,550 421,717 3,662,613<br />
Less accumulated depreciation ...................................................................... (190,630) (192,586) (1,717,388)<br />
Net property and equipment................................................................... 215,920 229,131 1,945,225<br />
Other assets:<br />
Investments in securities (Note 6)................................................................. 11,434 19,474 103,009<br />
Prepaid rents and lease deposits – principally for stores (Note 7)................. 64,096 72,673 577,441<br />
Deferred income tax assets (Note 11)............................................................ 5,800 17,530 52,252<br />
Other assets.................................................................................................... 23,261 10,264 209,559<br />
Total other assets..................................................................................... 104,591 119,941 942,261<br />
¥ 734,157 ¥ 729,901 $ 6,614,027<br />
See accompanying notes to consolidated financial statements.<br />
14