MARUI CO., LTD.
MARUI CO., LTD.
MARUI CO., LTD.

Create successful ePaper yourself
Turn your PDF publications into a flip-book with our unique Google optimized e-Paper software.
FINANCIAL REVIEW<br />
OPERATING RESULTS BY BUSINESS SEGMENT<br />
Merchandising<br />
In the eight-month fiscal period under review, ended<br />
September 30, 2003, Japan’s retail industry continued to be<br />
characterized by harsh business conditions. While certain<br />
sectors of the Japanese economy showed signs of recovery,<br />
as in the previous fiscal year consumer spending remained<br />
lackluster due to anxiety over job security and personal<br />
income. Also, the retail industry was adversely affected by<br />
an unseasonably cool summer followed by hot weather.<br />
In this business environment, Marui strengthened its<br />
competitiveness by remodeling existing stores to reflect the<br />
distinctive regional characteristics of each store’s location.<br />
Those efforts included a full remodeling of our store in<br />
Kokubunji, Tokyo. In addition, the Company sought to<br />
enhance store efficiency by significantly downsizing electric<br />
appliance sales areas with a view to eventual withdrawal<br />
from its electric appliance operations. Further, aiming to<br />
strengthen product lineups and the operation of food<br />
division sales areas, the Company established Marui<br />
Seasoning Co., Ltd., in May 2003. This new subsidiary is<br />
responsible for the management of food sales areas and<br />
related personnel at Marui stores.<br />
As a result of these initiatives, the merchandising segment<br />
posted operating revenues of ¥273.7 billion and operating<br />
income of ¥5.4 billion.<br />
With regard to store openings, in October 2003 we<br />
opened Kobe Marui—our first store in the Kansai region.<br />
Moreover, plans call for the opening of Marui’s largest-ever<br />
store, in Kitasenju in north Tokyo, in February 2004; a<br />
second Kansai region store in autumn 2006, in Nanba, Osaka;<br />
and a store in the Yurakucho district of central Tokyo in 2007.<br />
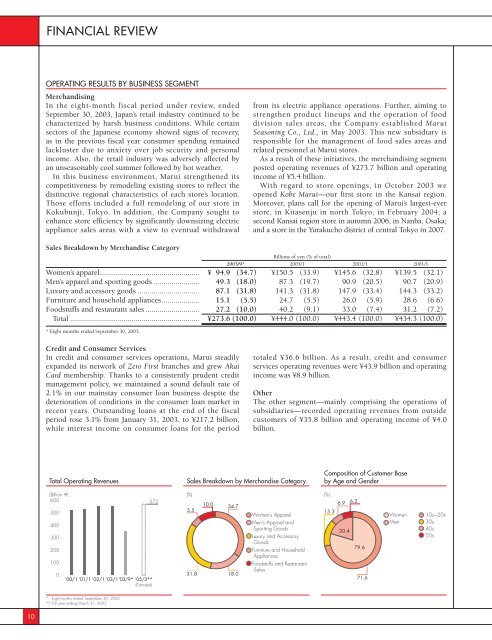
Sales Breakdown by Merchandise Category<br />
Billions of yen (% of total)<br />
2003/9* 2003/1 2002/1 2001/1<br />
Women’s apparel.................................................. ¥ 94.9 (34.7) ¥150.5 (33.9) ¥145.6 (32.8) ¥139.5 (32.1)<br />
Men’s apparel and sporting goods ....................... 49.3 (18.0) 87.3 (19.7) 90.9 (20.5) 90.7 (20.9)<br />
Luxury and accessory goods ............................... 87.1 (31.8) 141.3 (31.8) 147.9 (33.4) 144.3 (33.2)<br />
Furniture and household appliances................... 15.1 (5.5) 24.7 (5.5) 26.0 (5.9) 28.6 (6.6)<br />
Foodstuffs and restaurant sales ........................... 27.2 (10.0) 40.2 (9.1) 33.0 (7.4) 31.2 (7.2)<br />
Total ................................................................. ¥273.6 (100.0) ¥444.0 (100.0) ¥443.4 (100.0) ¥434.3 (100.0)<br />
* Eight months ended September 30, 2003.<br />
Credit and Consumer Services<br />
In credit and consumer services operations, Marui steadily<br />
expanded its network of Zero First branches and grew Akai<br />
Card membership. Thanks to a consistently prudent credit<br />
management policy, we maintained a sound default rate of<br />
2.1% in our mainstay consumer loan business despite the<br />
deterioration of conditions in the consumer loan market in<br />
recent years. Outstanding loans at the end of the fiscal<br />
period rose 3.1% from January 31, 2003, to ¥217.2 billion,<br />
while interest income on consumer loans for the period<br />
totaled ¥36.6 billion. As a result, credit and consumer<br />
services operating revenues were ¥43.9 billion and operating<br />
income was ¥8.9 billion.<br />
Other<br />
The other segment—mainly comprising the operations of<br />
subsidiaries—recorded operating revenues from outside<br />
customers of ¥35.8 billion and operating income of ¥4.0<br />
billion.<br />
Total Operating Revenues<br />
Sales Breakdown by Merchandise Category<br />
Composition of Customer Base<br />
by Age and Gender<br />
(Billion ¥)<br />
600<br />
500<br />
400<br />
300<br />
200<br />
100<br />
0<br />
’00/1 ’01/1 ’02/1 ’03/1’03/9* ’05/3**<br />
(Estimated)<br />
572<br />
(%)<br />
5.5<br />
31.8<br />
10.0<br />
34.7<br />
18.0<br />
Women’s Apparel<br />
Men’s Apparel and<br />
Sporting Goods<br />
Luxury and Accessory<br />
Goods<br />
Furniture and Household<br />
Appliances<br />
Foodstuffs and Restaurant<br />
Sales<br />
(%)<br />
6.9 6.2<br />
15.3<br />
20.4<br />
79.6<br />
71.6<br />
Women<br />
Men<br />
10s~20s<br />
30s<br />
40s<br />
50s<br />
* Eight months ended September 30, 2003<br />
** Full year ending March 31, 2005<br />
10