Belfast - Northern Ireland Housing Executive
Belfast - Northern Ireland Housing Executive
Belfast - Northern Ireland Housing Executive

You also want an ePaper? Increase the reach of your titles
YUMPU automatically turns print PDFs into web optimized ePapers that Google loves.
2.4 Social housing<br />
The housing need assessment 2012-2017 identified a need for 5,586 additional units in<br />
<strong>Belfast</strong> (see Appendix 3). Whilst, 409 social housing new build properties were<br />
completed in <strong>Belfast</strong> in 2012/13, demand for this tenure outstrips supply. Waiting lists<br />
continue to increase. In the year to March 2013, the most significant increase has<br />
been in single applicants. This trend may be attributable to the above noted<br />
changes to <strong>Housing</strong> Benefit. Waiting list statistics at March 2013 are detailed in Table<br />
3. Notable information includes:<br />
• 58% of waiting list applicants are in housing stress;<br />
• 49%of housing stress applicants are single households, 13% elderly and 38%<br />
families;<br />
• Allocations increased by 21% since March 2012;<br />
• Homelessness increased by 5% in the past year.<br />
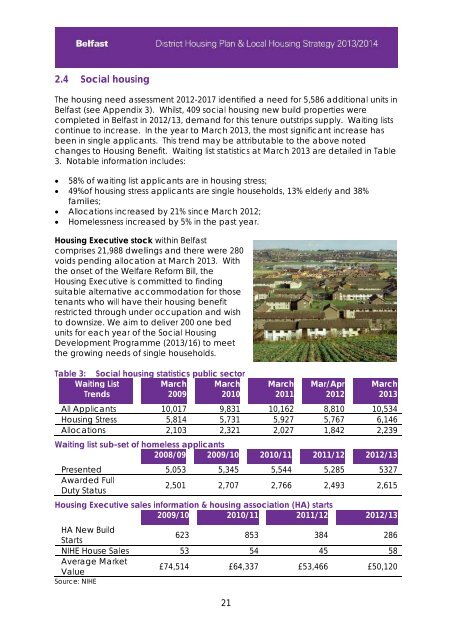
<strong>Housing</strong> <strong>Executive</strong> stock within <strong>Belfast</strong><br />
comprises 21,988 dwellings and there were 280<br />
voids pending allocation at March 2013. With<br />
the onset of the Welfare Reform Bill, the<br />
<strong>Housing</strong> <strong>Executive</strong> is committed to finding<br />
suitable alternative accommodation for those<br />
tenants who will have their housing benefit<br />
restricted through under occupation and wish<br />
to downsize. We aim to deliver 200 one bed<br />
units for each year of the Social <strong>Housing</strong><br />
Development Programme (2013/16) to meet<br />
the growing needs of single households.<br />
Table 3: Social housing statistics public sector<br />
Waiting List<br />
Trends<br />
March<br />
2009<br />
March<br />
2010<br />
March<br />
2011<br />
Mar/Apr<br />
2012<br />
March<br />
2013<br />
All Applicants 10,017 9,831 10,162 8,810 10,534<br />
<strong>Housing</strong> Stress 5,814 5,731 5,927 5,767 6,146<br />
Allocations 2,103 2,321 2,027 1,842 2,239<br />
Waiting list sub-set of homeless applicants<br />
2008/09 2009/10 2010/11 2011/12 2012/13<br />
Presented 5,053 5,345 5,544 5,285 5327<br />
Awarded Full<br />
Duty Status<br />
2,501 2,707 2,766 2,493 2,615<br />
<strong>Housing</strong> <strong>Executive</strong> sales information & housing association (HA) starts<br />
2009/10 2010/11 2011/12 2012/13<br />
HA New Build<br />
Starts<br />
NIHE House Sales<br />
Average Market<br />
Value<br />
Source: NIHE<br />
623<br />
53<br />
£74,514<br />
21<br />
853<br />
54<br />
£64,337<br />
384<br />
45<br />
£53,466<br />
286<br />
58<br />
£50,120