Download - Arthur L Davis Publishing
Download - Arthur L Davis Publishing
Download - Arthur L Davis Publishing
Create successful ePaper yourself
Turn your PDF publications into a flip-book with our unique Google optimized e-Paper software.
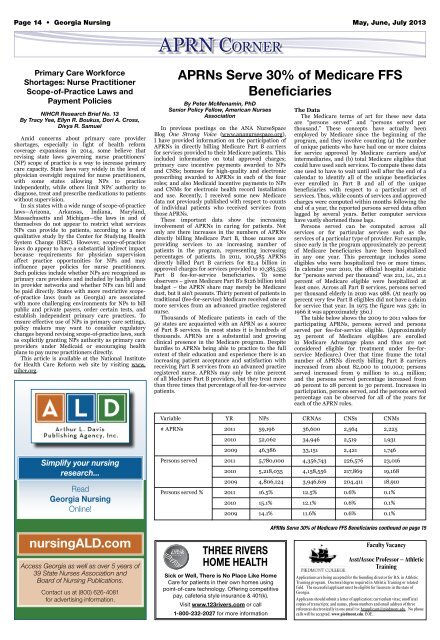
Page 14 • Georgia Nursing May, June, July 2013<br />
APRN Corner<br />
Primary Care Workforce<br />
Shortages: Nurse Practitioner<br />
Scope-of-Practice Laws and<br />
Payment Policies<br />
NIHCR Research Brief No. 13<br />
By Tracy Yee, Ellyn R. Boukus, Dori A. Cross,<br />
Divya R. Samuel<br />
Amid concerns about primary care provider<br />
shortages, especially in light of health reform<br />
coverage expansions in 2014, some believe that<br />
revising state laws governing nurse practitioners’<br />
(NP) scope of practice is a way to increase primary<br />
care capacity. State laws vary widely in the level of<br />
physician oversight required for nurse practitioners,<br />
with some states allowing NPs to practice<br />
independently, while others limit NPs’ authority to<br />
diagnose, treat and prescribe medications to patients<br />
without supervision.<br />
In six states with a wide range of scope-of-practice<br />
laws—Arizona, Arkansas, Indiana, Maryland,<br />
Massachusetts and Michigan—the laws in and of<br />
themselves do not appear to restrict what services<br />
NPs can provide to patients, according to a new<br />
qualitative study by the Center for Studying Health<br />
System Change (HSC). However, scope-of-practice<br />
laws do appear to have a substantial indirect impact<br />
because requirements for physician supervision<br />
affect practice opportunities for NPs and may<br />
influence payer policies for nurse practitioners.<br />
Such policies include whether NPs are recognized as<br />
primary care providers and included by health plans<br />
in provider networks and whether NPs can bill and<br />
be paid directly. States with more restrictive scopeof-practice<br />
laws (such as Georgia) are associated<br />
with more challenging environments for NPs to bill<br />
public and private payers, order certain tests, and<br />
establish independent primary care practices. To<br />
ensure effective use of NPs in primary care settings,<br />
policy makers may want to consider regulatory<br />
changes beyond revising scope-of-practice laws, such<br />
as explicitly granting NPs authority as primary care<br />
providers under Medicaid or encouraging health<br />
plans to pay nurse practitioners directly.<br />
This article is available at the National Institute<br />
for Health Care Reform web site by visiting www.<br />
nihcr.org.<br />
APRNs Serve 30% of Medicare FFS<br />
Beneficiaries<br />
By Peter McMenamin, PhD<br />
Senior Policy Fellow, American Nurses<br />
Association<br />
In previous postings on the ANA NurseSpace<br />
Blog One Strong Voice (www.ananursespace.org),<br />
I have provided information on the participation of<br />
APRNs in directly billing Medicare Part B carriers<br />
for services provided to their Medicare patients. This<br />
included information on total approved charges;<br />
primary care incentive payments awarded to NPs<br />
and CNSs; bonuses for high-quality and electronic<br />
prescribing awarded to APRNs in each of the four<br />
roles; and also Medicaid incentive payments to NPs<br />
and CNMs for electronic health record installation<br />
and use. Recently, I received some new Medicare<br />
data not previously published with respect to counts<br />
of individual patients who received services from<br />
those APRNs.<br />
These important data show the increasing<br />
involvement of APRNs in caring for patients. Not<br />
only are there increases in the numbers of APRNs<br />
directly billing Medicare Part B, those nurses are<br />
providing services to an increasing number of<br />
patients in the program, representing increasing<br />
percentages of patients. In 2011, 100,585 APRNs<br />
directly billed Part B carriers for $2.4 billion in<br />
approved charges for services provided to 10,385,355<br />
Part B fee-for-service beneficiaries. To some<br />
observers – given Medicare Part B’s $126 billion total<br />
budget – the APRN share may merely be Medicare<br />
dust, but it ain’t peanuts. Thirty percent of patients in<br />
traditional (fee-for-service) Medicare received one or<br />
more services from an advanced practice registered<br />
nurse.<br />
Thousands of Medicare patients in each of the<br />
50 states are acquainted with an APRN as a source<br />
of Part B services. In most states it is hundreds of<br />
thousands. APRNs are a substantial and growing<br />
clinical presence in the Medicare program. Despite<br />
hurdles to APRNs being able to practice to the full<br />
extent of their education and experience there is an<br />
increasing patient acceptance and satisfaction with<br />
receiving Part B services from an advanced practice<br />
registered nurse. APRNs may only be nine percent<br />
of all Medicare Part B providers, but they treat more<br />
than three times that percentage of all fee-for-service<br />
patients.<br />
The Data<br />
The Medicare terms of art for these new data<br />
are “persons served” and “persons served per<br />
thousand.” These concepts have actually been<br />
employed by Medicare since the beginning of the<br />
program, and they involve counting (a) the number<br />
of unique patients who have had one or more claims<br />
for service approved by Medicare carriers and/or<br />
intermediaries, and (b) total Medicare eligibles that<br />
could have used such services. To compute these data<br />
one used to have to wait until well after the end of a<br />
calendar to identify all of the unique beneficiaries<br />
ever enrolled in Part B and all of the unique<br />
beneficiaries with respect to a particular set of<br />
services. Thus, while counts of services and approved<br />
charges were computed within months following the<br />
end of a year, the reported persons served data often<br />
lagged by several years. Better computer services<br />
have vastly shortened those lags.<br />
Persons served can be computed across all<br />
services or for particular services such as the<br />
services of a particular type of provider. For example,<br />
since early in the program approximately 20 percent<br />
of Medicare beneficiaries have been hospitalized<br />
in any one year. This percentage includes some<br />
eligibles who were hospitalized two or more times.<br />
In calendar year 2010, the official hospital statistic<br />
for “persons served per thousand” was 211, i.e., 21.1<br />
percent of Medicare eligible were hospitalized at<br />
least once. Across all Part B services, persons served<br />
per thousand elderly in 2010 was 988. (At nearly 99<br />
percent very few Part B eligibles did not have a claim<br />
for service that year. In 1975 the figure was 536; in<br />
1966 it was approximately 360.)<br />
The table below shows the 2009 to 2011 values for<br />
participating APRNs, persons served and persons<br />
served per fee-for-service eligible. (Approximately<br />
25 percent of Medicare eligibles are enrolled<br />
in Medicare Advantage plans and thus are not<br />
considered eligible for treatment under fee-forservice<br />
Medicare.) Over that time frame the total<br />
number of APRNs directly billing Part B carriers<br />
increased from about 82,000 to 100,000; persons<br />
served increased from 9 million to 10.4 million;<br />
and the persons served percentage increased from<br />
26 percent to 28 percent to 30 percent. Increases in<br />
participation, persons served, and the persons served<br />
percentage can be observed for all of the years for<br />
each of the APRN roles.<br />
Variable YR NPs CRNAs CNSs CNMs<br />
# APRNs 2011 59,196 36,600 2,564 2,225<br />
2010 52,062 34,946 2,519 1,931<br />
2009 46,386 33,151 2,421 1,746<br />
Simplify your nursing<br />
research...<br />
Read<br />
Georgia Nursing<br />
Online!<br />
nursingALD.com<br />
Access Georgia as well as over 5 years of<br />
39 State Nurses Association and<br />
Board of Nursing Publications.<br />
Contact us at (800) 626-4081<br />
for advertising information.<br />
Persons served 2011 5,780,000 4,356,743 226,576 23,016<br />
2010 5,218,035 4,158,556 217,869 19,168<br />
2009 4,806,124 3,946,619 204,411 18,910<br />
Persons served % 2011 16.5% 12.5% 0.6% 0.1%<br />
2010 15.1% 12.1% 0.6% 0.1%<br />
2009 14.1% 11.6% 0.6% 0.1%<br />
THREE RIVERS<br />
HOME HEALTH<br />
Sick or Well, There is No Place Like Home<br />
Care for patients in their own homes using<br />
point-of-care technology. Offering competitive<br />
pay, cafeteria style insurance & 401(k).<br />
Visit www.123rivers.com or call<br />
1-800-232-2027 for more information<br />
APRNs Serve 30% of Medicare FFS Beneficiaries continued on page 15<br />
Faculty Vacancy<br />
Asst/Assoc Professor – Athletic<br />
Training<br />
Applications are being accepted for the founding director for B.S. in Athletic<br />
Training program. Doctoral degree required in Athletic Training or related<br />
field. The successful applicant must be eligible for licensure in the state of<br />
Georgia.<br />
Applicants should submit a letter of application; curriculum vitae; unofficial<br />
copies of transcripts; and names, phone numbers and email address of three<br />
references electronically in one email to: hrapplicant@piedmont.edu. No phone<br />
calls will be accepted. www.piedmont.edu. EOE.


