No Place for Hate Crime - National Union of Students
No Place for Hate Crime - National Union of Students
No Place for Hate Crime - National Union of Students

Create successful ePaper yourself
Turn your PDF publications into a flip-book with our unique Google optimized e-Paper software.
<strong>No</strong> <strong>Place</strong> <strong>for</strong> <strong>Hate</strong><br />
Appendix 1 Student respondent pr<strong>of</strong>ile<br />
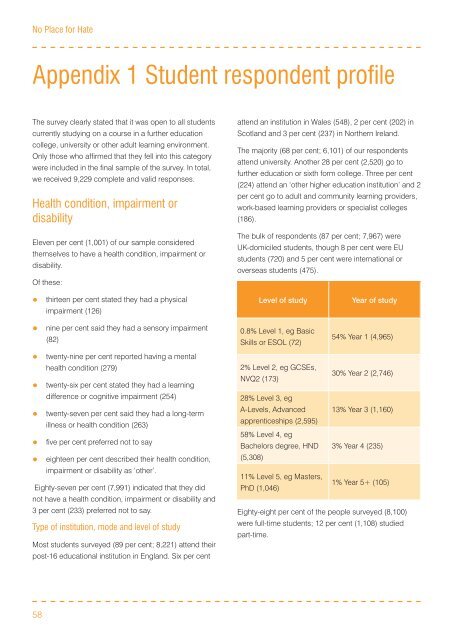
The survey clearly stated that it was open to all students<br />
currently studying on a course in a further education<br />
college, university or other adult learning environment.<br />
Only those who affirmed that they fell into this category<br />
were included in the final sample <strong>of</strong> the survey. In total,<br />
we received 9,229 complete and valid responses.<br />
Health condition, impairment or<br />
disability<br />
Eleven per cent (1,001) <strong>of</strong> our sample considered<br />
themselves to have a health condition, impairment or<br />
disability.<br />
Of these:<br />
• thirteen per cent stated they had a physical<br />
impairment (126)<br />
• nine per cent said they had a sensory impairment<br />
(82)<br />
• twenty-nine per cent reported having a mental<br />
health condition (279)<br />
• twenty-six per cent stated they had a learning<br />
difference or cognitive impairment (254)<br />
• twenty-seven per cent said they had a long-term<br />
illness or health condition (263)<br />
• five per cent preferred not to say<br />
•<br />
eighteen per cent described their health condition,<br />
impairment or disability as ‘other’.<br />
Eighty-seven per cent (7,991) indicated that they did<br />
not have a health condition, impairment or disability and<br />
3 per cent (233) preferred not to say.<br />
Type <strong>of</strong> institution, mode and level <strong>of</strong> study<br />
Most students surveyed (89 per cent; 8,221) attend their<br />
post-16 educational institution in England. Six per cent<br />
attend an institution in Wales (548), 2 per cent (202) in<br />
Scotland and 3 per cent (237) in <strong>No</strong>rthern Ireland.<br />
The majority (68 per cent; 6,101) <strong>of</strong> our respondents<br />
attend university. Another 28 per cent (2,520) go to<br />
further education or sixth <strong>for</strong>m college. Three per cent<br />
(224) attend an ‘other higher education institution’ and 2<br />
per cent go to adult and community learning providers,<br />
work-based learning providers or specialist colleges<br />
(186).<br />
The bulk <strong>of</strong> respondents (87 per cent; 7,967) were<br />
UK-domiciled students, though 8 per cent were EU<br />
students (720) and 5 per cent were international or<br />
overseas students (475).<br />
Level <strong>of</strong> study<br />
Year <strong>of</strong> study<br />
0.8% Level 1, eg Basic<br />
54% Year 1 (4,965)<br />
Skills or ESOL (72)<br />
2% Level 2, eg GCSEs,<br />
30% Year 2 (2,746)<br />
NVQ2 (173)<br />
28% Level 3, eg<br />
A-Levels, Advanced 13% Year 3 (1,160)<br />
apprenticeships (2,595)<br />
58% Level 4, eg<br />
Bachelors degree, HND 3% Year 4 (235)<br />
(5,308)<br />
11% Level 5, eg Masters,<br />
1% Year 5+ (105)<br />
PhD (1,046)<br />
Eighty-eight per cent <strong>of</strong> the people surveyed (8,100)<br />
were full-time students; 12 per cent (1,108) studied<br />
part-time.<br />
58