No Place for Hate Crime - National Union of Students
No Place for Hate Crime - National Union of Students
No Place for Hate Crime - National Union of Students

You also want an ePaper? Increase the reach of your titles
YUMPU automatically turns print PDFs into web optimized ePapers that Google loves.
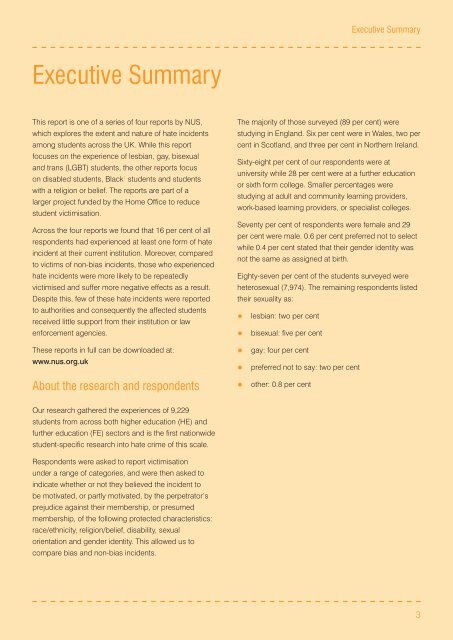
Executive Summary<br />
Executive Summary<br />
This report is one <strong>of</strong> a series <strong>of</strong> four reports by NUS,<br />
which explores the extent and nature <strong>of</strong> hate incidents<br />
among students across the UK. While this report<br />
focuses on the experience <strong>of</strong> lesbian, gay, bisexual<br />
and trans (LGBT) students, the other reports focus<br />
on disabled students, Black 1 students and students<br />
with a religion or belief. The reports are part <strong>of</strong> a<br />
larger project funded by the Home Office to reduce<br />
student victimisation.<br />
Across the four reports we found that 16 per cent <strong>of</strong> all<br />
respondents had experienced at least one <strong>for</strong>m <strong>of</strong> hate<br />
incident at their current institution. Moreover, compared<br />
to victims <strong>of</strong> non-bias incidents, those who experienced<br />
hate incidents were more likely to be repeatedly<br />
victimised and suffer more negative effects as a result.<br />
Despite this, few <strong>of</strong> these hate incidents were reported<br />
to authorities and consequently the affected students<br />
received little support from their institution or law<br />
en<strong>for</strong>cement agencies.<br />
These reports in full can be downloaded at:<br />
www.nus.org.uk<br />
About the research and respondents<br />
The majority <strong>of</strong> those surveyed (89 per cent) were<br />
studying in England. Six per cent were in Wales, two per<br />
cent in Scotland, and three per cent in <strong>No</strong>rthern Ireland.<br />
Sixty-eight per cent <strong>of</strong> our respondents were at<br />
university while 28 per cent were at a further education<br />
or sixth <strong>for</strong>m college. Smaller percentages were<br />
studying at adult and community learning providers,<br />
work-based learning providers, or specialist colleges.<br />
Seventy per cent <strong>of</strong> respondents were female and 29<br />
per cent were male. 0.6 per cent preferred not to select<br />
while 0.4 per cent stated that their gender identity was<br />
not the same as assigned at birth.<br />
Eighty-seven per cent <strong>of</strong> the students surveyed were<br />
heterosexual (7,974). The remaining respondents listed<br />
their sexuality as:<br />
• lesbian: two per cent<br />
•<br />
• gay: four per cent<br />
•<br />
• other: 0.8 per cent<br />
bisexual: five per cent<br />
preferred not to say: two per cent<br />
Our research gathered the experiences <strong>of</strong> 9,229<br />
students from across both higher education (HE) and<br />
further education (FE) sectors and is the first nationwide<br />
student-specific research into hate crime <strong>of</strong> this scale.<br />
Respondents were asked to report victimisation<br />
under a range <strong>of</strong> categories, and were then asked to<br />
indicate whether or not they believed the incident to<br />
be motivated, or partly motivated, by the perpetrator’s<br />
prejudice against their membership, or presumed<br />
membership, <strong>of</strong> the following protected characteristics:<br />
race/ethnicity, religion/belief, disability, sexual<br />
orientation and gender identity. This allowed us to<br />
compare bias and non-bias incidents.<br />
3