The humisery and other measures of summer discomfort - National ...
The humisery and other measures of summer discomfort - National ...
The humisery and other measures of summer discomfort - National ...

Create successful ePaper yourself
Turn your PDF publications into a flip-book with our unique Google optimized e-Paper software.
<strong>National</strong> Weather Digest<br />
THE HUMISERY AND OTHER MEASURES<br />
OF SUMMER DISCOMFORT<br />
by<br />
Martin Weiss<br />
852 Oxford Street<br />
Springfield, IL 62702<br />
1. INTRODUCTION in the Easterner's weather? Suppose it is<br />
90 deg rees with a dew point <strong>of</strong> 77 degrees<br />
Westerner: "I've been in temperatures<br />
Fahrenhe~t (relative humidity, 66 pernear<br />
100 degrees many times cent)? Does it feel like 95°F, lOGoF,<br />
back home, but I've never been 105°F?<br />
hotter than I am visiting your<br />
90 degree weather." A number <strong>of</strong> attempts have been made to<br />
provide such an estimate similar to the<br />
Easterner: "It's not the heat, it's the way the wind chill provides an estimate <strong>of</strong><br />
humidity." winter <strong>discomfort</strong> (see Section 3 below) .<br />
Unfor tunately, although the wind chill is<br />
<strong>The</strong> Easterner in this conversation is at- firmly established with the pUblic, none<br />
tempting to explain the Westerner I 5 dis- <strong>of</strong> the <strong>summer</strong> <strong>measures</strong> have gained anycomfort<br />
by telling why it feels so much thing <strong>of</strong> the wind chill's general accephotter<br />
than it is. <strong>The</strong> Easterner t 5 expla- tance. It is appropriate to examine the<br />
nation is fairly reasonable as far as it reasons for this situation.<br />
goes, but <strong>of</strong> course, it does not provide a<br />
measurement. How does the Westerner feel 2. WHY THE WIND CHILL INDEX WORKS<br />
Perhaps the strongest appeal <strong>of</strong> the wind<br />
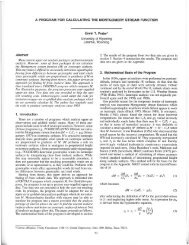
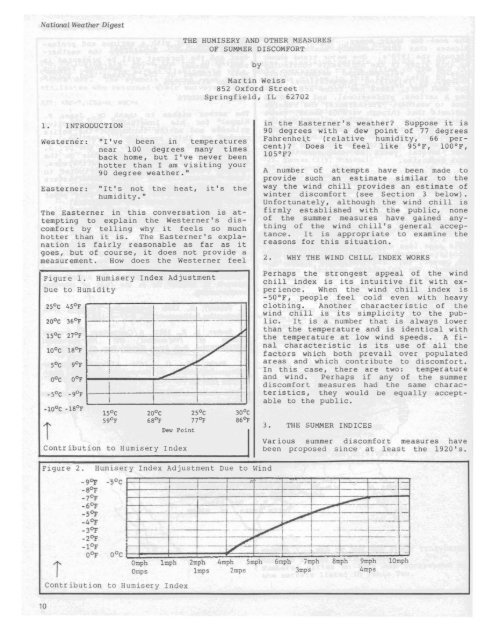
Figure 1. Humisery Index Adjustment<br />
chill index is its intuitive fit with ex-<br />
Due to Humidity perience. When the wind chill index is<br />
-50°F, people feel cold even with heavy<br />
2Soc 4Sor clothing. An<strong>other</strong> characteristic <strong>of</strong> the<br />
wind chill is its simplicity to the pub-<br />
20 0 e 360,- -------------f------- lie. It is a number that is always lower<br />
lsoe 270,-<br />
than the temperature <strong>and</strong> is identical with<br />
the temperature at low wind speeds. A fi-<br />
I , I nal characteristic is its use <strong>of</strong> all the<br />
lOoC 180,-<br />
/'<br />
-r- factors wnich both prevail over populated<br />
y<br />
Soc 90,- areas <strong>and</strong> which contribute to <strong>discomfort</strong>.<br />
I In this case, there are two: temperature<br />
I<br />
oOc 00,- -" I I <strong>and</strong> wind. Perhaps if any <strong>of</strong> the <strong>summer</strong><br />
I I <strong>discomfort</strong> <strong>measures</strong> had the same charac-<br />
-Soc -90,-<br />
- teristics, they would be equally accepti<br />
I i I able to the pUblic.<br />
·lOoC -ISoF<br />
lSoc 20 0 e 25°C 30 0 e<br />
59°F 6SoF 770,- 860,-<br />
3. THE SUMMER INDICES<br />
Dew Point<br />
I<br />
Contribution<br />
Var ious <strong>summer</strong> <strong>discomfort</strong> <strong>measures</strong> have<br />
to Humisery Index been proposed since at least the 1920's.<br />
Figure 2. Humisery Index Adjustment Due to Wind<br />
10<br />
-9Op -SoC .- - - 1-<br />
-8Op<br />
-7Op<br />
---<br />
-6Op<br />
-<br />
-SOp I<br />
-4Op<br />
---/ ---<br />
--<br />
-3Op ~-- I<br />
-- ---~-- --<br />
-2Op , -, ---- -<br />
./<br />
_1°F •<br />
-' -- 1--<br />
, .-<br />
r<br />
oOp OoC I<br />
Omph<br />
Contribution to lIumisery Index<br />
I<br />
-- -<br />
Imph 2mph 4mph 5mph 6mph 7mph 8mph 9mph 10mph<br />
Omps Imps 2mps 3mps 4mps
Volume 7 Number 2<br />
Figure 3. Humisery Index Adjustment<br />
Due to Elevation<br />
~1~oJkt P I ~<br />
Sea Level 1000ft 2000ft 3000ft 4000ft<br />
300 m 600 0 900 m 1200 m<br />
Elevation<br />
Contribution to Humisery Index<br />
Consider ing them one at a time, they are<br />
the "temperature-humidity index" (2), the<br />
"apparent temperature" (3), <strong>and</strong> the "Humiture"<br />
(4). Comparing them against the<br />
"wind chill" index st<strong>and</strong>ard will give some<br />
idea <strong>of</strong> their nature.<br />
3.a <strong>The</strong> Temperature-Humidity Index<br />
This index was the result <strong>of</strong> exper iments<br />
which attempted to establish what combinations<br />
<strong>of</strong> heat <strong>and</strong> humidity gave equivalent<br />
feelings <strong>of</strong> <strong>discomfort</strong>. Perhaps the<br />
greatest barrier to acceptance is its la~k<br />
<strong>of</strong> intuitive fit with experience. Th1s<br />
index is set up such that at 70°F, few<br />
people are uncomfortable <strong>and</strong> at 80°F,<br />
nearly everybody is uncomfortable. <strong>The</strong><br />
necessity <strong>of</strong> a double translation from index<br />
to percentage <strong>of</strong> people feeling uncomfortable<br />
to personal feeling <strong>of</strong> <strong>discomfort</strong><br />
is a severe h<strong>and</strong>icap. <strong>The</strong> index also<br />
does not consider wind or elevation. It<br />
continues to register, declining even at<br />
very low dew points, way outside the range<br />
<strong>of</strong> usefulness.<br />
3.b <strong>The</strong> Apparent Temperature<br />
<strong>The</strong> apparent temperature is the result <strong>of</strong><br />
experiments <strong>and</strong> jUdgments about <strong>discomfort</strong><br />
based on clothing <strong>and</strong> physiology. <strong>The</strong> index<br />
also predicts heat stress risk. <strong>The</strong><br />
intuitive fit <strong>of</strong> this index is very good;<br />
however it does not have a base <strong>and</strong> thus<br />
the apparent temperature occasionally<br />
drops below the actual temperature.<br />
A somewhat lesser problem is that apparent<br />
temperature is strongly based on relative<br />
humidity, a notoriously variable parameter.<br />
For example, in the case <strong>of</strong> the humid<br />
day previously noted (90°F temperature,<br />
77°F dew point), a 1 degree decline<br />
1n temperature will, at that dewpoint,<br />
cause more than a 1 percent increase in<br />
relative hum1dity. Because <strong>of</strong> its variability,<br />
relative humidity is considered a<br />
poor factor for use in calCUlating indices.<br />
3.c <strong>The</strong> Humiture Index<br />
This index also provides a good intuitive<br />
fit with <strong>discomfort</strong> but suffers from the<br />
same lack <strong>of</strong> basis as does the apparent<br />
temperature. Its most striking feature is<br />
its computational simplicity. One equation<br />
<strong>of</strong> humiture is that it is equal to<br />
temperature plus dew point mir:tus 65°F (or<br />
18° Celsius). It frequently 1S less than<br />
temperature, however, <strong>and</strong> perhaps ~ore seriously,<br />
it also continues to dec11ne even<br />
at very low dew points. Wind <strong>and</strong> elevation<br />
are not considered in this index.<br />
Notwithst<strong>and</strong>ing these minor weaknesses, it<br />
must be admitted that each <strong>of</strong> these indices<br />
gives information about heat <strong>and</strong> humidity<br />
that is no less meaningful than the<br />
wind chill index. Indeed, it may be only<br />
a lack <strong>of</strong> a strong public education campaign<br />
that is keeping the indices out <strong>of</strong><br />
general practice.<br />
Nonetheless, considering in detail all the<br />
factors that make the wind chill acceptable,<br />
<strong>and</strong> applying them to the <strong>summer</strong> <strong>discomfort</strong><br />
index, we should be able to produce<br />
a better notion <strong>of</strong> what an acceptable<br />
<strong>summer</strong> <strong>discomfort</strong> index should be like. I<br />
shall call this newly developed product<br />
the <strong>humisery</strong> index.<br />
4. A NEW SUMMER INDEX - HUMISERY<br />
Intuitively,<br />
should be in<br />
pIe get more<br />
a <strong>summer</strong> discomfor t index<br />
the 80s, 90s <strong>and</strong> 100s as peo<strong>and</strong><br />
more uncomfor table (when<br />
c..ụ.<br />
'Z' Figure 4.<br />
..<br />
Co<br />
c<br />
..~<br />
1007<br />
90<br />
80<br />
70<br />
60<br />
50<br />
40<br />
30<br />
o<br />
---- r----<br />
----<br />
~<br />
r---- ~<br />
~""'"<br />
-<br />
Relationship <strong>of</strong> Temperature, Dew Point <strong>and</strong> Relative Humidity<br />
]lOoC 15°C<br />
..........<br />
De"..<br />
_ 35°C<br />
30 0 e<br />
2S o e<br />
20 0 e<br />
Point<br />
Note:<br />
Temperature<br />
Valid at 1000mb only, but relatively close at 950<br />
mb.<br />
11
<strong>National</strong> Weather Digest<br />
working within the Fahrenheit scale). <strong>The</strong><br />
index should also be higher as the air becomes<br />
more humid, stagnant or thicker (the<br />
last with lower elevation). Although<br />
shade conditions, clothing, pollution,<br />
physiology, <strong>and</strong> physical activity also influence<br />
<strong>discomfort</strong>, such factors vary so<br />
widely between individuals <strong>and</strong> within<br />
short distances that they cannot be used<br />
in an index.<br />
dew point is unlikely to change much except<br />
in the unusual case <strong>of</strong> a swift frontal<br />
passage. Because <strong>of</strong> its stability, the<br />
dew point is an excellent measure upon<br />
which to base an index. <strong>The</strong> choice <strong>of</strong><br />
68°F is somewhat arbitrary, but it does<br />
seem the threshold <strong>of</strong> <strong>discomfort</strong> as well<br />
as a number which has a direct whole number<br />
equivalent in Celsius.<br />
Determining a good base for a <strong>summer</strong> <strong>discomfort</strong><br />
index must, <strong>of</strong> necessity be somewhat<br />
arbitrary or judgmental. <strong>The</strong> wind<br />
chill uses a 4 mph wind speed as its base,<br />
for exam Ie. Since 4 mph is a reasonable<br />
Figure 5.Discomfort (Temperature-Humidity)<br />
1l5Or<br />
110 I<br />
95<br />
105<br />
100<br />
90<br />
95<br />
90<br />
85<br />
85<br />
80-<br />
80<br />
75 .75<br />
60'7 65'7 70'7 75'7 800r 85'7<br />
De'W Point<br />
Note: Using dew point equation inReference 2<br />
Figure 6.<br />
Humiture<br />
115°F roo:::::-,..=--r-.:::::--.,....::::-~::-.....,<br />
110<br />
105<br />
100<br />
95<br />
90<br />
85<br />
80<br />
75<br />
De\O' Point<br />
Note: From dew point equation in Reference 4.<br />
brisk walking speed, then logically the<br />
wind chill index should actually be warmer<br />
than the air temperature when the wind is<br />
under 4 mph. <strong>The</strong> fact that it is not<br />
shows that a firm base line is perhaps<br />
more important than strict logic. A series<br />
<strong>of</strong> reasonable base line parameters<br />
that would support a <strong>summer</strong> <strong>discomfort</strong> index<br />
are 68°F (20°C) dew point, a 4 mph (2<br />
mps) wind <strong>and</strong> sea level elevation. Thus<br />
dew points below 68°F, or winds below 4<br />
mph are treated as equivalent to these<br />
values, as explained in the next paragraph.<br />
It is useful once more to stress<br />
why dew point, <strong>and</strong> not relative humidity,<br />
is the preferred measure <strong>of</strong> moisture.<br />
<strong>The</strong> dew point is the temperature at which<br />
water vapor will condense if moisture is<br />
neither added nor subtracted dur ing cooling.<br />
Over the course <strong>of</strong> a <strong>summer</strong> day, the<br />
<strong>The</strong> 4 mpn wind choice parallels the wind<br />
chill index wind speed base. <strong>The</strong> sea level<br />
elevation choice is defined on the basis<br />
that much <strong>of</strong> the population worldwide<br />
lives fairly close to that level.<br />
Figure 7.<br />
llsor<br />
110<br />
130<br />
03 105<br />
100 125<br />
c<br />
120<br />
-0<br />
"'0 115<br />
i"<br />
0 85<br />
100 10 ... 110<br />
'0<br />
..<br />
80 85<br />
1 5<br />
75<br />
Apparent Temperature<br />
60'7 .5'7 70°F 7~o.:; '0'7 85'7<br />
De"" Point<br />
Base on Figure 1 <strong>of</strong> Reference 3 <strong>and</strong> interpolation<br />
<strong>and</strong> conversion to dew point valid<br />
at sea level <strong>and</strong> 5.6 mph wind.<br />
Figure 8. Humisery<br />
110 1150r_<br />
~ 105<br />
.s 100<br />
~ 95<br />
~ 90<br />
fi 85<br />
.. 80<br />
75<br />
De'" Point<br />
From Figure 1-3 <strong>of</strong> this paper, valid at<br />
sea level <strong>and</strong> 5.6 mph wind.<br />
Now that the base line <strong>of</strong> the <strong>humisery</strong> index<br />
has been chosen, the next matter is to<br />
detail the effects <strong>of</strong> conditions that represent<br />
more <strong>discomfort</strong> than the base lines.<br />
Determining the effect the var ious factors<br />
have on the <strong>discomfort</strong> index is surely a<br />
most challenging task. <strong>The</strong> temperaturehumidity<br />
<strong>and</strong> apparent temperature indices<br />
represent a quasi-empirical approach, with<br />
the humiture being modified for calculational<br />
simplicity. For this reason, the<br />
<strong>humisery</strong> index should have values in the<br />
same range as these indices (or similar<br />
temperature-humidity index values at similar<br />
humiser ies) .<br />
An<strong>other</strong> useful feature <strong>of</strong> an index is that<br />
it is based on definitive physical values.<br />
A reasonable relation can be made to<br />
the rise in equivalent temperature (the<br />
12
Volume 7 Num ber 2<br />
Table lAo Moisture Adjustment<br />
Humlsery Based on Dew Point.<br />
Dew Point<br />
Below 20°C<br />
20<br />
21<br />
22<br />
23<br />
24<br />
25<br />
Dew Point<br />
26°C<br />
27<br />
28<br />
29<br />
30<br />
31<br />
Dew Point<br />
Below 68"F<br />
68<br />
69<br />
70<br />
71<br />
72<br />
73<br />
74<br />
75<br />
76<br />
Dew Point<br />
77"F<br />
78<br />
79<br />
80<br />
81<br />
82<br />
83<br />
84<br />
85<br />
86<br />
Ad iust~ent<br />
DOC<br />
o<br />
1<br />
3<br />
4<br />
6<br />
7<br />
Adiustment<br />
9°C<br />
11<br />
13<br />
14<br />
16<br />
18<br />
Adiustment<br />
0"F<br />
o<br />
1<br />
3<br />
4<br />
6<br />
7<br />
9<br />
11<br />
12<br />
Adiustment<br />
14°F<br />
16<br />
18<br />
19<br />
2l<br />
23<br />
25<br />
27<br />
28<br />
30<br />
(OC)<br />
Table lB. Moisture Adjustment (OF) to<br />
Humidity Based on Dew Point.<br />
temperature <strong>of</strong> an air parcel if all the<br />
latent heat was turned into sensible heat)<br />
<strong>and</strong> the rise in the <strong>humisery</strong> index as the<br />
dew point rises. This relationship <strong>and</strong><br />
<strong>other</strong>s are explained in physical terms in<br />
the following paragraphs, <strong>and</strong> in the <strong>humisery</strong><br />
index conversions in Tables 1 through<br />
4.<br />
As noted previously, the <strong>humisery</strong> index is<br />
based on physical values. Hopefully, such<br />
a basis will facilitate underst<strong>and</strong>ing.<br />
<strong>The</strong> overall equation for the <strong>humisery</strong> index<br />
is: Humisery index temperature +<br />
adjustment (dew point, wind <strong>and</strong> elevation).<br />
<strong>The</strong> adjustments are determined as follows:<br />
to<br />
At dew points aoove 68°F, (20°C), the dew<br />
point adjustment increases at 40 percent<br />
the rate that the equivalent temperature<br />
increases (see Figure 1). Obviously, one<br />
can call this a clumsy, reconciling assumption,<br />
even arbitrary. True, a judgment<br />
has been made. <strong>The</strong> alternative, however,<br />
is the huge expense <strong>of</strong> equipping<br />
laboratories, hiring experimental subjects,<br />
duplicating an enormous number <strong>of</strong><br />
environmental conditions <strong>and</strong> normalizing<br />
extraneous factors. Frankly, it would<br />
stretch the bounds <strong>of</strong> credibility if one<br />
claimed success in this endeavor. Indeed,<br />
the apparent temperature <strong>and</strong> humi ture index<br />
make no such claim, although vague<br />
reference to 'clothing science' etc., intrude<br />
there, too.<br />
<strong>The</strong> clumsy compromise <strong>of</strong> 40 percent is<br />
based, however, on a number <strong>of</strong> physical<br />
arguments. <strong>The</strong> main argument has to do<br />
with evaporation. Evaporation <strong>of</strong> perspiration<br />
is believed to be the main mechanism<br />
by which the numan body rids itself<br />
<strong>of</strong> heat dur ing the <strong>summer</strong>. For example,<br />
high relative humidity is considered a<br />
primary inhibitor <strong>of</strong> evaporation. On the<br />
<strong>other</strong> h<strong>and</strong>, at lower temperatures, even<br />
very high relative humidities do not increase<br />
the feeling <strong>of</strong> heat very much. In<br />
fact, because water is such a good heat<br />
conductor, loss <strong>of</strong> heat at low temperatures<br />
becomes accelerated at high humidities.<br />
This is why hiking in the rain can<br />
produce hyp<strong>other</strong>mia even at temperatures<br />
tens <strong>of</strong> degrees above freezing.<br />
Obviously, the wind is an equally difficult<br />
factor to consider in the adjustment.<br />
<strong>The</strong> mechanism by which wind cools a<br />
body in <strong>summer</strong> is much different from the<br />
wind cooling mechanism in winter. <strong>The</strong><br />
<strong>summer</strong> mechanism is the action <strong>of</strong> carrying<br />
away air molecules from the skin as they<br />
become saturated with water vapor due to<br />
body perspiration. <strong>The</strong> more wind, the<br />
more fresh unsaturated air is brought near<br />
the skin, thus increasing the rate <strong>of</strong><br />
evaporation <strong>and</strong> cooling. Even without<br />
evaporation, the wind carries away heat<br />
from the skin if the temperature is less<br />
than the skin temperature. Of course, the<br />
air temperature is so near the skin temperature<br />
in <strong>summer</strong> that this effect is<br />
fairly small. It is the enhancement <strong>of</strong><br />
evaporation that makes any breeze at all<br />
welcome on a hot, humid day. <strong>The</strong> adjustment<br />
due to wind is again a clumsy compromise<br />
(see Figure 2).· As stated previously,<br />
it is scientifically reasonable to<br />
have a lower <strong>humisery</strong> than temperature,<br />
but the confusion it causes to the general<br />
pUblic negates the scientific value.<br />
Thus, wind adjustment is subtracted from<br />
the dew point adjustment with the condition<br />
that remainders less than zero are<br />
set at zero.<br />
13
<strong>National</strong> Weather Digest<br />
Table 2A<br />
r-toisture Adjustment (0 C) to Humisery Based on Relative Humidity<br />
0<br />
;. 45°C oOC ,oC ,0C 12°C . . . .<br />
~ 42 0 2 , nOc 13°C 16°C · -<br />
~ 39 0 0 2 , S 11 14 16°, - -<br />
E 36 0 0 0 1 4 7 , 11 v.Oe 16°C<br />
-33 0 0 0 0 0 ) 4 7 11 13°C 16°C<br />
~ 30 0 0 0 0 0 0 1 3 , 7 11 13°C 14°C 15°J: 16<br />
::: 27 0 0 0 0 0 0 0 0 0 2 , , S , 10 11<br />
~ 24 0 0 0 0 0 0 0 0 0 0 0 1 3 4 , ,<br />
;, 21 0 0 0 0 0 0 0 0 0 0 0 0 0 0 1 I<br />
~<br />
:5% 30'j,<br />
507. 60% 65%<br />
70' m so, 85% 90% 95", laC<br />
" m<br />
'" Relative Humidity (irl pel"Cent)<br />
'" 40%<br />
Table 2B<br />
Moisture Adjustment (0 F) to Humisery Based on Relative Humidity<br />
Moisture Adjustment (in Degrees Fahrenheit) to Hucisery Based on Relative Humidity<br />
C; 115'1' 2°F S'" ts°F 22°F .<br />
{ 110 0 4 11 18<br />
.<br />
24'"<br />
~ 105 0 0 , 14 20 25°, 30°F ·<br />
"i 100 0 0 1 , 11 14 2l 26°F . .<br />
30'"<br />
t:.<br />
·<br />
95 0 0 0 0 4 S 14 18 22 27°F 300r ·<br />
90 0 0 0 0 0 2 , 10 14 18 22 25 0 r 29°F<br />
0<br />
"<br />
0<br />
• ~<br />
m 30% m 40%<br />
"<br />
Relative Humidity (in percent)<br />
,·<br />
SO 0 0 0 0 0 0 0 0 0 2 , 10 13 15 17 19<br />
0 0 0 0 0 0 0 3<br />
, 10 14 18 20 230r<br />
25'" IS'<br />
75 0 0 0 0 0 0 0 0 0 0 0 1 4 , , 10<br />
,,.,<br />
'" '0% m '0% m 70% m '" '0% '" 1001<br />
<strong>of</strong> vapor to replenish the water molecules<br />
Elevation is the last factor to be consid- lost to evaporation. In a near vacuum,<br />
ered in the adjustment. It is not nearly vapor would rapidly disperse from around a<br />
as important as the <strong>other</strong> factors since water droplet <strong>and</strong> never condense back. It<br />
most people live fairly near sea level, is partly this tendency to avoid the water<br />
but it does make a difference. At high stage that allows snow at high elevations<br />
elevation (<strong>and</strong> low pressure) there are to retain its powdery nature while snow at<br />
fewer molecules near a water surface; lower elevations gets packed more quickly<br />
thus, there is less chance <strong>of</strong> condensation (5) •<br />
Table 3A<br />
Wind Adjustment to Humisery<br />
Table 4A<br />
Elevation Adjustment to Humisery<br />
Wind Speed Elevation Ad iustment<br />
(met res / second) Adiustment<br />
Sea Level<br />
oOe<br />
0 mps oOe 300 metres -1<br />
1 0 600 metres -1<br />
2 0 900 metres -2<br />
3 -2 1200 metres -2<br />
4 -3 1500 metres -3<br />
5 or greater -4<br />
Table 3B<br />
wind Adjustment to Humisery<br />
Table 4B<br />
Elevation Adjustment to Humisery<br />
Wind Speed Elevation Ad iustment<br />
Miles lHour<br />
Ad iustment<br />
Sea Level<br />
OaF<br />
Under 4 mph OaF 1000 feet -1<br />
4 0 2000 feet -2<br />
5 -2 3000 feet -3<br />
6 -4 4000 feet -4<br />
7 -5 5000 feet -5<br />
8 -6<br />
9 -7<br />
10 mph or more -7<br />
-<br />
14
Volume 7 Number 2<br />
Table 5<br />
COr.lparison <strong>of</strong> Summer Oiscolilfort Indices<br />
Temp. Dew point Relative Temp. Apparent<br />
Narrative <strong>of</strong> <strong>of</strong> Humidity Humidity Temp. Humiture Humisery<br />
WARM 80<br />
Very Ory 50°F 35% 72 79 65 80<br />
Dry 60 50 74 81 75 80<br />
Humid 70 70 76 85 85 85<br />
Very Humid 80 100 80 91 95 96<br />
HOT 90<br />
very Dry 50 26 77 88 75 90<br />
Dry 60 36 79 91 85 90<br />
Humid 70 50 81 96 95 95<br />
Very Humid 80 70 85 106 105 106<br />
VERY HOT 100<br />
Very Dry 50 18 81 98 85 100<br />
Dry 60 26 83 102 95 100<br />
Humid 70 34 85 106 105 105<br />
Very Humid 80 52 89 115 115 116<br />
Westerner's<br />
Visit East 90 77 66 84 103 102 101<br />
Notes: Temperature Humidity Index from relative humidity equation (See Reference<br />
2) •<br />
Apparent temperature from Figure 1 <strong>of</strong> Reference 3, assumes sea level <strong>and</strong><br />
5.6 mph.<br />
Humiture from dew point equation <strong>of</strong> Reference 11.<br />
Humisery from Tables 1-4B, sea level 5.6 mph.<br />
<strong>The</strong> adjustment to elevation (Figure 3) is<br />
hence a very modest one. Once again,<br />
since the <strong>humisery</strong> 1S never lower than<br />
temperature, the elevation adjustment is<br />
suotracted from the dew point (or dew<br />
point minus wino) adjustment with the condition<br />
that rema1nders less than zero are<br />
set to zero.<br />
For example, if the dew point adjustment<br />
were 10, the wind adjustment -5 <strong>and</strong> the<br />
elevation adjustment were -1, the total<br />
adjustment would be 10 6 = 4. In the<br />
case <strong>of</strong> a dew point adjustment <strong>of</strong> 4 <strong>and</strong><br />
toe wind <strong>and</strong> elevation adjustments as before,<br />
the total adjustment would be 4 - 6<br />
= -2, set to O.<br />
Althougn the dew point is a better index<br />
<strong>of</strong> m01sture than relative humtdity because<br />
<strong>of</strong> smaller variability, it is not a value<br />
the public knows. See the chart in Figure<br />
4 for conversion <strong>of</strong> temperature <strong>and</strong> relative<br />
humidity into dew point.<br />
5. COMPARISON OF' INDICES<br />
To see<br />
tnoices<br />
useful.<br />
tnd tces<br />
to very<br />
humid.<br />
how tne var ious <strong>summer</strong> discornfor t<br />
compare, a tabular compar ison is<br />
Table 5 shows how the dlfferent<br />
change on days ranging from warm<br />
hot <strong>and</strong> from very dry to very<br />
A numbe r <strong>of</strong> notes on Table 5 are necessary.<br />
For one tning, it is given in the<br />
Fanrenneit scale (6). In addition, a wind<br />
speed (5.6 mph) ana elevation (sea level)<br />
must be assumed to calculate the apparent<br />
~emperature <strong>and</strong> <strong>humisery</strong>. <strong>The</strong> <strong>other</strong> two<br />
lnd1ces are, as explained oefore, not influenced<br />
by tnese factors. Table 5 does,<br />
however, illustrate the fact that the Humisery<br />
Index does not continue to decrease<br />
unaer very ary cond1tions (the <strong>other</strong>s do)<br />
while it increases witn very humid conditions<br />
at roughly the same rate as apparent<br />
temperature <strong>and</strong> humid1ty.<br />
15
<strong>National</strong> Weather Digest<br />
Table 6<br />
Comparative Mean July -<br />
August Humiseries<br />
July<br />
August<br />
SOUTHEAST<br />
(most uncomfortable)<br />
Port Arthur, TX<br />
Corpus Christi, TX<br />
Houston, TX<br />
Victoria, TX<br />
Lake Charles, LA<br />
Apalach iola, FL<br />
New Orleans, LA<br />
Key West, FL<br />
Shreveport, LA<br />
Tallahassee, FL<br />
SOUTHEAST (<strong>other</strong> large cities)<br />
Atlanta, GA<br />
Memphis, TN<br />
Miami, FL<br />
Dallas, TX<br />
WEST & SOUTHWEST<br />
Yuma, AZ<br />
Las Vegas, NV<br />
Bakersfield, CA<br />
Honolulu, HI<br />
OTHERS (East, Midwest, PRJ<br />
Kansas City, MO<br />
St. Louis, MO<br />
San Juan, PR<br />
Newark, NJ<br />
Washington (Natl) DC<br />
91<br />
91<br />
87<br />
89<br />
90<br />
87<br />
88<br />
88<br />
88<br />
86<br />
78<br />
82<br />
84<br />
85<br />
94<br />
89<br />
84<br />
80<br />
77<br />
79<br />
81<br />
76<br />
79<br />
94<br />
93<br />
94<br />
91<br />
90<br />
90<br />
89<br />
89<br />
88<br />
89<br />
77<br />
80<br />
87<br />
86<br />
93<br />
87<br />
82<br />
81<br />
77<br />
77<br />
81<br />
75<br />
77<br />
Generally speaking, the tendency <strong>of</strong> the<br />
humiture index to continue to decrease<br />
with lower <strong>and</strong> lower dew point is shown by<br />
Table s. Also pr onounced is the tendency<br />
<strong>of</strong> the 'apparent temperature' to exceed<br />
the <strong>other</strong> indices in very hot conditions<br />
while just barely continuing to decrease<br />
with low dew points. <strong>The</strong> most obvious<br />
point <strong>of</strong> Table 5 is that the <strong>humisery</strong> does<br />
not decrease with dew point reduction from<br />
60°F to 50°F. For this reason, the <strong>humisery</strong><br />
is only slightly lower in very hot<br />
<strong>and</strong> dry conditions (which might be thought<br />
<strong>of</strong> as the Westerner's native climate) than<br />
it is in the Eastern humidity. <strong>The</strong> <strong>other</strong><br />
indices show greater differences between<br />
the Western <strong>and</strong> Eastern condition. This<br />
weakness <strong>of</strong> the <strong>humisery</strong> index is necessary<br />
in order to retain the "never lower<br />
than temperature" characteristic.<br />
<strong>The</strong> graphic differences between the indices<br />
are shown in Figures 5 through 8.<br />
Each figure shows how the index varies<br />
with temperature <strong>and</strong> dew point. An inspection<br />
shows that the temperature-humidity<br />
<strong>and</strong> humiture index bears a distinctly<br />
linear relationship to dew point. <strong>The</strong> apparent<br />
temperature relationship to dew<br />
point is nonlinear. It is also irregular<br />
in that its slope increases <strong>and</strong> decreases<br />
with increasing dew points. This observation<br />
is caused by the fact that the index<br />
itself is based on relative humidity. On<br />
a similar chart, with a horizontal axis <strong>of</strong><br />
relative humidity, the relationship would<br />
be nonlinear but regular. <strong>The</strong> <strong>humisery</strong><br />
index is also nonlinear in its relationship<br />
to dew point <strong>and</strong> temperature (above<br />
68°F dew point) but is regular with the<br />
slope changing in a smooth manner. <strong>The</strong><br />
effect <strong>of</strong> the baseline dew point on <strong>humisery</strong><br />
is also obvious in the graph.<br />
One additional observation is that the two<br />
more empir ical indices (temperature-humidity<br />
<strong>and</strong> apparent temperature) seem to differ<br />
from each <strong>other</strong> as much as the indices<br />
based on physical reasoning (humiture <strong>and</strong><br />
<strong>humisery</strong>) .<br />
6. CLIMATIC FACTORS<br />
A climatology based on <strong>humisery</strong> rather<br />
than temperature provides some interesting<br />
insights into the interaction <strong>of</strong> temperature<br />
<strong>and</strong> <strong>other</strong> var iables as they account<br />
for <strong>summer</strong> <strong>discomfort</strong>. <strong>The</strong> July mean temperature<br />
<strong>and</strong> <strong>humisery</strong> <strong>and</strong> August mean temperature<br />
<strong>and</strong> <strong>humisery</strong> are shown in Figures<br />
9 <strong>and</strong> 10, respectively (7). <strong>The</strong>se figures<br />
show only the Southeast since elsewhere<br />
16
Volume 7 Number 2<br />
the two<br />
indices are identical.<br />
Indeed, from the flgures, it is apparent<br />
that even in the Southeast, the mean <strong>humisery</strong><br />
<strong>and</strong> temperature are identical almost<br />
everywhere north <strong>of</strong> Mississippi, Alabama,<br />
Georgia <strong>and</strong> South Carolina. An<strong>other</strong> interesting<br />
feature is that whereas the July<br />
is<strong>other</strong>ms are far ther nor th than those <strong>of</strong><br />
August, that is not true <strong>of</strong> <strong>humisery</strong> isolines.<br />
In fact, the southern sections <strong>of</strong><br />
the Gulf States are as much as 2°F higher<br />
in <strong>humisery</strong> in August than in July. It is<br />
reasonable to relate the cooler August in<br />
Arkansas, Tennessee, <strong>and</strong> North Carolina to<br />
decreasing daylight hours <strong>and</strong> to penetration<br />
<strong>of</strong> the polar jet stream in late August.<br />
This, <strong>of</strong> course, brings with it<br />
somewhat cooler air masses. <strong>The</strong> higher<br />
August <strong>humisery</strong> farther south should be<br />
related to the northward movement <strong>of</strong> Gulf<br />
air, which continues as the Gulf waters<br />
warm throughout the entire <strong>summer</strong>.<br />
A comparison <strong>of</strong> <strong>humisery</strong> in the Southeast,<br />
Southwest <strong>and</strong> some large Eastern cities<br />
noted for their uncomfortable <strong>summer</strong>s is<br />
given in Table 6.<br />
Only the Southeastern cities (<strong>and</strong> not all<br />
<strong>of</strong> these) actually have a mean <strong>humisery</strong><br />
different from temperature. It should,<br />
however, be obv ious that even though the<br />
inhabitants <strong>of</strong> these large Eastern cities<br />
may consider their <strong>summer</strong>s humid, the<br />
average values in Table 6 do not indicate<br />
that their <strong>discomfort</strong> is anywhere near as<br />
great as those <strong>of</strong> the Gulf Coast cities.<br />
Figure 9a. July Mean Temperature in<br />
Degrees Fahrenheit<br />
Figure lOa. August Mean Temperature<br />
in Degrees Fahrenheit<br />
90. July Mean Humisery in Degrees<br />
Fahr enheit<br />
"<br />
Figure<br />
Degrees<br />
lOb. August<br />
Fahrenheit<br />
Mean Humisery in<br />
17
<strong>National</strong> Weather Digest<br />
Further consideration indicates there<br />
might be some good reason (aside from ego)<br />
that people in Eastern cities complain<br />
about their <strong>summer</strong>s. Indeed, there is<br />
such a reason <strong>and</strong> it has to do with adaptability<br />
<strong>and</strong> variability.<br />
<strong>The</strong> subject can be approached by using a<br />
winter wind chill example. When the wind<br />
chill is 30°F in North Dakota in January,<br />
the North Dakotans feel warm but the same<br />
wind chill on the Gulf Coast is considered<br />
Arctic. What is wrong with our index?<br />
<strong>The</strong> answer is that nothing is wrong but<br />
that the index does not consider seasonal<br />
adaptability. It has to do with acclimations;<br />
the natives <strong>of</strong> North Dakota actually<br />
get used to, <strong>and</strong> feel fairly comfortable<br />
in, the kind <strong>of</strong> winter that would<br />
make a Gulf Coast resident miserable. So<br />
It is not surprising that the Gulf Coast<br />
residents thrive in mean <strong>summer</strong> <strong>humisery</strong><br />
levels that would put a North Dakotan in<br />
severe <strong>discomfort</strong>. <strong>The</strong> fact is that the<br />
<strong>humisery</strong> does not <strong>and</strong> cannot adjust for<br />
this factor (neither can the wind chill or<br />
<strong>other</strong> <strong>summer</strong> indices). With adaptability,<br />
there is an<strong>other</strong> important consideration;<br />
two identical mean <strong>humisery</strong> levels can<br />
have much different effects. Suppose, as<br />
a simplified example, one city had 31 July<br />
days each with an average <strong>humisery</strong> <strong>of</strong><br />
8l"F. An<strong>other</strong> city had 30 days with an<br />
average <strong>of</strong> 80°F, <strong>and</strong> one day with an average<br />
<strong>of</strong> II1oF. <strong>The</strong> residents <strong>of</strong> the second<br />
city would remember that month for the one<br />
day. Such variability as in the second<br />
city is virtually impossible, but over a<br />
<strong>summer</strong>, <strong>and</strong> especially over many <strong>summer</strong>s,<br />
a lesser variability is likely. For example,<br />
dur ing the <strong>summer</strong> <strong>of</strong> 1980, much <strong>of</strong><br />
Missouri had a temperature <strong>of</strong> 15°F (<strong>and</strong><br />
humiser ies <strong>of</strong> 25°F) above normal. Obviously,<br />
over a 30 year average, such an<br />
event does not show. However, during that<br />
<strong>summer</strong>, many people died <strong>and</strong> many, many<br />
more suffered nearly unbearable <strong>discomfort</strong>.<br />
7. THE BENEFITS OF USING THE HUMISERY<br />
INDEX<br />
What can now be said about measur ing the<br />
<strong>discomfort</strong> <strong>of</strong> <strong>summer</strong>, taking all the above<br />
factors into consideration? For one<br />
tning, we can now quantify in an underst<strong>and</strong>able,<br />
physically reasonable method<br />
this <strong>discomfort</strong>, based on some common notions<br />
about what makes people uncomfortable<br />
in <strong>summer</strong>. This <strong>humisery</strong> index is<br />
easily derived from tables <strong>and</strong> figures <strong>and</strong><br />
is based on parameters that are readily<br />
accessible from toe common weather measurements<br />
taken hourly by the U. S. <strong>National</strong><br />
Weather Service, namely temperature,<br />
moisture, (dew point or relative humidity),<br />
wind <strong>and</strong> elevation. <strong>The</strong> index is<br />
constructed to be as close as possible to<br />
a <strong>summer</strong> analogue <strong>of</strong> the wind chill index<br />
<strong>and</strong> to give values in accordance with intuition.<br />
<strong>The</strong> <strong>humisery</strong> index does not take into consideration,<br />
physiological factors sunlight<br />
exposure, etc. It does not measure<br />
<strong>summer</strong> <strong>discomfort</strong> perfectly, or even significantly<br />
better than do some <strong>other</strong> indices<br />
(although it will be more underst<strong>and</strong>able<br />
to the pUblic). What it does (to use<br />
the initial dialogue) is to allow the<br />
Easterner to tell the visiting Westerner<br />
that the reason the latter feels as if it<br />
is about IOQoF is because that is what the<br />
<strong>humisery</strong> index is. Perhaps, more impor t<br />
antly, the Easterner can also underst<strong>and</strong><br />
why he himself is more uncomfortable on<br />
some hot days than on <strong>other</strong>s <strong>and</strong> can prepare<br />
the home or <strong>of</strong>fice appropriately,<br />
based on an easily calculated index.<br />
REFERENCES AND FOOTNOTES<br />
1. Mr. Weiss did undergraduate work in Meteoralogy at<br />
the University <strong>of</strong> Wisconsin <strong>and</strong> graduate work in<br />
HydrOlogy at the University <strong>of</strong> Nevada. He has written<br />
extensively on air quality physics for the U.S. Dept. <strong>of</strong><br />
Transportation where he has worked for the last few years.<br />
2. U.S. Weather Bureau 1959: Letter Series 5922,<br />
Notes on TemperatW'e Humidity Index.<br />
3. <strong>National</strong> Climatic Center, 1980: Environmental<br />
Information Summary C-19, Heat Stress.<br />
4. George Winterllng, WJXT - Jacksonville, Florida,<br />
1979: Informational Memor<strong>and</strong>um.<br />
5. As an aside, it should be noted that the chance <strong>of</strong><br />
heat exhaustion may actually increase at high altitudes<br />
since, when body moisture is lOW, the perspiration cooling<br />
mechanism is suppressed. Nevertheless, given a person<br />
whose body does have normal mOisture, <strong>and</strong> <strong>other</strong> things<br />
being equal, higher elevations will feel cooler.<br />
6. For equations to produce the tempe rature<br />
Humidity Index in Celsius, see "Climate <strong>and</strong> Man's<br />
Environment," by John E. Oliver, John Wiley &. Sons, Inc.,<br />
1973.<br />
7. <strong>The</strong> Relative Humidity is calculated from moming<br />
<strong>and</strong> afternoon readings for each month.<br />
8. Meteorology Tables, Smithsonian Miscellaneous<br />
Tables,1958: Meteorological Tables, val. 114.<br />
9. Berry et ai, ed. 1945: Harrlbook <strong>of</strong> Meteorology,<br />
McGraw Hill.<br />
10. <strong>National</strong> Climatic Center, 1975: Environmental<br />
Information Summary, C-3, Wind Chill.<br />
11. Haltiner <strong>and</strong> Martin, McGraW-Hill, 1957: D}flamical<br />
<strong>and</strong> Physical Meteorology.<br />
12. <strong>National</strong> Climatic Center, 1980: Comp:lrative<br />
Climatic Data for the United States Through 1979.<br />
18