ON THE NEED FOR VOLUMETRIC RADAR DATA WHEN ISSUING ...
ON THE NEED FOR VOLUMETRIC RADAR DATA WHEN ISSUING ...
ON THE NEED FOR VOLUMETRIC RADAR DATA WHEN ISSUING ...

You also want an ePaper? Increase the reach of your titles
YUMPU automatically turns print PDFs into web optimized ePapers that Google loves.
<strong>ON</strong> <strong>THE</strong> <strong>NEED</strong> <strong>FOR</strong> <strong>VOLUMETRIC</strong> <strong>RADAR</strong> <strong>DATA</strong> <strong>WHEN</strong> <strong>ISSUING</strong> SEVERE THUNDERSTORM AND<br />
TORNADO WARNINGS<br />
David A. Imy*<br />
NOANNEXRAO/OSF<br />
Norman, OK<br />
Kevin J. Pence<br />
NOANNWS Forecast Office<br />
Jackson, MS<br />
Charles A. Doswell III<br />
NOANERLlNational Severe Storms Laboratory<br />
Norman, OK<br />
Abstract<br />
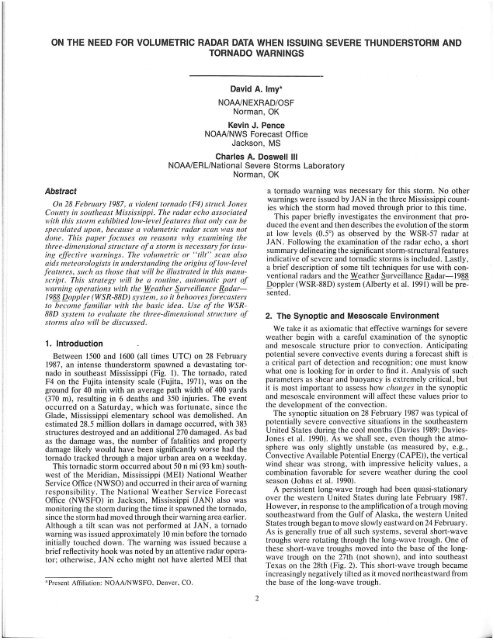
On 28 February 1987, a violent tornado (F4) struck Jones<br />
COl/nty in southeast Mississippi. The radar echo associated<br />
with this storm exhibited low-level features that only can be<br />
speculated upon, because a volumetric radar scan was not<br />
done. This paper focuses on reasons why examining the<br />
three-dimensional structure of a storm is necessary for issuing<br />
effective warnings. The volumetric or "tilt" scan also<br />
(~ids meteorologists in understanding the origins of low -level<br />
features, such as those that will be illustrated in this manuscript.<br />
This strategy will be a routine, automatic part of<br />
warning operations with the Weather Surveillance Radar-<br />
1988 !2oppler (WSR-88D) system, so it behooves fol:ecasters<br />
to become familiar with the basic idea. Use of the WSR-<br />
88D system to evaluate the three-dimensional structure (~f<br />
storms also will be discussed.<br />
1. Introduction<br />
Between 1500 and 1600 (all times UTC) on 28 February<br />
1987, an intense thunderstorm spawned a devastating tornado<br />
in southeast Mississippi (Fig. O. The tornado, rated<br />
F4 on the Fujita intensity scale (Fujita, 1971), was on the<br />
ground for 40 min with an average path width of 400 yards<br />
(370 m), resulting in 6 deaths and 350 injuries. The event<br />
occurred on a Saturday, which was fortunate, since the<br />
Glade, Mississippi elementary school was demolished. An<br />
estimated 28.5 million dollars in damage occurred, with 383<br />
structures destroyed and an additional 270 damaged. As bad<br />
as the damage was, the number of fatalities and property<br />
damage likely would have been significantly worse had the<br />
tornado tracked through a major urban area on a weekday.<br />
This tornadic storm occurred about 50 n mi (93 km) southwest<br />
of the Meridian, Mississippi (MEl) National Weather<br />
Service Office (NWSO) and occurred in their area of warning<br />
responsibility. The National Weather Service Forecast<br />
Office (NWSFO) in Jackson, Mississippi (JAN) also was<br />
monitoring the storm during the time it spawned the tornado<br />
since the storm had moved through their warning area earlier:<br />
Although a tilt scan was not pelformed at JAN, a tornado<br />
warning was issued approximately IO min before the tornado<br />
initially touched down. The warning was issued because a<br />
brief reflectivity hook was noted by an attentive radar operator;<br />
otherwise, JAN echo might not have alerted MEl that<br />
"'Present Affiliation: NOAA/NWSFO, Denver, CO.<br />
a tornado warning was necessary for this storm. No other<br />
warnings were issued by JAN in the three Mississippi counties<br />
which the storm had moved through prior to this time.<br />
This paper briefly investigates the environment that produced<br />
the event and then describes the evolution of the storm<br />
at low levels (0.5") as observed by the WSR-57 radar at<br />
JAN. Following the examination of the radar echo, a short<br />
summary delineating the significant storm-structural features<br />
indicative of severe and tornadic storms is included. Lastly,<br />
a brief description of some tilt techniques for use with conventional<br />
radars and the Weather Surveillance Radar-1988<br />
.Qoppler (WSR-88D) system (Alberty et al. 1991) will be presented.<br />
2. The Synoptic and Mesoscale Environment<br />
We take it as axiomatic that effective warnings for severe<br />
weather begin with a careful examination of the synoptic<br />
and mesoscale structure prior to convection. Anticipating<br />
potential severe convective events during a forecast shift is<br />
a critical part of detection and recognition; one must know<br />
what one is looking for in order to find it. Analysis of such<br />
parameters as shear and buoyancy is extremely critical, but<br />
it is most important to assess how changes in the synoptic<br />
and mesoscale environment will affect these values prior to<br />
the development of the convection.<br />
The synoptic situation on 28 February 1987 was typical of<br />
potentially severe convective situations in the southeastern<br />
United States during the cool months (Davies 1989; Davies<br />
Jones et al. 1990). As we shall see, even though the atmosphere<br />
was only slightly unstable (as measured by, e.g.,<br />
Convective Available Potential Energy (CAPE)), the vertical<br />
wind shear was strong, with impressive helicity values, a<br />
combination favorable for severe weather during the cool<br />
season (Johns et al. 1990).<br />
A persistent long-wave trough had been quasi-stationary<br />
over the western United States during late February 1987.<br />
However, in response to the amplification ofa trough moving<br />
southeastward from the Gulf of Alaska, the western United<br />
States trough began to move slowly eastward on 24 February.<br />
As is generally true of all such systems, several short-wave<br />
troughs were rotating through the long-wave trough. One of<br />
these short-wave troughs moved into the base of the longwave<br />
trough on the 27th (not shown), and into southeast<br />
Texas on the 28th (Fig. 2). This short-wave trough became<br />
increasingly negatively tilted as it moved northeastward from<br />
the base of the long-wave trough.<br />
2
Volume 17 Number 4 November, 1992<br />
3<br />
J<strong>ON</strong>ES COUNTY TORNADO (F4)<br />
February 28, 1987<br />
o<br />
I<br />
I<br />
I<br />
0 1<br />
'/<br />
I<br />
1<br />
1<br />
Northeast Jones High School<br />
Warehouse<br />
US-6-4<br />
(PIB)<br />
Pine Belt<br />
l::'<br />
r<br />
F Scale<br />
5<br />
!<br />
10<br />
!<br />
15 mi<br />
!<br />
Fig. 1. Map of Jones county tornado track (adapted from Storm Data).
L<br />
4 National Weather Digest<br />
-2<br />
-15------<br />
-10<br />
576'<br />
----------<br />
Fig. 2. 500-mb wind data and analysis at 1200 UTC, 28 February 1987. Solid lines are geopotential height contours (interval 60 dm), thin<br />
dashed lines are isotherms (interval 5°C), and thick dashed lines indicate locations of short-wave troughs.<br />
At 120028 February, a surface cold front extended southward<br />
into central Louisiana from a complex surface low<br />
pressure system in eastern Oklahoma (Fig. 3). Although it<br />
is difficult to determine from the 1200 sUlface data alone, a<br />
prefrontal pressure trough was located approximately 50 n<br />
mi (93 km) east of the front and was distinguished by an<br />
accompanying line of thunderstorms. These thunderstorms<br />
had developed the previous evening along the cold front in<br />
central Texas, and had moved ahead of the front during<br />
the night. Three-hourly surface pressure changes (Fig. 4)<br />
depicted a fall/rise couplet that strengthened as it moved<br />
from southwest Louisiana into southern Mississippi. This<br />
couplet appeared to be associated with a northeastward moving<br />
mesolow that developed along the prefrontal trough in<br />
southern Louisiana prior to 1200. A slow moving warm front<br />
extended from the low pressure system in Oklahoma southeastward<br />
into Mississippi. This warm front was oriented from<br />
the northwest to southeast across southern Mississippi, perpendicular<br />
to the track of the meso low . Higher dewpoints<br />
were surging northward to the east of the surface trough and<br />
south of the warm front , which was increasing the instability<br />
in this region.<br />
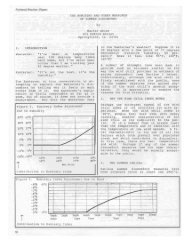
The Lifted Index value for the 1200 JAN sounding was<br />
- 3 (Fig. 5), while at Boothville, Louisiana (BVE), the value<br />
was only - I. (BVE is located at the site plotted in southeast<br />
Louisiana on Fig. 2.) A more comprehensive measure of<br />
buoyant energy is the CAPE, which is a measure of the<br />
positive area on a sounding located between the Level of<br />
Free Convection (LFC) and Equilibrium Level (EL). Using<br />
the 1500 surface temperture of 66°F (l9.4°C) and dewpoint<br />
of 65°F (18.8°C) at Pine Belt, Mississippi (PIB), the CAPEs<br />
at JAN and BVE were 685 m~ s -2 and 70 m~ s -2, respectively.<br />
Considering a sUlface parcel from further south, at New<br />
Orleans, Louisiana with a temperature of 70°F (21.I O C) and<br />
a dewpoint of 69°F (20.6°C), the CAPE values at JAN and<br />
BVE increased to 1148 m 2 s - ~ and 532 m 2 s-~, respectively.<br />
CAPE values from 1500 to 2500 m 2 s - ~ represent significantly<br />
unstable soundings, so it can be seen that this amount of<br />
buoyancy was relatively modest.<br />
The storm-relative helicity in the lowest 2-3 km of the<br />
atmosphere, defined and discussed in Doswell (1991), has<br />
become accepted as a relevant parameter in assessing the<br />
potential for supercell development. Although calculating<br />
helicity was not possible in an operational environment in
Volume 17 Number 4 November, 1992<br />
5<br />
'.<br />
-_.-_.<br />
1004--~<br />
1006 ~ 6<br />
41 +7<br />
..A 7 _ - _-·--41' 4? 0 154<br />
.--' ... .-r· ;, 50 -- . . -17<br />
-.-- ;," \ ~:::.-- "c{f,l' \ 43 057 .--' 42-'<br />
- ·-50 / ,/ 47 15 . ~27 .-- \<br />
~<br />
" ""0 I /' 'I"{ 43---43 102 \<br />
,/ 50 -32 / ~ -47, 42..... '-
6<br />
National Weather Digest<br />
-3<br />
/ )<br />
-1<br />
1<br />
o<br />
-1.7<br />
, ,<br />
, ,<br />
- -~-\--<br />
0600-0900 Z<br />
PRESSURE CHANGES<br />
\<br />
" \ ,J<br />
. L5f<br />
r-<br />
'\ 1./<br />
4 -3 I<br />
:)-, -~<br />
3 C/ _<br />
) - ,<br />
- ,<br />
"" \ .. ~ ,-<br />
--,\\<br />
+3<br />
+2A<br />
+2.0<br />
'"<br />
\<br />
1200-1500 Z<br />
PRESSURE CHANGES<br />
\<br />
Fig. 4. Three-hourly sea-level pressure changes from (a) 0600-0900 UTe, (b) 0900-1200<br />
UTe, (c) 1200-1500 UTe, contoured at an interval of 1 mb (3 hr I,
Volume 17 Number 4 November, 1992 7<br />
100~--~~--~----~~--~--~~--~----~ 53<br />
50<br />
\<br />
\<br />
\<br />
\<br />
\<br />
\<br />
, ,,,<br />
24 "" 40<br />
, "<br />
, "<br />
, '<br />
,<br />
35<br />
\<br />
\<br />
\<br />
\<br />
300<br />
\\\<br />
,<br />
, , , , , , ,<br />
30<br />
, , , ,<br />
"<br />
/<br />
25<br />
500<br />
700<br />
800<br />
900<br />
1000<br />
1050<br />
/<br />
/<br />
/<br />
.4<br />
/<br />
/<br />
20<br />
18<br />
16<br />
14<br />
12<br />
8<br />
4<br />
o<br />
Fig. 5. 1200 UTe 28 February 1987 sounding from Jackson, Mississippi.<br />
1987, the Skew T/Hodograph Analysis and Research Program<br />
(SHARP) Workstation (Hart and Korotky 1991) makes<br />
these calculations quickly and allows forecasters to change<br />
the wind data to reflect changes that have occurred since<br />
the last sounding data were obtained. U sing the observed<br />
motion of the tornadic storm from 225 0<br />
at 50 kt (26 m s -I),<br />
the 0-3 km storm-relative he Ii city for the 1200 BVE wind<br />
profile was 352 m~ s-~. This helicity value was greater than<br />
the Davies-Jones et aI. (1990). tentative threshold of 300<br />
m~ s -~ for an environment suited for the development of<br />
mesocyclones and strong tornadoes.<br />
The 1200 BVE wind profile, however, was not likely to<br />
be representative of the winds in the lowest one km near the<br />
location of the tornadic event. First, the quasi-stationary<br />
warm front was located north of BVE, near PIB, and secondly,<br />
the mesolow approaching from the southwest was<br />
causing the sUlface winds to back. South and east of the<br />
mesolow, a significant increase in the slllface winds also was<br />
observed, probably due to the isallobaric contribution caused<br />
by the mesolow. Thus, by using the PIB 1500 surface winds<br />
(060 0 at 7 kt (3.6 m S - I» and adding 10 kt (5 m S - I) to the<br />
winds above the surface in the lowest I km, the modified<br />
BYE hodograph possessed a 0-3 km storm-relative helicity<br />
of 863 m~ s - ~ (Fig. 6). This far exceeded the Davies-Jones<br />
et aI. (1990) empirical storm-relative helicity threshold for<br />
violent tornadoes of 450 m~ s -~ in the lowest 3 km .<br />
The slow-moving warm front also would provide a possible<br />
focus for intensifying convection (see Maddox et al. 1980).<br />
Thus, forecasters would have to be concerned about the<br />
potential for tornadic storms. It is noteworthy to point out<br />
that environments with marginal CAPEs still can produce<br />
significant supercell events (for example, Korotky (1990».<br />
The low buoyancy indicated, however, that storms with large<br />
hail were not likely, unless a storm(s) became supercellular<br />
where it has been found that dynamical forcing may contribute<br />
about 60% of the updraft strength (Klemp 1987).<br />
With the strong vertical wind shear and abundant moisture,<br />
if supercells developed, it was possible that they would possess<br />
characteristics of the so-called High Precipitation (HP)<br />
supercell (Moller and Doswell 1988; Moller et al. 1990; and<br />
Doswell et al. 1990). As noted by Moller et aI. (1990), such<br />
storms do not always look like the prototypical supercells<br />
(as described in, for example, Browning 1963) when observed<br />
only with a low-level reflectivity slice. Thus, as always, the<br />
use of a tilt scan strategy would be the best technique for<br />
indicating when a storm was becoming severe or tornadic.
lL<br />
8<br />
180·<br />
400<br />
Storm Motion<br />
(225/50)<br />
HELICITYII<br />
863 m 2 /s 2<br />
(Shaded)<br />
90·~+-~--~--~--+---+---+-~270°<br />
10 20 30 40 50 kts<br />
SFC<br />
Fig.6. 1200 UTe 28 February 1987 Boothville, Louisiana hodograph,<br />
with the 0-3 km storm-relative helicity shaded. Storm motion is<br />
indicated with a circled "x" symbol. The hodograph has been modified<br />
in its lowest 1 km to represent the 1500 UTe flow on the north<br />
side of warm front and with stronger winds in the lowest 1 km .<br />
3. The Tornadic Event<br />
On 27 February, the National Severe Storms Forecast<br />
Center (NSSFC) predicted a potential for severe weather<br />
across the lower Mississippi Valley the night of27-28 February.<br />
No severe weather occurred that night in Mississippi,<br />
but thunderstorms moved across mainly the southern half<br />
of the state shortly before dawn The early morning severe<br />
weather outlook included a moderate risk of severe weather<br />
for the southern half of Mississippi. The discussion portion<br />
of the outlook also stated that tornadoes were possible. A<br />
tornado watch (#22) was issued by NSSFC for much of<br />
central and southern Mississippi at 1100 that was to be in<br />
effect until 1800.<br />
Between 1200 and 1330, the line of thunderstorms along the<br />
prefrontal trough produced some scattered severe weather<br />
(including two tornadoes, one an FI and the other an F2) in<br />
southern Louisiana. The line moved eastward into southern<br />
Mississippi around 1330. One storm, within the line and<br />
located near the position of the previously mentioned mesolow,<br />
had a storm top around 50,000 ft (15 km), while the<br />
tops of other storms were around 40,000 ft (12.5 km). This<br />
highest top was notable since the EL on the JAN and BVE<br />
soundings was around 36,000 ft (II km). The presence of the<br />
mesolow and the tall storm top prompted a JAN forecaster to<br />
call several Civil Defense Offices and storm spotters in the<br />
proximity of the storm. At 1430, the Civil Defense Office at<br />
Columbia, MS (Fig. I) reported gusty winds up to 40 kt (20<br />
m S-I), heavy rainfall, but no hail or damaging winds. Thus,<br />
given these facts, only a Special Weather Statement concerning<br />
this storm was issued at that time.<br />
Prior to 1430, none of the storms in the line exhibited<br />
low-level reflectivity signatures suggestive of severe storms.<br />
Around 1430, the low-level reflectivity fields indicated that<br />
the storm in the middle of the line was intensifying, while<br />
the others were weakening. The intensifying storm was<br />
located just northeast of the previously mentioned mesolow,<br />
National Weather Digest<br />
a position known to be favorable for supercells (Tegtmeier<br />
1974). At 1438 (Fig. 7a), this same storm accelerated eastward<br />
and briefly took on the appearance of a bow echo (Fujita<br />
1978). No severe weather was reported with this bow-shaped<br />
echo.<br />
Note the two numbered pendant echoes associated with<br />
the echo mass at 1438 (Fig. 7a). These pendants were not<br />
shaped like the classic hook echo (Forbes 1981) that has<br />
been observed with supercells (Doswell et al. 1990). The<br />
most western pendant was also evident at 1447 (Fig. 7b).<br />
These pendants also did not rotate cyclonically around the<br />
echo mass, like the structures described by Anderson (1985).<br />
In the absence of volumetric scanning, the origins of these<br />
pendants are unclear because the echo structure above is<br />
unknown. If they were associated with outflows originating<br />
from downdrafts, an elevated tilt would have shown relatively<br />
little echo above, with the highest reflectivities located<br />
in the lower levels. However, if these pendants were flanking<br />
lines representing new updrafts, as we suspect, the highest<br />
reflectivities would have been observed above these pendants<br />
along with cellular cores, with a storm top located<br />
nearby where the pendants joined the main echo mass. It<br />
also is likely that a Weak Echo Region (WER), and possibly a<br />
Bounded Weak Echo Region (BWER) (Chisholm and Renick<br />
1972) was present in this case. The absence of volumetric<br />
radar data makes it difficult to interpret the significance of<br />
these pendants unambiguously, even well ((fier the event,<br />
which suggests that it would have been quite difficult to do<br />
so in real time.<br />
By 1447 (Fig. 7b), the storm no longer exhibited a bowshape,<br />
but the low-level reflectivity gradient had tightened<br />
on the west portion of the storm. The reflectivity core, which<br />
had been relatively small and located in the middle of the<br />
storm, had increased in size and shifted toward the western<br />
(backside) portion of the storm. If the storm's top was located<br />
over the low-level reflectivity gradient and accompanied by<br />
a WER, then the tightening gradient was caused by an intensifying<br />
updraft. Nelson (1977) , however, showed that a Rear<br />
Flank Downdraft (RFD) also can cause the low-level gradient<br />
to tighten, especially on the rear flank of the echo (relative<br />
to storm motion). Therefore, a tightening low-level gradient<br />
can not be used unambiguously to indicate the presence of<br />
an updraft, and elevated data are usually required to verify<br />
whether the tightening low-level gradient is due to an updraft<br />
or an RFD.<br />
Shortly thereafter, the JAN radar operator detected a hook<br />
echo ("J-hook") at 1453 as the storm entered Jones County<br />
from the southwest. This J-hook or "s" shaped echo was<br />
evident at 1454 (Fig. 7c). The "S" shaped echo is another<br />
indication of a rotating storm (Nolen 1959; Doswell et al.<br />
1990). This information was relayed to NWSO MEl and a<br />
tornado warning was issued for Jones County at 1458, effective<br />
until 1530. Although this was not a classic hook echo,<br />
it fortuitously triggered a timely warning.<br />
The sUliace pressure at PIB fell 5.1 mb from 1350 to 1448,<br />
and then rose by the same amount from 1448 to 1454 as the<br />
center portion of" S" shaped echo passed over PIB. It should<br />
be noted that tornadic storms can and do occur without any<br />
evidence of sUJiace falls/rises, owing to the spatial resolution<br />
of reporting stations; i.e., about 60 n mi (108 km) apart on<br />
average. As the pressure began to rise very rapidly, the wind<br />
shifted at PIB, from light northeast to southwest at 26 kt<br />
(13 m S - I) with gusts to 50 kt (26 m S-I). The strong southwest<br />
winds accompanying the pressure rise may have been<br />
a reflection of the RFD (Lemon and Doswell 1979). The "s"
Volume 17 Number 4 November, 1992<br />
shaped echo, the magnitude of the pressure fall/rise couplet<br />
and the dramatic change in wind direction indicate that a<br />
mesocyclone may have passed directly over PIB.<br />
The transformation of thunderstorms and their associated<br />
radar echoes into tornadic storms as they interact with preexisting<br />
thermal boundaries has been noted before (Purdom<br />
1976; Maddox et al. 1980; Doswell 1985). As noted in Purdom<br />
(1989) and Moller et al. (1990) , this evolution may well be the<br />
result of the storm' s updraft tilting baroclinically-generated<br />
horizontal vorticity (Klemp 1987), thus enhancing the likelihood<br />
of storm-scale rotation. It is not possible, with the data<br />
sets available for this case, to evaluate the validity of this<br />
hypothesis. Nevertheless, it is noteworthy that the greatest<br />
surface pressure falls and tornadogenesis occurred when the<br />
storm apparently interacted with the warm front (see Fig. 8<br />
for the sUIface analysis nearest the time of the tornado).<br />
The tornado touched down at approximately 1505 about<br />
I n mi (2 km) southeast of PIB (see Fig. I). The radar echo's<br />
area and intensity increased substantially at this time (Fig.<br />
7d). The echo diameter was nearly 25 n mi (46 km) , with a<br />
VIP 51 core approximately 20 n mi (37 km) in diameter. The<br />
size of the VIP 5 core had increased significantly from 1438.<br />
(Note: the reflectivities were reduced temporarily by about<br />
one VIP level at 1447 (Fig. 7b) and 1454 (Fig. 7c), owing to<br />
attenuation from a wet radome.) The tornadic storm at this<br />
time possessed characteristics of an HP supercell, with the<br />
probable mesocyclone thoroughly embedded in precipitation<br />
in the lower levels. The low-level reflectivity gradient had<br />
tightened significantly at this time on both the east and west<br />
sides of this large echo. Thus, it was not possible to determine<br />
the updraft flank of the storm without an upper-level tilt to<br />
display the mid-level overhang signifying the updraft flank.<br />
A pendant (again, not a hook echo) also had redeveloped on<br />
the west side of the storm at 1505 (Fig. 7d) and remained<br />
stationary relative to the echo mass. The pendant persisted<br />
for about 10 minutes before it dissipated. It should be noted<br />
that this storm was located about 75 n mi (139 km) southeast<br />
of JAN at 1505. U sing the standard refractive index, the<br />
beam center height was about 8,000 ft (2.5 km) AGL. The<br />
2.0 0 angular beamwidth for the WSR-57 at 75 nm (139 km)<br />
translates to about a 2.5 n mi (4.6 km) beam diameter at that<br />
distance. Since the larger beam diameter was averaging a<br />
large area of reflectivities that were several thousand feet<br />
above the sUIface, the chances of seeing small-scale, lowlevel<br />
features suggestive of a rotating storm were decreased.<br />
The tornado increased in size and strength as it moved<br />
northeastward at 50 kt (25 m S- I), reaching a maximum width<br />
of I.7 n mi (3. I km) and F4 intensity approximately 3 n mi<br />
(5.5 km) southeast of Laurel, Mississippi at 15 15 (Fig. 7e).<br />
At 15 19 (Fig. 7f) , the echo had taken on a "kidney bean"<br />
shape, which is one shape Moller et al. (1990) have observed<br />
with HP supercells. Another pendant can be seen on the<br />
southeast side of the echo mass. This pendant, unlike those<br />
observed earlier, quickly rotated cyclonically to the northeast<br />
side of the storm by 1530 (Figs. 7g, 7h and 7i). It is<br />
possible that this pendant is associated with a gust front<br />
rotating around the mesocyclone, but without a tilt sequence,<br />
it is (once again) impossible to verify this hypothesis. The<br />
tornado weakened after it moved out of Jones County and<br />
dissipated around 1545.<br />
IThat is. Video Integrator and Processor (VIP) level 5 reflectivity-<br />
50-57 d8Z.<br />
4. Techniques For Examining the Three<br />
Dimensional Structures of Severe<br />
Thunderstorms<br />
This case, plus examination of radar film from other events<br />
including those at other sites, confirms that most NWSOs<br />
and NWSFOs still are not using some type of a tilt scan<br />
strategy, in spite of Lemon's (1980) clear demonstrations of<br />
tilt scanning's operational value. The reasons why operators<br />
are not using a tilt strategy are unclear, but critical warning<br />
information is being missed when the radar is not operated<br />
with volumetric scanning. Integrating a knowledge of the<br />
influential environmental characteristics and identifying<br />
those three-dimensional storm structure features that have<br />
been observed repeatedly with other tornadic storms (e.g.,<br />
Browning 1963; Browning 1965; Lemon 1980) will increase<br />
significantly the likelihood that a tornado warning will be<br />
issued prior to the initial touchdown of a tornado. Many<br />
supercells, particularly those having HP characteristics, do<br />
not consistently display classic low-level echo configurations<br />
(Doswell et al. 1990). Even though the Jones County tornado<br />
briefly displayed a hook echo (not a classic hook), the next<br />
supercell to spawn a killer tornado may not exhibit low-level<br />
features suggestive of a tornadic storm. A tilt scan, such as<br />
the Lemon Technique (1980) , however, will increase the<br />
likelihood that a tornado warning will be issued prior to the<br />
initiation of the event. In this section, a brief review of the<br />
three-dimensional features of severe and tornadic thunderstorms<br />
are presented. Also, tilt strategies for use with conventional<br />
radars and the WSR-88D are included.<br />
4.1 Three-Dimensional Features Suggestive of<br />
Severe Storms<br />
Lemon (1980) used the observed relationship between the<br />
storm top, mid-level and low-level echoes as an indicator of<br />
the updraft strength in a storm. With weak, unsustained<br />
updrafts, the precipitation produced by the updraft transforms<br />
the cell into predominately downward motion and the<br />
storm dies rapidly. This results in a storm where the top, midlevel<br />
and low-level reflectivity cores are aligned vertically.<br />
There is no significant low-level gradient and the mid-level<br />
overhang, if any, is negligible.<br />
With a stronger updraft, the storm top shifts away from<br />
the low-level reflectivity core, moving over the strengthening<br />
low-level reflectivity gradient on the storm's updraft flank.<br />
The tightening low-level gradient results, in part, from the<br />
size sorting of rain and hail by the strong updraft and the<br />
vertical wind shear in the environment (which is an important<br />
ingredient in the strengthening of the updraft and determining<br />
the consequent echo shape). The mid-level echo overhang<br />
forms in part because precipitation develops higher within<br />
the storm' s updraft, resulting in an area of weak or no radard~tectable<br />
precipitation below the mid-level echo. Strong<br />
dIvergence at the storm top also spreads precipitation laterally,<br />
further contributing to the WER development. The presence<br />
of the mid-level overhang and storm top located over<br />
the low-level gradient suggests that the updraft is strong<br />
enough to produce severe weather (at least large hail, and<br />
possibly strong sllIface wind gusts). A severe thunderstorm<br />
warning should be seriously considered when a storm exhibits<br />
this three-dimensional structure, especially in unstable<br />
environments.<br />
Four reflectivity slices at different elevation angles at 2304<br />
on 26 April 1991 from the Twin Lakes (near Oklahoma City,<br />
9
10 National Weather Digest
Volume 17 Number 4 November, 1992 II
12<br />
Fig. 7. Annotated radar images at repesentative times, with arrows<br />
pointing to specific features and storm-relative tornado positions<br />
indicated : (a) 1438, arrow shows two pendants at the south end<br />
of the bow echo configuration, (b) 1447, with arrow pointing out<br />
tightening reflectivity gradient, (c) 1454, showing "S" shaped echo,<br />
(d) 1505, showing the west-side pendant and the tornado location<br />
(with an " x"), (e) 1514, again showing the pendant and tornado<br />
location, (f) 1519, with the arrow noting the RFD-related pendant<br />
on the inflow side of the storm and the tornado location, (g) 1524,<br />
showing the progression of the pendant on the inflow side and the<br />
tornado location, (h) 1527, showing the development of a second<br />
outflow pendant, as well as the first one moving to the northeast<br />
side of the echo, as well as the tornado, (i) 1530, near the end of<br />
the tornado's life cycle, showing the progression of the outflow<br />
pendants.<br />
Oklahoma) WSR-88D depict a storm with a WER (Fig. 9).<br />
(The WSR-88D data levels are in color, but for this manuscript,<br />
a grey scale has been substituted). The four elevation<br />
angles are OS, IS, 2.4° and 4.3° and, with the storm about<br />
75 n mi (140 km) from the radar, the beam center height<br />
(AGL) for each elevation slice would be around 8,000 ft,<br />
16,000 ft , 24,000 ft and 32 ,000 ft , respectively. The angular<br />
beam width of the WSR-88D is about 0.9° compared to 1.6°<br />
for the WSR-74C and 2.0° for the WSR-57. The improved<br />
resolution of the WSR-88D will result in small scale features<br />
being observed more often. Note at OS the tight low-level<br />
gradient located within the concavity on the south side of<br />
the storm. This concavity is also evident at 1.5°. At 2.4° and<br />
4.3°, the significant mid-level echo (;:;: 30 dBZ) extends about<br />
3 n mi (5 km) to the south-southeast of the tight gradient at<br />
OS. The WER in this storm is located on the south side of<br />
the storm with the mid-level echo extending over the town<br />
of Fairmont, Oklahoma, as a geographical reference.<br />
If the updraft becomes even stronger, a low-level concavity<br />
(or notch) may develop on the inflow flank of the low-level<br />
echo bounded by the strong low-level reflectivity gradient. A<br />
pendant, or hook echo may even become evident. However,<br />
waiting for a hook echo to develop before issuing a tornado<br />
warning may result in a missed event because (I) the hook<br />
echo may never materialize, and (2) if the hook echo does<br />
National Weather Digest<br />
materialize, it may do so only ajier the tornado already has<br />
touched down.<br />
The mid-level overhang and storm top will be positioned<br />
above the concavity, if one is present. If the antenna is<br />
elevated to the middle portions of the storm (approximately<br />
10,000-25,000 ft (3-7 km), depending on the season), an echo<br />
"hole" of weak reflectivity will be observed, surrounded by<br />
significantly higher reflectivity. The conically shaped, midlevel<br />
reflectivity hole also will be capped above with higher<br />
reflectivity and the storm top. This is the BWER (also called<br />
the echo-free vault by Browning 1963 and others), which has<br />
been associated strongly with mesocyclones, signifying that<br />
the storm has become a supercell. Regardless of the low-level<br />
echo configuration, a tornado warning should be seriously<br />
considered when a BWER is detected in a storm, especially<br />
when the mesoscale environment favors rotating storms (i .e .<br />
high values of storm-relative helicity).<br />
The storm illustrated in Fig. 10 is the same storm presented<br />
in Fig. 9, except this radar image depicts the storm about<br />
25 min later with a BWER. The low-level concavity at OS<br />
has evolved into the classic hook echo. At IS and 2.4°, an<br />
area of weak reflectivity (20-25 dBZ) is located above the<br />
hook echo and surrounded by noticeably higher reflectivity<br />
(;:;: 40 dBZ). The horizontal extent of the mid-level echo<br />
extends about 6 n mi (II km) south-southeast of the low-level<br />
gradient inside the low-level hook echo. Higher reflectivity at<br />
4.3° is evident above the hook echo and mid-level weak<br />
reflectivity at 1.5° and 2.4°. These three-dimensional storm<br />
structure features comprise a BWER on the south side of<br />
this storm. An F4 intensity tornado with a 66 n mi (122 km)<br />
long track developed about 5 min after this radar photograph.<br />
4.2 Conventional Radar Tilt Strategies<br />
The first step in the Lemon Technique (1980) is to outline<br />
the low-level contour and identify the low-level gradient on<br />
the inflow side of the storm. The mid-level scan is examined<br />
next, searching for at least a VIP 4 echo overhanging the<br />
low-level reflectivity gradient. The next elevated sca n<br />
searches for the storm top. After completing the evaluation,<br />
Lemon's criteria (1980) are used to determine what type of<br />
warning would be recommended, if any.<br />
The full procedure to execute the Lemon Technique may<br />
take too long to conduct when there are several storms to<br />
sample or the storms are moving rapidly. A simpler version<br />
of the Lemon Technique is the Weather Radar Identification<br />
of Severe Thunderstorms (WRIST) Technique proposed by<br />
Lowden (1985). This technique first locates the maximum<br />
top and then compares it with the low-level echo. If the top<br />
is located over or beyond the tight-low level gradient, the<br />
technique is continued by determining the extent of the midlevel<br />
echo. The same criteria as defined by Lemon (1980)<br />
are used to determine the need for severe thunderstorm and<br />
tornado warnings.<br />
An even more time efficient technique than WRIST was<br />
suggested by Imy and Pence (1993) . This technique involves<br />
examining the storm for the existence of a tight low-level<br />
reflectivity gradient (if present) and then comparing the horizontal<br />
extent of the mid-level echo to the low-level echo to<br />
determine the possible existence of a WER or BWER. The<br />
same Lemon criteria (1980) al so apply for determining the<br />
type of warning to be issued. Imy and Pence (1993) used this<br />
technique to depict the three-dimensional features of an HP
Volume 17 Number November, 1992<br />
13<br />
-- -<br />
996 ;;;~====±=~~~<br />
~032<br />
4:!'-<br />
1004---__<br />
1006-__<br />
.--"<br />
1014<br />
'-- ,<br />
61 071<br />
1008............<br />
_?r<br />
'49,p.+37 89 0 6<br />
""'----_-----,J..l.' ~~I!7'r<br />
\<br />
(<br />
39167 .-..<br />
,,~"<br />
50 046 4,\ 4,4 4,1 \,39_'!'9<br />
... '\)\ \ \ '--'-'"<br />
51/' ........ _ .L. _ ... 49~20 \ \ \ , . '"<br />
t. .]0'952<br />
50 PRESFR "\ \ 47\ 098 \ "<br />
V .... - --... , \"'~' -<br />
0/<br />
",'" I 58 "'010 " \\ 46""r7 I .... __ .... "' .... ~<br />
/' ",59~-;''l'o~'" '\i \ ~~~ \<br />
/ / '" -56 .... -.>--', ',\ \ 46=-201 '<<br />
- ,"", ...:..~~<br />
58 +7L-' j!. ,. - ....... ~', 54 0 O~ I \ 48/[21<br />
50 ,I I 67017",53,-17, , ....... _ ",(,l:1:3'<br />
':;t<br />
I 61 OO~ \ RJ-3" '':-~:-'''' ........ 50"" 4]..-",<br />
3 +10' ... .' \64 5' "~~~ ........... ---_-c.::~"''''<br />
\ I' \ \ ~ 993 - .... ::~--=--- .... '"<br />
\ .,... \ '66 ....... ~ ........ '> ..;:: '"<br />
. \ 6 53 - .... -~-....<br />
I \ \ - - 68 .... 053- - _<br />
\<br />
59 036 ' \ \ _." = ~<br />
~<br />
66 083_ --<br />
o<br />
64~054 '. 67 ~029,.1 60 -15 1<br />
1\ I 54 +37 I " ,.. .....<br />
II, I<br />
I,<br />
~47<br />
69, \ 64 -31<br />
\ I \ \ ,- -... ~:: ___ ....<br />
+17 \-_·-c' \ \ 67' ........ 68 34 =~ --_ ..<br />
i / 61 071 I ~061 " \<br />
59 076 49..@+37/ 63 ~+17 69 '056 - 65<br />
~+32 ~ ,P.lESRR ,I r-." ~1O<br />
49 25<br />
12 ~ ~ I' / 68 £:I "<br />
~' ~ ' f~ 68<br />
, I ,<br />
62 65<br />
Fig. 8. Surface data and analysis at 1500 UTe, 28 February 1987; (a) isobars of sea<br />
level pressure (interval 2 mb), along with conventional frontal symbols and selected<br />
surface data, (b) surface data and isotherms (interval 3°F).
14<br />
National Weather Digest<br />
POI~D<br />
CREEK<br />
P<strong>ON</strong>D CREEK<br />
8N<br />
7W<br />
,NID<br />
JAUKOM I S<br />
CO') I ~tGTOI · t<br />
BASE REF 19 R 124 I·t, 54<br />
04/26/91 23,04<br />
I I i I I· -: -I : :II[ I ,<br />
il l !' i ! ', III I ,<br />
P<strong>ON</strong>D<br />
PERf<br />
19 R 124 N . 54 NM<br />
23' 04 , 1' 1;· ."" ,<br />
_-+___--'-_'_' _1_' 1_'_, _____--.-______--, R DA 'KOKC 35/ 19/ 5 8 ~4<br />
1277 FT 97 / 16/ 37W<br />
:3<br />
f'lODE A / 21<br />
4 f'lAX= 56 D8Z<br />
LAMOIH<br />
P<strong>ON</strong>D CREEK<br />
NO<br />
5 /----------<br />
10<br />
,NID<br />
JAUKmlIS<br />
BASE REF 19 R 124 N<br />
04 / 26/ 91 23 dj4 ' !" '<br />
. : I I ' . ; j l l ,<br />
PERf<br />
54 1~~1<br />
I d ,<br />
PERI<br />
75<br />
54 IH'1 RES<br />
I d I ,<br />
. ii I<br />
A/R (HOME) 154 DEG<br />
32076FT 4 NM<br />
OUEUE Ei'lF'T','<br />
I I 1·1 I ! " 'II: I<br />
I t i ' l I ; , '"<br />
05/1718 COMf'l ERROR<br />
<strong>ON</strong> LINE 8 411 -3<br />
HAF'DCOP'i<br />
HAI':DCOF",' F'EC!UE :::T<br />
ACCEPTED<br />
Fig. 9. Four reflectivity slices (OS, 1S, 2.4° and 4.3° elevation angles) from the Twin Lakes (near Oklahoma City, Oklahoma) WSR-88D<br />
system 2304 UTC, 26 April 1991. This storm is exhibiting a WER on the south side of the storm.<br />
supercell, even though a hook echo was never apparent with<br />
the storm.<br />
4.3 WSR-88D Strategy for Examining Storms<br />
New observational data and computers to deal with radar,<br />
satellite and environmental conditions will be implemented<br />
gradually into future modernized weather offices. Those<br />
forecasters using the WSR-88D system must take advantage<br />
of the exciting new capabilities the system has to offer. The<br />
combination of the better resolution reflectivity data and the<br />
addition of the mean radial velocity will greatly enhance<br />
forecasters ' abilities to warn for dangerous storms. Also,<br />
forecasters will have more time to scrutinize the data, since<br />
the radar will sample several elevation angles automatically<br />
and create displays for each elevation angle sampled. The<br />
WSR-88D system will collect reflectivity and velocity data<br />
at either 9 or 14 different elevation angles every 5 or 6 min.<br />
(Lemon et al. 1992). The operator can display at the Principal<br />
User Processor (PU P; Alberty 1990) the best elevation angles<br />
to examine the low, middle, and upper regions of a storm<br />
and then interpret the data to determine the storm's potential<br />
severity (as illustrated in Figs. 9 and 10). All of this can be<br />
done easily and repeatedly and in a few seconds through the<br />
use of a User Function (Lemon et aI., 1992).<br />
The three-dimensional evaluation of the storm with four<br />
slices of reflectivity and velocity will be the best radar method<br />
to anticipate the development of mesocyclones before the<br />
detection algorithms indicate their presence, as well as validate<br />
or refute the algorithm output. The same criteria<br />
described by Lemon (1980) for issuing severe thunderstorm<br />
and tornado warnings can be used with the WSR-88D system,<br />
although the three-dimensional storm structure features are<br />
emphasized rather than the specific values. If one is monitoring<br />
the reflectivity structures properly with this system, forecasters<br />
will be able to watch the three-dimensional reflectivity<br />
structure evolve from non-severe to severe storms<br />
before that evolution is evident in the velocity fields (Lemon<br />
and Doswell 1979). The WSR-88D system also will store all<br />
products received at the PUP during the event on an optical
Volume 17 Number 4 November, 1992 15<br />
'38 .' 05.' 92 18 ' 04<br />
NO<br />
.. 5<br />
10<br />
15<br />
20~~~~ __ ~~~u-_<br />
'.,.' 25<br />
i 30<br />
35<br />
40<br />
45<br />
5<br />
5<br />
6~.~~~--~~~~-<br />
65<br />
70<br />
75<br />
IT<br />
BASE REF 19 R 124 NM<br />
04 / 26 / 91 23 ; 28 'i'l I .<br />
I : " ! I I I<br />
19 R 124 NM . 54<br />
23'28 11111· :',,"", 1, I<br />
" 1. 11 I, RDA 'KOKC<br />
~~~--~~----~r-~~--------------------~1277 FT<br />
110DE A / 21<br />
4 MAX= 59 DBZ<br />
LAM<strong>ON</strong>T<br />
NO<br />
PO N C A C 11 5 L-______________ _<br />
10<br />
15<br />
20<br />
, 25<br />
30<br />
, 35 A/R (HOME) 40 DEG<br />
40 8967FT 4 NM<br />
45 OUEUE EI'lF'TY<br />
50 1 ' I> I "'. I· F" ['11 11 r<br />
55<br />
1 60 05/1801 HARDCOPY<br />
65 OUT OF PAPER<br />
70 HAF.:DCOP' ....<br />
75<br />
HARDCOPY REQUE~; T<br />
ACCEPTED<br />
RES<br />
"· t ll !<br />
Fig, 10. Same as Fig. 9, except about 20 min later and with a BWER on the south side of the storm.<br />
disk (Crum and Alberty 1992). This will allow meteorologists<br />
to examine the radar data after the event has ended and as<br />
often as desired. In this manner, even if the forecaster did<br />
not consider the three-dimensional structure of a storm during<br />
the event, the data on the disk can be examined immediately<br />
after the event to ascertain the important kinematic<br />
and reflectivity structure of storms. With the WSR-880, the<br />
three-dimensional aspects of a storm will no longer be<br />
missed, even if the meteorologist did not examine upperlevel<br />
tilts during the event.<br />
5. Summary and Recommendations<br />
Forecasters must examine the three-dimensional features<br />
of storms, rather than examine low-level slices exclusively.<br />
Fuctioning without a tilt scan strategy, such as with the lones<br />
County storm, continues to be a major deficiency in the<br />
proper operational identification of storm-scale features .<br />
Fortunately, for this event, a transient hook-like feature (a<br />
l-hook) was noted by an alert radar operator, so a timely<br />
tornado warning was issued. However, the potentially tragic<br />
consequences of not utilizing the capability of the radar to<br />
its fullest cannot be underestimated. We believe it is imperative<br />
that forecasters also understand the principles behind<br />
the Lemon Technique, so that they can be used fully in<br />
warning situations.<br />
The WSR-880 system will obtain reflectivity and velocity<br />
data automatically at preselected elevation angles every 5<br />
or 6 min when thunderstorms are occurring. The use of<br />
reflectivity and velocity slices concurrently at four different<br />
elevation angles, in conjunction with the use of the Lemon<br />
criteria, will provide essential information for determining<br />
the potential severity of storms. The need to evaluate the<br />
three-dimensional structure of storms subjectively will not be<br />
replaced by the output provided by the WSR-88D algorithms.<br />
The lack of upper-level tilts prevented the resolution of<br />
important questions about the storm-scale processes concerning<br />
the lones County storm. After an episode where<br />
upper level tilts have been used, forecasters should examine<br />
the radar film. Reviewing the radar film will allow forecasters
16<br />
to discern features that might have been missed during warning<br />
operations. The upper level tilts will help support or<br />
invalidate the significance of observed low-level features and<br />
enable a station to document identification techniques that<br />
did or did not work during an event. The capabilities of<br />
evaluating storm structures with the WSR-88D system will<br />
be far superior to those used with conventional radars. Forecasters<br />
also will be able to view all products stored in the<br />
PU P as soon as the event is over. Thus, in depth studies<br />
into the structure of storms will be possible after all significant<br />
events, even if a forecaster was able to examine ollly<br />
the lowest elevation slice during the event.<br />
Acknowledgments<br />
We thank Bob Davies-Jones for his help in computing<br />
the helicity values used in this study. Also, thanks to Don<br />
Burgess, Brad Smull, Tim Crum, Bill Read, Ray Brady, Les<br />
Lemon, and OSF personnel for vastly improving the content<br />
and eventual outcome of this manuscript. We are indebted<br />
to Gerry Cathey (NWS Southern Region Headquarters) for<br />
obtaining hard copies of the radar film and Lans Rothfusz<br />
(NWS Southern Region Headquarters) for assisting with the<br />
data acquisition. Finally, we thank Ms. Joan Kimpel for her<br />
excellent assistance and suggestions with the figures.<br />
Authors<br />
David A. lmy received a B.S. in Meteorology at Texas<br />
A&M University in 1979. David entered the National<br />
Weather Service directly from college and has been with the<br />
Weather Service for 13 years. He started at Little Rock,<br />
Arkansas as an intern, moved to Jackson, Mississippi in 1985<br />
as the Warning and Preparedness Meteorologist until July<br />
1989 when he became an instructor for the WSR-88D Operations<br />
Training Course in Norman, Oklahoma. Dave recently<br />
moved to Colorado to become the Deputy Meteorologist-In<br />
Charge at the Denver National Weather Service Forecast<br />
Office. His research interests include all operational aspects<br />
that concern severe thunderstorms.<br />
Kevin J. Pence received a B.S. in Meteorology at San Jose<br />
State in 1980. Kevin joined the National Weather Service in<br />
January 1981 as an intern and has been with the Weather<br />
Service for 12 years. Kevin moved to Jackson, Mississippi<br />
in May 1981 and is currently a lead forecaster. His research<br />
interests include severe storms, flash flood events and climatology.<br />
Charles A. Doswell III received his B.S. in Meteorology<br />
at the University of Wisconsin in 1967, his M.S. in Meteorology<br />
at the University of Oklahoma, and after serving with<br />
the army in Vietnam and at the White Sands Missile Range<br />
in New Mexico, received his Ph.D. in Meteorology at the<br />
University of Oklahoma in 1976. In addition to his present<br />
employment with the National Severe Storms Laboratory in<br />
Norman, Oklahoma, he has worked at the National Severe<br />
Storms Forecast Center in Kansas City, Missouri and the<br />
Environmental Research Laboratories in Boulder, Colorado.<br />
His research interests include all aspects of weather forecasting<br />
(including verification), objective analysis, and virtually<br />
everything about severe storms (from cloud physics to the<br />
general circulation).<br />
References<br />
Alberty, R. L., 1990: Organization. structure and function of the<br />
NEXRAD Operational Support Facility. Preprillts, 16th CO/tf<br />
National Weather Digest<br />
Sel'l'fe Local Storms (Kananaskis Park. Alberta), Amer.<br />
Meteor. Soc., 175-178.<br />
Alberty, R. L., T. D. Crum, and F. Toepfer, 1991 : The NEX<br />
RAD program: Past, present, and future; A 1991 perspective.<br />
Preprints, 25th Int. CO/tf on Radar Meteor. (Paris, FRANCE),<br />
Amer. Meteor. Soc., 1/8.<br />
Anderson, C. E., 1985: The Barneveld tornado: A new type of<br />
tornadic storm in the form of a spiral mesolow. Preprints, 14th<br />
COJtf Severe Local Storms (Indianapolis, IN), Amer. Meteor.<br />
Soc., 289-292.<br />
Browning, K. A., 1963: Airflow and structure of a tornadic<br />
storm. J, Atmos. Sci., 20,533-545.<br />
Browning, K. A., 1965: Some inferences about the updraft<br />
within a severe local storm. 1. Atmos. Sci., 22, 669-677.<br />
Chisholm, A. J. and J. H. Renick, 1972: The kinematics of<br />
multicell and supercell Alberta hailstorms ... Alberta Hail Studies,<br />
1972," Research COllncil (~f Alberta Hail stlldies, Report<br />
No. 72-2, 24-31.<br />
Crum, T. D. and R. L. Alberty, 1993: Recording, archiving and<br />
using WSR-88D data. BlIlI. Amer. Metmr. Soc., accepted for<br />
April 1993 pllblication.<br />
Davies, J. M., 1989: On the use of magnitudes and hodographs<br />
in tornado forecasting. Preprints, 12th CO/tf Wea. Analysis and<br />
Forecasting (Monterey, CAl, Amer. Meteor. Soc., 219-224.<br />
Davies-Jones, R. P., D. W. Burgess and M. P. Foster, 1990:<br />
Test of helicity as a tornado forecast parameter. Preprints, 16th<br />
CO/tf Severe Local Storms (Kananaskis Park, Alberta), Amer.<br />
Meteor. Soc., 588-592.<br />
Doswell, C. A. III, 1985: The Operational Meteorology of Convective<br />
Weather. Vol. II: Storm Scale Analysis. NOAA Tech.<br />
Memo. ERL ESC-15 NTIS Accession No. PB85-226959, 240<br />
pp.<br />
Doswell, C. A. Ill, A. R. Moller, and R. W. Przybylinski, 1990:<br />
A unified set of conceptual models for variations on the supercell<br />
theme. Preprints, 16th ConI Severe Lowl Storms (Kananaskis<br />
Park, Alberta), Amer. Meteor. Soc., 40-45.<br />
Doswell, C. A. III, 1991: A review for forecasters on the application<br />
of hodographs to forecasting severe thunderstorms. Nat.<br />
Wea. Dig., 16:1,2-16.<br />
Forbes, G. S., 1981: On the reliability of hook echoes as tornado<br />
indicators. Mon. Wea. Rev., 109, 1457-1466.<br />
Fujita, T. T .. 1971: A proposed characterization of tornadoes<br />
and hurricanes by area and intensity. Satellite and Mesol11eteorology<br />
Research Pr(~ject Report No. 91, Dept. of Geophysical<br />
Sciences, Univ. of Chicago. 5734 S. Ellis Ave., Chicago, IL<br />
60637.42 pp.<br />
Fujita, T. T., 1978: Manual of Downburst Identification for Project<br />
NIMROD. Satellite and Mesomeleorology Res. Paper No.<br />
156, Univ. of Chicago, 104 pp.<br />
Hart, J. A., and W. D. Korotky, 1991: The SHARP workstation-v<br />
1.50. A skew T/hodograph analysis and research program<br />
for the IBM and compatible PC. Users Manual. NOAAI<br />
NWS Forecast Office, Charleston, WV., 62 pp.<br />
Imy, D. A., and K. J. Pence, 1993: An examination ofa supercell<br />
using a tilt sequence. Proceedings, Tornado Symposillm III (c.<br />
Church, Ed.), Amer. Geophys. Union, (in press).<br />
Johns, R. H., J . M. Davies and P. W. Leftwich. 1990: An examination<br />
of the relationship of 0-2 km AGL "positive" wind shear<br />
to potential buoyant energy in strong and violent tornado situa-
Volume 17 Number 4 November, 1992 17<br />
tions. Preprillts, 16th COI(( Sel'ere Local Storms (Kananaskis<br />
Park, Alberta), Amer. Meteor. Soc., 593-598.<br />
Klemp, J. B., 1987: Dynamics oftornadic thunderstorms. Anll.<br />
ReI'. Fillid Me(k, 19,369-402.<br />
Korotky, W. D. 1990: The Raleigh tornado of November 28,<br />
1988: The evolution of a tornadic event. Preprints, 16th COI((<br />
Severe Local Storms (Kananaskis Park, Alberta), Amer.<br />
Meteor. Soc., 532-537.<br />
Lemon, L. R. , and C. A. Doswell III, 1979: Severe thunderstorm<br />
evolution and mesocyclone structure as rel ated to tornadogenesis.<br />
Mon. Wea. Rev., 107, 1184-1187.<br />
Lemon, L. R. , 1980: New severe thunderstorm radar identification<br />
techniques and warning criteria. NOAA Tech. Memo. NWS<br />
NSSFC-3, NTIS Accession No. PB-273049, 60 pp.<br />
Lemon, L. R. , E. M. Quoetone and L. J . Ruthi, 1992: WSR-88D:<br />
Effective operational applications of a high data rate. Preprillfs,<br />
Symp. Weather ForecastinR (Atlanta, GAl. Amer. Meteor. Soc.,<br />
173-180.<br />
Lowden, J. D., 1985: Severe storms techniques practiced in<br />
National Weather Service radar stations. Preprints. 14th COI(t:<br />
Severe Local Storms (indianapolis, IN), Amer. Meteor. Soc. ,<br />
240-243.<br />
Maddox, R. A., L. R. Hoxit, and C. F . Chappell, 1980: A study<br />
of tornadic thunderstorm interactions with thermal boundaries.<br />
MOil. Wea. R eF ., 108,322-336.<br />
Moller, A. R., and C. A. Doswell III, 1988: A proposed advanced<br />
storm spotter's training program. Preprints. 15th COI(t: Sel'ere<br />
Local Storms (Baltimore, MD), Amer. Meteor. Soc., 173-177.<br />
Moller, A. R. , C. A. Doswell III , and R. W. Przybylinski, 1990:<br />
High-precipitation supercells: A conceptual model and documentation.<br />
Preprillts, 16th COllI Severe Local Storms (Kananaskis<br />
Park, Alberta), Amer. Meteor. Soc. , 52-57.<br />
Nelson, S. P .. 1977: Rear flank downdraft : A hailstorm intensification<br />
mechani sm. Preprints, 10th COllI Sel'ere Local Storms<br />
(Omaha, NE), Amer. Meteor. Soc., 521-525.<br />
Nolen , R. H. , 1959: A radar pattern associated with tornadoes.<br />
BIIII. Amer. Meteor. Soc., 40,277-279.<br />
Purdom, J. F. W. , 1976: Some uses of high re solution GOES<br />
im agery in the mesoscale forecasting of convection and its<br />
behavior. MOil. Wea. Rev., 104, 1474-83.<br />
Purdom, J. F. W. , 1989: Satellite observation oftornadic storm<br />
development. Preprillts, 12th COI(t: Wea. Analysis alld ForecastillR<br />
(Monterey, CAl, Amer. Meteor. Soc., 192-195.<br />
Tegtmeier, S. A., 1974: The role of the surface sub-synoptic,<br />
low pressure system in severe weather forecasting. M. S. Thesis.<br />
VIIiI'. of Oklahoma, 35 pp.<br />
AVIATI<strong>ON</strong><br />
METEOROLOGIST<br />
Northwest Airlines, the 4th largest U.S.-based international<br />
airline, has an immediate opening for a<br />
Meteorologist with at least two years synoptic forecasting<br />
experience. Responsibilities will include<br />
airport terminal forecasting, forecasting hazardous<br />
aviation weather conditions and flight cruise level<br />
wind velocities. You will also brief pilots and flight<br />
dispatchers on CUiTent and forecasted weather, prepare<br />
sUliace and flight cruise level weather charts.<br />
A BS and/or MS in Meteorology from an accredited<br />
university is required, along with the ability to work<br />
quickly and efficiently under deadline pressure.<br />
We offer a competitive salalY and benefits package<br />
including generous travel privileges. Qualified<br />
candidates may send a resume and cover letter to<br />
Marcia Wynn, Operations Human Resources,<br />
Northwest Airlines, 5101 Northwest Drive,<br />
Mail Stop A2060, St. Paul, MN 51111-3034.<br />
Orfax to: 612/726-6911. We are an equal opportunity<br />
employer.