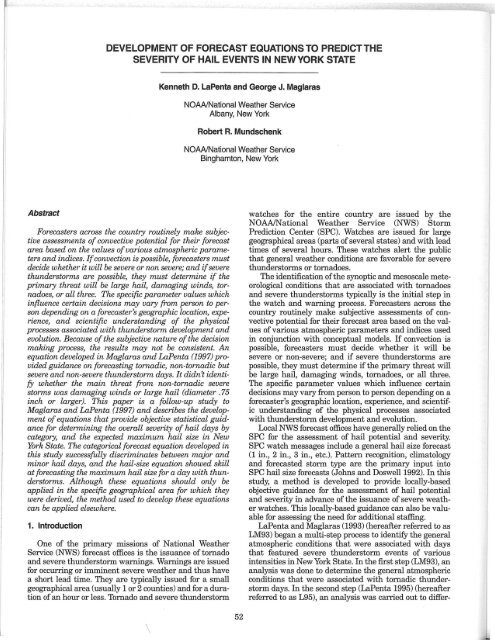
development of forecast equations to predict the severity of hail ...
development of forecast equations to predict the severity of hail ...
development of forecast equations to predict the severity of hail ...

Create successful ePaper yourself
Turn your PDF publications into a flip-book with our unique Google optimized e-Paper software.
DEVELOPMENT OF FORECAST EQUATIONS TO PREDICT THE<br />
SEVERITY OF HAIL EVENTS IN NEW YORK STATE<br />
Kenneth D. LaPenta and George J. Maglaras<br />
NOAA/National Wea<strong>the</strong>r Service<br />
Albany, New York<br />
Robert R. Mundschenk<br />
NOAA/National Wea<strong>the</strong>r Service<br />
Bingham<strong>to</strong>n, New York<br />
Abstract<br />
Forecasters across <strong>the</strong> country routinely make subjective<br />
assessments <strong>of</strong> convective potential for <strong>the</strong>ir <strong>forecast</strong><br />
area based on <strong>the</strong> values <strong>of</strong> various atmospheric parameters<br />
and indices. If convection is possible, <strong>forecast</strong>ers must<br />
decide whe<strong>the</strong>r it will be severe or non severe; and if severe<br />
thunders<strong>to</strong>rms are possible, <strong>the</strong>y must determine if <strong>the</strong><br />
primary threat will be large <strong>hail</strong>, damaging winds, <strong>to</strong>rnadoes,<br />
or all three. The specific parameter values which<br />
influence certain decisions may vary from person <strong>to</strong> person<br />
depending on a <strong>forecast</strong>er's geographic location, experience,<br />
and scientific understanding <strong>of</strong> <strong>the</strong> physical<br />
processes associated with thunders<strong>to</strong>rm <strong>development</strong> and<br />
evolution. Because <strong>of</strong> <strong>the</strong> subjective nature <strong>of</strong> <strong>the</strong> decision<br />
making process, <strong>the</strong> results may not be consistent. An<br />
equation developed in Maglaras and LaPenta (1997) provided<br />
guidance on <strong>forecast</strong>ing <strong>to</strong>rnadic, non-<strong>to</strong>rnadic but<br />
severe and non-severe thunders<strong>to</strong>rm days. It didn't identify<br />
whe<strong>the</strong>r <strong>the</strong> main threat from non-<strong>to</strong>rnadic severe<br />
s<strong>to</strong>rms was damaging winds or large <strong>hail</strong> (diameter. 75<br />
inch or larger). This paper is a follow -up study <strong>to</strong><br />
Maglaras and LaPenta (1997) and describes <strong>the</strong> <strong>development</strong><br />
<strong>of</strong> <strong>equations</strong> that provide objective statistical guidance<br />
for determining <strong>the</strong> overall <strong>severity</strong> <strong>of</strong> <strong>hail</strong> days by<br />
category, and <strong>the</strong> expected maximum <strong>hail</strong> size in New<br />
York State. The categorical <strong>forecast</strong> equation developed in<br />
this study successfully discriminates between major and<br />
minor <strong>hail</strong> days, and <strong>the</strong> <strong>hail</strong>-size equation showed skill<br />
at <strong>forecast</strong>ing <strong>the</strong> maximum <strong>hail</strong> size for a day with thunders<strong>to</strong>rms.<br />
Although <strong>the</strong>se <strong>equations</strong> should only be<br />
applied in <strong>the</strong> specific geographical area for which <strong>the</strong>y<br />
were derived, <strong>the</strong> method used <strong>to</strong> develop <strong>the</strong>se <strong>equations</strong><br />
can be applied elsewhere.<br />
1. Introduction<br />
One <strong>of</strong> <strong>the</strong> primary missions <strong>of</strong> National Wea<strong>the</strong>r<br />
Service (NWS) <strong>forecast</strong> <strong>of</strong>fices is <strong>the</strong> issuance <strong>of</strong><strong>to</strong>rnado<br />
and severe thunders<strong>to</strong>rm warnings. Warnings are issued<br />
for occurring or imminent severe wea<strong>the</strong>r and thus have<br />
a short lead time. They are typically issued for a small<br />
geographical area (usually 1 or 2 counties) and for a duration<br />
<strong>of</strong> an hour or less. Thrnado and severe thunders<strong>to</strong>rm<br />
watches for <strong>the</strong> entire country are issued by <strong>the</strong><br />
NOAAlNational Wea<strong>the</strong>r Service (NWS) S<strong>to</strong>rm<br />
Prediction Center (SPC). Watches are issued for large<br />
geographical areas (parts <strong>of</strong> several states) and with lead<br />
times <strong>of</strong> several hours. These watches alert <strong>the</strong> public<br />
that general wea<strong>the</strong>r conditions are favorable for severe<br />
thunders<strong>to</strong>rms or <strong>to</strong>rnadoes.<br />
The identification <strong>of</strong> <strong>the</strong> synoptic and mesoscale meteorological<br />
conditions that are associated with <strong>to</strong>rnadoes<br />
and severe thunders<strong>to</strong>rms typically is <strong>the</strong> initial step in<br />
<strong>the</strong> watch and warning process. Forecasters across <strong>the</strong><br />
country routinely make subjective assessments <strong>of</strong> convective<br />
potential for <strong>the</strong>ir <strong>forecast</strong> area based on <strong>the</strong> values<br />
<strong>of</strong> various atmospheric parameters and indices used<br />
in conjunction with conceptual models. If convection is<br />
possible, <strong>forecast</strong>ers must decide whe<strong>the</strong>r it will be<br />
severe or non-severe; and if severe thunders<strong>to</strong>rms are<br />
possible, <strong>the</strong>y must determine if <strong>the</strong> primary threat will<br />
be large <strong>hail</strong>, damaging winds, <strong>to</strong>rnadoes, or all three.<br />
The specific parameter values which influence certain<br />
decisions may vary from person <strong>to</strong> person depending on a<br />
<strong>forecast</strong>er's geographic location, experience, and scientific<br />
understanding <strong>of</strong> <strong>the</strong> physical processes associated<br />
with thunders<strong>to</strong>rm <strong>development</strong> and evolution.<br />
Local NWS <strong>forecast</strong> <strong>of</strong>fices have generally relied on <strong>the</strong><br />
SPC for <strong>the</strong> assessment <strong>of</strong> <strong>hail</strong> potential and <strong>severity</strong>.<br />
SPC watch messages include a general <strong>hail</strong> size <strong>forecast</strong><br />
(1 in., 2 in., 3 in., etc.). Pattern recognition, clima<strong>to</strong>logy<br />
and <strong>forecast</strong>ed s<strong>to</strong>rm type are <strong>the</strong> primary input in<strong>to</strong><br />
SPC <strong>hail</strong> size <strong>forecast</strong>s (Johns and Doswell 1992). In this<br />
study, a method is developed <strong>to</strong> provide locally-based<br />
objective guidance for <strong>the</strong> assessment <strong>of</strong> <strong>hail</strong> potential<br />
and <strong>severity</strong> in advance <strong>of</strong> <strong>the</strong> issuance <strong>of</strong> severe wea<strong>the</strong>r<br />
watches. This locally-based guidance can also be valuable<br />
for assessing <strong>the</strong> need for additional staffing.<br />
LaPenta and Maglaras (1993) (hereafter referred <strong>to</strong> as<br />
LM93) began a multi-step process <strong>to</strong> identify <strong>the</strong> general<br />
atmospheric conditions that were associated with days<br />
that featured severe thunders<strong>to</strong>rm events <strong>of</strong> various<br />
intensities in New York State. In <strong>the</strong> first step (LM93), an<br />
analysis was done <strong>to</strong> determine <strong>the</strong> general atmospheric<br />
conditions that were associated with <strong>to</strong>rnadic thunders<strong>to</strong>rm<br />
days. In <strong>the</strong> second step (LaPenta 1995) (hereafter<br />
referred <strong>to</strong> as L95), an analysis was carried out <strong>to</strong> differ-<br />
\<br />
52
Volume 24 Numbers 1, 2 June 2000<br />
53<br />
Monthly Distribution <strong>of</strong> Events<br />
14 ,n.,<br />
12 I<br />
". "<br />
10 /4-.. '<br />
S<br />
//.. ",<br />
~-~\",<br />
6<br />
A:: ~<br />
4<br />
//.~: ".~,<br />
2<br />
.. -L~':" ',~~<br />
0 I I I I I I I I I I I<br />
J F M A M J J A S 0 N 0<br />
Tornado<br />
-_. Major Severe<br />
• II" I. I<br />
Minor Severe<br />
_1_' No Severe<br />
Tor Maj Min Non Total<br />
1989 4 8 4 2 18<br />
1990 8 4 7 13 32<br />
1991 4 11 12 10 37<br />
1992 8 7 6 8 29<br />
1993 13 7 8 4 32<br />
Fig. 1. The monthly distribution <strong>of</strong> thunders<strong>to</strong>rm days used in this<br />
study for each <strong>of</strong> <strong>the</strong> 4 severe categories (upper portion). The<br />
lower portion shows <strong>the</strong> distribution <strong>of</strong> thunders<strong>to</strong>rm days by year<br />
for each <strong>of</strong> <strong>the</strong> 4 severe categories.<br />
entiate <strong>the</strong> atmospheric conditions that produce <strong>to</strong>rnadic<br />
thunders<strong>to</strong>rm days, major! severe thunders<strong>to</strong>rm days,<br />
and minor severe thunders<strong>to</strong>rm days. In <strong>the</strong> third step,<br />
Maglaras and LaPenta (1997) (hereafter referred <strong>to</strong> as<br />
ML97) described <strong>the</strong> <strong>development</strong> <strong>of</strong> an equation <strong>to</strong> make<br />
conditional <strong>forecast</strong>s <strong>of</strong> <strong>the</strong> <strong>severity</strong> <strong>of</strong> a thunders<strong>to</strong>rm<br />
day given <strong>the</strong> occurrence <strong>of</strong> thunders<strong>to</strong>rms. The equation<br />
developed in ML97 provides guidance on <strong>forecast</strong>ing <strong>to</strong>rnadic,<br />
non-<strong>to</strong>rnadic but severe, and non-severe thunders<strong>to</strong>rm<br />
days. However, <strong>the</strong>ir equation didn't identify<br />
whe<strong>the</strong>r <strong>the</strong> main threat from non-<strong>to</strong>rnadic severe<br />
s<strong>to</strong>rms would be damaging winds or large <strong>hail</strong> (diameter<br />
.75 inch or larger). This study uses <strong>the</strong> data set developed<br />
1 Major severe wea<strong>the</strong>r days were defined as those days with 10 or<br />
more severe wea<strong>the</strong>r reports in <strong>the</strong> nor<strong>the</strong>astern United States,<br />
and minor severe wea<strong>the</strong>r days were defined as those days with<br />
less than 10 events. The nor<strong>the</strong>astern United States as defined<br />
in L95, ML97 and in this paper includes New York, New England,<br />
New Jersey and Pennsylvania.<br />
in <strong>the</strong> previous studies, LM93, L95 and ML97, <strong>to</strong> develop<br />
conditional <strong>forecast</strong> <strong>equations</strong> <strong>to</strong> <strong>predict</strong> <strong>the</strong> overall<br />
<strong>severity</strong> <strong>of</strong> <strong>hail</strong> days by category, and <strong>the</strong> expected maximum<br />
<strong>hail</strong> size in New York State. The purpose <strong>of</strong> <strong>the</strong>se<br />
<strong>equations</strong> is <strong>to</strong> provide objective statistical guidance<br />
based on <strong>the</strong> <strong>forecast</strong>er's subjective assessment <strong>of</strong> <strong>the</strong><br />
general atmospheric conditions expected at <strong>the</strong> time <strong>of</strong><br />
<strong>the</strong> event.<br />
2, Data<br />
In LM93, <strong>the</strong> general atmospheric conditions that<br />
were associated with <strong>to</strong>rnadoes in New York State on 24<br />
days from 1989 <strong>to</strong> 1992 were examined. In L95, 111 days<br />
from 1989 <strong>to</strong> 1993 with severe wea<strong>the</strong>r in New York State<br />
were examined, 37 <strong>of</strong> which produced <strong>to</strong>rnadoes. In that<br />
study, an analysis was carried out <strong>to</strong> differentiate <strong>the</strong><br />
general atmospheric conditions that were associated with<br />
<strong>to</strong>rnadic thunders<strong>to</strong>rm days, major severe thunders<strong>to</strong>rm<br />
days, and minor severe thunders<strong>to</strong>rm days. The data on<br />
<strong>the</strong> <strong>to</strong>rnadic and severe thunders<strong>to</strong>rm days were<br />
obtained from S<strong>to</strong>rm Data (U.S. Department <strong>of</strong><br />
Commerce 1989-1993). In ML97 a statistical analysis<br />
was carried out <strong>to</strong> develop an equation <strong>to</strong> make conditional<br />
<strong>forecast</strong>s <strong>of</strong> <strong>the</strong> <strong>severity</strong> <strong>of</strong> a thunders<strong>to</strong>rm day<br />
given <strong>the</strong> occurrence <strong>of</strong> thunders<strong>to</strong>rms. The purpose <strong>of</strong><br />
<strong>the</strong> equation was <strong>to</strong> provide objective statistical guidance<br />
<strong>to</strong> <strong>forecast</strong>ers, using many <strong>of</strong> <strong>the</strong> methods and <strong>to</strong>ols <strong>forecast</strong>ers<br />
had been using for years <strong>to</strong> make subjective<br />
assessments <strong>of</strong> <strong>the</strong> potential for severe convection. The<br />
equation's objective output was based on <strong>the</strong> <strong>forecast</strong>er's<br />
subjective assessment <strong>of</strong> <strong>the</strong> general atmospheric conditions<br />
expected at <strong>the</strong> time <strong>of</strong> <strong>the</strong> event. That analysis was<br />
performed using thunders<strong>to</strong>rm data from L95 as part <strong>of</strong><br />
<strong>the</strong> <strong>development</strong>al sample. These data included 37 <strong>to</strong>rnadic<br />
thunders<strong>to</strong>rm days, 37 major severe thunders<strong>to</strong>rm<br />
days, and 37 minor severe thunders<strong>to</strong>rm days. In order <strong>to</strong><br />
include a sample <strong>of</strong> non-severe thunders<strong>to</strong>rm days, that<br />
data set (L95) was expanded <strong>to</strong> include an additional 37<br />
days where thunders<strong>to</strong>rms occurred, but no severe<br />
wea<strong>the</strong>r was reported. The distributions <strong>of</strong> <strong>the</strong>se thunders<strong>to</strong>rm<br />
days by month and by year are shown in Fig. 1.<br />
The <strong>equations</strong> developed in this study are based on <strong>the</strong><br />
148 days used in ML97 for <strong>the</strong> period from January 1989<br />
through December 1993.<br />
For each <strong>of</strong> <strong>the</strong> 148 days used, a sounding was constructed<br />
<strong>to</strong> approximate <strong>the</strong> synoptic-scale atmospheric<br />
conditions at <strong>the</strong> time <strong>of</strong> <strong>the</strong> event. Actual atmospheric<br />
soundings from across <strong>the</strong> nor<strong>the</strong>astern United States<br />
were examined, and <strong>the</strong> sounding that was considered <strong>to</strong><br />
be most representative <strong>of</strong> <strong>the</strong> airmass over <strong>the</strong> location<br />
where <strong>to</strong>rnadoes, severe or non-severe thunders<strong>to</strong>rms<br />
occurred was selected. This sounding was <strong>the</strong>n modified<br />
using <strong>the</strong> Skew-T Hodograph Analysis and Research<br />
Program (SHARP) (Hart and Korotky 1991) for observed<br />
surface temperature, dewpoint and wind from a surface<br />
observation site near <strong>the</strong> location and at <strong>the</strong> time <strong>of</strong> <strong>the</strong><br />
thunders<strong>to</strong>rms. On a few occasions, additional subjective<br />
modifications were made if significant <strong>the</strong>rmal advection<br />
al<strong>of</strong>t was evident, or changes <strong>to</strong> <strong>the</strong> vertical wind pr<strong>of</strong>ile<br />
were warranted due <strong>to</strong> wind speed and/or direction<br />
changes al<strong>of</strong>t.
54<br />
National Wea<strong>the</strong>r Digest<br />
Table 1. Definitions <strong>of</strong> <strong>hail</strong> size categories and <strong>of</strong> number <strong>of</strong><br />
event categories.<br />
Hail size Hail Size Event Number<br />
category (in.) category <strong>of</strong> events<br />
Table 2.<br />
Volume 24 Numbers 1, 2 June 2000<br />
55<br />
Table 3.<br />
Wet-bulb zero categories.<br />
Wet-bulb zero<br />
(ft)<br />
~ 8000<br />
8100 - 9000<br />
9100 -10900<br />
11000 - 11900<br />
12000 - 12900<br />
13000 - 13900<br />
~ 14000<br />
Wet-bulb zero<br />
category<br />
will be discussed later in <strong>the</strong> paper. The s<strong>to</strong>rm motion<br />
used <strong>to</strong> calculate <strong>the</strong> SRH was determined primarily<br />
from radar data. However, on <strong>the</strong> few occasions when<br />
radar data was not available, <strong>the</strong> s<strong>to</strong>rm motion was estimated<br />
using SHARP default s<strong>to</strong>rm motion and <strong>the</strong> text <strong>of</strong><br />
NWS warnings and statements.<br />
The 24 initial meteorological parameters that were<br />
examined were all parameters calculated by SHARP.<br />
They were chosen based on <strong>the</strong>ir applicability <strong>to</strong> <strong>the</strong> problem<br />
<strong>of</strong> <strong>hail</strong> <strong>forecast</strong>ing. Only parameters included in <strong>the</strong><br />
SHARP program were considered as candidates because<br />
<strong>of</strong> <strong>the</strong> requirement that all parameters used for equation<br />
<strong>development</strong> be readily available on a daily basis, both<br />
for operational use, and for <strong>the</strong> construction <strong>of</strong> <strong>the</strong> 148<br />
soundings used for equation <strong>development</strong>. The o<strong>the</strong>r 14<br />
meteorological parameters included <strong>the</strong> Bulk Richardson<br />
number, freezing level, deviation <strong>of</strong> <strong>the</strong> freezing level,<br />
deviation <strong>of</strong> <strong>the</strong> -20°C level, precipitable water, Theta E<br />
Index, 700-500 mb lapse rate, wet-bulb zero, s<strong>to</strong>rm-relative<br />
inflow, thickness <strong>of</strong> <strong>the</strong> O°C <strong>to</strong> -20°C layer, height <strong>of</strong><br />
<strong>the</strong> -20°C level, 500-mb temperature, 500-mb dewpoint<br />
depression and <strong>the</strong> 0-2 km s<strong>to</strong>rm relative moisture flux.<br />
From <strong>the</strong> 148 cases, 25 were randomly selected <strong>to</strong> be<br />
used as a validation data sample. The remaining 123<br />
days were used as <strong>the</strong> <strong>development</strong> data sample for <strong>the</strong><br />
actual forward screening regression analysis. Based on<br />
<strong>the</strong> definitions <strong>of</strong> <strong>the</strong> severe wea<strong>the</strong>r categories in ML97,<br />
<strong>the</strong> validation sample included seven <strong>to</strong>rnadic events, six<br />
major severe wea<strong>the</strong>r events, six minor severe wea<strong>the</strong>r<br />
events, and six days with no severe wea<strong>the</strong>r. Regression<br />
<strong>equations</strong> for <strong>the</strong> <strong>hail</strong> <strong>severity</strong> category and maximum<br />
<strong>hail</strong> size were determined and <strong>the</strong> validation data set was<br />
used <strong>to</strong> test <strong>the</strong>se <strong>equations</strong>. Three case studies are also<br />
presented <strong>to</strong> illustrate <strong>the</strong> application <strong>of</strong> <strong>the</strong> predic<strong>to</strong>r<br />
<strong>equations</strong>.<br />
4. Regression Analysis Results<br />
Table 4 shows <strong>the</strong> correlation <strong>of</strong> <strong>the</strong> 10 predic<strong>to</strong>rs used<br />
with <strong>the</strong> <strong>predict</strong>and data samples for <strong>the</strong> <strong>hail</strong> <strong>severity</strong><br />
categories and <strong>the</strong> maximum <strong>hail</strong> size. The CAPE was<br />
<strong>the</strong> predic<strong>to</strong>r most highly correlated with both <strong>predict</strong>ands,<br />
followed closely by <strong>the</strong> LI. The EHI was <strong>the</strong> third<br />
most correlated predic<strong>to</strong>r. The least correlated predic<strong>to</strong>r<br />
was <strong>the</strong> WBZCAT.<br />
Based on numerous iterations <strong>of</strong> <strong>the</strong> statistical s<strong>of</strong>tware,<br />
it was determined that <strong>the</strong> best possible <strong>equations</strong><br />
2<br />
0<br />
2<br />
3<br />
4<br />
Table 4. Correlation <strong>of</strong> <strong>the</strong> 10 predic<strong>to</strong>rs with <strong>the</strong> <strong>predict</strong>and<br />
data sample for <strong>the</strong> overall haif <strong>severity</strong> category and <strong>the</strong> maximum<br />
<strong>hail</strong> size.<br />
Haif<br />
Severity<br />
Maximum<br />
Hail Size<br />
Lifted Index (U) (0C) -.5340 -.4574<br />
Equilibrium Level (EQLV) (k-ft) .3175 .3388<br />
Mean \fI.!ind (kt) .2890 .3083<br />
Convective Available Potential .5418 .5119<br />
Energy (CAPE) (J kg")<br />
Total Totals Index (TT) (0C) .3093 .2923<br />
Sweat Index .3121 .3076<br />
Energy-Heficity Index (EHI) .4020 .4083<br />
S<strong>to</strong>rm-relative Helicity .3069 .3741<br />
(SRH) (m2 S·2)<br />
Wet-bulb Zero Category (WBZCAT) -.1693 -.1198<br />
850-mb Temperature (850T) (0C) .3237 .3178<br />
for <strong>predict</strong>ing <strong>the</strong> <strong>hail</strong> <strong>severity</strong> category and <strong>the</strong> maximum<br />
<strong>hail</strong> size (<strong>equations</strong> that maximized <strong>the</strong> number <strong>of</strong><br />
correct <strong>forecast</strong>s on <strong>the</strong> validation data sample) were sixterm<br />
<strong>equations</strong>, which included <strong>the</strong> CAPE, SRH, TT,<br />
850T, EQLV (in thousands <strong>of</strong> ft), and <strong>the</strong> WBZCAT. The<br />
equation for overall <strong>hail</strong> <strong>severity</strong> (CAT) was:<br />
CAT = - .144(EQLV) - .502(WBZCAT) + .00182(CAPE) + .0804(TT) (1)<br />
+ .00605(SRH) + .203(850T) + .153<br />
If CAT was less than 3.5, a non-severe <strong>hail</strong> day was<br />
<strong>forecast</strong>. If CAT was greater than or equal <strong>to</strong> 3.5 but less<br />
than 5.5, a minor severe <strong>hail</strong> day was <strong>forecast</strong>. For CAT<br />
greater than or equal <strong>to</strong> 5.5 but less than 7.5, a major<br />
severe <strong>hail</strong> day was <strong>predict</strong>ed, and for CAT greater than<br />
or equal <strong>to</strong> 7.5, an extreme event day was <strong>forecast</strong>. The<br />
<strong>hail</strong> <strong>severity</strong> categories are summarized in Table 2.<br />
The <strong>forecast</strong> equation for maximum <strong>hail</strong> size (SIZE) in<br />
inches was:<br />
SIZE = - .0318(EQLV) + .000483(CAPE) + .0235(TT) (2)<br />
+ .00233 (SRH) - .124 (WBZCAT) + .0548 (850T) - .772<br />
a. Physical basis <strong>of</strong> predic<strong>to</strong>rs<br />
CAPE and LI were found <strong>to</strong> be <strong>the</strong> 2 variables best correlated<br />
with <strong>hail</strong> size and <strong>the</strong> <strong>hail</strong> <strong>severity</strong> categories.<br />
This is not surprising since <strong>the</strong> formation <strong>of</strong> severe <strong>hail</strong> is<br />
dependent on an updraft strong enough <strong>to</strong> support <strong>the</strong><br />
weight <strong>of</strong> a <strong>hail</strong>s<strong>to</strong>ne long enough <strong>to</strong> allow growth <strong>to</strong> .75<br />
inch diameter or larger, and updraft strength is strongly<br />
dependent on atmospheric instability (Johns and Doswell<br />
1992). CAPE represents <strong>the</strong> <strong>to</strong>tal buoyancy <strong>of</strong> a rising air<br />
parcel integrated from <strong>the</strong> level <strong>of</strong> free convection <strong>to</strong> <strong>the</strong><br />
equilibrium level. The LI estimates instability by comparing<br />
<strong>the</strong> temperature <strong>of</strong> a rising parcel <strong>to</strong> <strong>the</strong> temperature<br />
<strong>of</strong> its environment at only a single level (usually 500<br />
mb). As a result, CAPE generally gives a better approximation<br />
<strong>of</strong> atmospheric instability. As <strong>the</strong> most highly correlated<br />
predic<strong>to</strong>r, <strong>the</strong> CAPE was selected first by <strong>the</strong>
56<br />
National Wea<strong>the</strong>r Digest<br />
regression program for both <strong>equations</strong>. However, once<br />
<strong>the</strong> CAPE was selected first, <strong>the</strong> LI became unimportant<br />
(despite <strong>the</strong> high correlation <strong>to</strong> <strong>the</strong> <strong>development</strong> sample)<br />
and does not appear in ei<strong>the</strong>r equation because it substantially<br />
duplicates <strong>the</strong> information presented by CAPE<br />
(<strong>the</strong>se two variables were also highly correlated with<br />
each o<strong>the</strong>r). Similarly, <strong>the</strong> EHI was highly correlated <strong>to</strong><br />
<strong>the</strong> <strong>development</strong> samples, but it does not appear in <strong>the</strong><br />
equation because <strong>the</strong> information it provides has already<br />
been accounted for by <strong>the</strong> CAPE and SRH. In contrast,<br />
<strong>the</strong> WBZCAT was <strong>the</strong> least correlated predic<strong>to</strong>r individually,<br />
but was selected as <strong>the</strong> third predic<strong>to</strong>r by <strong>the</strong> iterative<br />
regression process (after <strong>the</strong> CAPE and SRH had<br />
already been selected), because it had virtually no correlation<br />
with <strong>the</strong> o<strong>the</strong>r predic<strong>to</strong>rs and, thus, <strong>the</strong> information<br />
it provided had not already been accounted for.<br />
Observations and numerical simulations indicate<br />
wind shear is important in organizing convection. (e.g.,<br />
Fawbush and Miller 1954; Weisman and Klemp 1984).<br />
Given sufficient instability, increasing wind shear favors<br />
more organized multicellular and supercellular s<strong>to</strong>rms<br />
(Weisman and Klemp 1986). Observational experience<br />
suggests that very large <strong>hail</strong> is usually associated with<br />
supercells and well-organized multicellular systems<br />
(Johns and Doswell 1992). In addition, vertical shear<br />
may contribute <strong>to</strong> updraft strength. Brooks and<br />
Wilhelmson (1990) used numerical simulations <strong>to</strong> examine<br />
<strong>the</strong> relationship <strong>of</strong> updraft intensity <strong>to</strong> curvature<br />
shear <strong>of</strong> <strong>the</strong> environmental winds as measured by SRH.<br />
They concluded that this low-level shear as measured by<br />
SRH enhanced updraft intensity.<br />
The <strong>the</strong>rmal structure <strong>of</strong> <strong>the</strong> troposphere plays a role<br />
in <strong>the</strong> occurrence and size <strong>of</strong> <strong>hail</strong> at <strong>the</strong> surface <strong>of</strong> <strong>the</strong><br />
earth. Melting <strong>of</strong> a <strong>hail</strong>s<strong>to</strong>ne as it falls is related <strong>to</strong> its<br />
initial size, <strong>the</strong> depth <strong>of</strong> <strong>the</strong> above-freezing layer<br />
through which it falls and <strong>the</strong> temperature <strong>of</strong> this layer.<br />
The WBZ level approximates <strong>the</strong> height <strong>of</strong> <strong>the</strong> freezing<br />
level in <strong>the</strong> downdraft air <strong>of</strong> <strong>the</strong> thunders<strong>to</strong>rm. The<br />
higher <strong>the</strong> WBZ level and <strong>the</strong> warmer <strong>the</strong> air below it,<br />
<strong>the</strong> greater <strong>the</strong> melting and <strong>the</strong> lower <strong>the</strong> likelihood<br />
that large <strong>hail</strong>s<strong>to</strong>nes would reach <strong>the</strong> ground (Johns<br />
and Doswell 1992). The lower <strong>the</strong> WBZ level and <strong>the</strong><br />
colder <strong>the</strong> air below it, <strong>the</strong> less melting. However, WBZ<br />
levels that are <strong>to</strong>o low usually are indicative <strong>of</strong> atmospheric<br />
conditions that are not favorable for severe convection.<br />
Even if severe convection does occur, <strong>the</strong> convection<br />
will be shallow and not be conducive <strong>to</strong> <strong>the</strong> formation<br />
<strong>of</strong> large <strong>hail</strong>s<strong>to</strong>nes. Therefore, Miller (1972) felt<br />
that <strong>the</strong> probability <strong>of</strong> <strong>hail</strong> was greatest when <strong>the</strong> WBZ<br />
was within a certain range. In this study <strong>the</strong> WBZ (and<br />
<strong>the</strong> actual environmental freezing level) showed little<br />
correlation <strong>to</strong> <strong>hail</strong> size or <strong>hail</strong> <strong>severity</strong> category.<br />
However, <strong>the</strong> deviation <strong>of</strong> <strong>the</strong> WBZ from a given value<br />
was examined and this significantly improved <strong>the</strong> correlation.<br />
Using <strong>the</strong> deviation from 10,000 ft provided<br />
<strong>the</strong> best results. (The average WBZ for <strong>the</strong> <strong>development</strong><br />
data cases with severe <strong>hail</strong> was 10,900 ft). Forecaster<br />
experience indicated that an observed WBZ below this<br />
preferred level was not as detrimental as a deviation<br />
above <strong>the</strong> preferred level. This is because <strong>the</strong>re would<br />
be less time for a falling <strong>hail</strong>s<strong>to</strong>ne <strong>to</strong> melt when WBZ<br />
values exhibit a negative deviation. WBZ categories<br />
\<br />
based on <strong>the</strong> deviation from an ideal WBZ level were<br />
created (Table 3), and <strong>the</strong>se values were used in <strong>the</strong><br />
<strong>forecast</strong> equation.<br />
b. Evaluation <strong>of</strong> <strong>the</strong> <strong>predict</strong>ion <strong>equations</strong><br />
An evaluation <strong>of</strong> <strong>the</strong> <strong>equations</strong> on <strong>the</strong> <strong>development</strong><br />
sample <strong>of</strong> 123 cases revealed <strong>the</strong> following. The CAT<br />
equation showed an overall correlation with <strong>the</strong> <strong>development</strong><br />
sample <strong>of</strong> .50, while <strong>the</strong> correlation <strong>of</strong> <strong>the</strong> SIZE<br />
equation was .46. As a result, <strong>the</strong> <strong>equations</strong> account for<br />
25% (or nearly 25% percent) <strong>of</strong> <strong>the</strong> variance <strong>of</strong> <strong>the</strong> dependent<br />
variable for <strong>the</strong> CAT (SIZE) equation. The <strong>equations</strong><br />
were tested for significance using <strong>the</strong> F-test, and <strong>the</strong> F<br />
test showed that <strong>the</strong> regression analysis results were significant<br />
at <strong>the</strong> 99% confidence level for both <strong>equations</strong>.<br />
The <strong>predict</strong>ed mean value <strong>of</strong> <strong>the</strong> CAT (SIZE) equation<br />
was 5.04 (1.034), with a mean square error <strong>of</strong> 1.560<br />
(0.509). The residuals showed independence with near<br />
zero mean (a 0.096 mean for <strong>the</strong> CAT equation and a -<br />
0.060 mean for <strong>the</strong> SIZE equation). In addition, <strong>the</strong> residuals<br />
were evenly distributed around <strong>the</strong> mean.<br />
The <strong>equations</strong> were also evaluated on a validation<br />
sample <strong>of</strong> 25 cases. Using <strong>the</strong> categories provided in<br />
Table 2, <strong>the</strong> test results showed that <strong>the</strong> CAT equation<br />
was able <strong>to</strong> <strong>forecast</strong> <strong>the</strong> correct <strong>hail</strong> category 13 out <strong>of</strong> 25<br />
times. Of <strong>the</strong> 12 incorrect <strong>forecast</strong>s, none were incorrect<br />
by more than one category.<br />
The validation test results for <strong>the</strong> SIZE <strong>forecast</strong>s<br />
showed an average absolute error <strong>of</strong> .44 inches.<br />
Stratifying <strong>the</strong> validation sample in<strong>to</strong> <strong>the</strong> definitions <strong>of</strong><br />
<strong>the</strong> severe wea<strong>the</strong>r categories used in ML97, <strong>the</strong> average<br />
absolute <strong>hail</strong> size error for <strong>to</strong>rnadic thunders<strong>to</strong>rm days<br />
l-<br />
(/)<br />
3<br />
2.5<br />
2<br />
Volume 24 Numbers 1, 2 June 2000<br />
57<br />
was .68 inches, for major severe wea<strong>the</strong>r days it was .43<br />
inches, and for minor severe wea<strong>the</strong>r days it was .38<br />
inches. Figure 2 is a scatter plot <strong>of</strong> <strong>the</strong> <strong>forecast</strong> <strong>hail</strong> size<br />
<strong>to</strong> <strong>the</strong> observed <strong>hail</strong> size for 28 cases (<strong>the</strong> 25 validation<br />
cases plus three additional case study days which will be<br />
discussed in section 6). LineAin Fig. 2 represents <strong>the</strong> line<br />
<strong>of</strong> best fit for a hypo<strong>the</strong>tical maximum <strong>hail</strong> size equation<br />
that has no bias. Line B is <strong>the</strong> actual line <strong>of</strong> best fit for<br />
<strong>the</strong> 28 cases plotted in Fig. 2. Line B indicates that <strong>the</strong><br />
SIZE equation generally under<strong>forecast</strong>s <strong>the</strong> maximum<br />
<strong>hail</strong> size when <strong>the</strong> observed <strong>hail</strong> diameter is 0.75 in. or<br />
greater, and that <strong>the</strong> under<strong>forecast</strong> bias increases with<br />
observed <strong>hail</strong> size. In addition, <strong>the</strong>re is a tendency <strong>to</strong><br />
over<strong>forecast</strong> <strong>hail</strong> size for non-severe <strong>hail</strong>.<br />
An analysis <strong>of</strong> <strong>the</strong> categorical <strong>forecast</strong>s <strong>of</strong> <strong>hail</strong> <strong>severity</strong><br />
for <strong>the</strong> 25 validation sample days and <strong>the</strong> three case<br />
study days was done in order <strong>to</strong> determine if<strong>the</strong> <strong>forecast</strong>s<br />
were better than random chance. The Heidke skill score<br />
for <strong>the</strong>se 28 <strong>forecast</strong>s was 0.35 (random chance would<br />
produce a score <strong>of</strong> zero, while a perfect score would be<br />
one). Based on 28 <strong>forecast</strong>s and a four category <strong>forecast</strong><br />
matrix, a Heidke skill score <strong>of</strong> zero suggests that between<br />
seven and eight <strong>forecast</strong>s would be correct by random<br />
chance. If <strong>the</strong> <strong>forecast</strong> equation was perfect and <strong>the</strong><br />
Heidke skill score was one, <strong>the</strong>n all 28 <strong>forecast</strong>s would be<br />
correct. In this case, <strong>the</strong> Heidke skill score was 0.35 with<br />
16 <strong>of</strong> <strong>the</strong> 28 <strong>forecast</strong>s correct.<br />
5. Operational Use <strong>of</strong> <strong>the</strong> Forecast Equations<br />
For several years, <strong>forecast</strong>ers have used <strong>the</strong> SHARP<br />
s<strong>of</strong>tware application <strong>to</strong> modifY actual atmospheric soundings<br />
in order <strong>to</strong> make subjective assessments <strong>of</strong> convective<br />
potential. First, based on <strong>the</strong>ir assessment <strong>of</strong> <strong>the</strong><br />
general atmospheric conditions expected at a given time,<br />
<strong>the</strong>y would determine <strong>the</strong> likelihood <strong>of</strong> thunders<strong>to</strong>rms<br />
forming. Second, <strong>the</strong>y would determine <strong>the</strong> potential for<br />
'any thunders<strong>to</strong>rms that did form <strong>to</strong> become severe. More<br />
recently, output from numerical model <strong>forecast</strong> soundings<br />
has become available <strong>to</strong> field <strong>forecast</strong>ers. Using <strong>the</strong><br />
SHARP application, <strong>forecast</strong>ers can now analyze model<strong>forecast</strong><br />
soundings and make subjective assessments <strong>of</strong><br />
<strong>the</strong> potential for convection, and <strong>the</strong>y can do so as much<br />
as 48 hours in advance. The <strong>forecast</strong>er can accept <strong>the</strong><br />
model sounding or make modifications <strong>to</strong> it for model<br />
biases, local effects or observed data. In addition, <strong>forecast</strong>ers<br />
must also be aware <strong>of</strong> <strong>the</strong> effects <strong>of</strong> model generated<br />
convection on <strong>the</strong> <strong>predict</strong>ed <strong>the</strong>rmodynamic pr<strong>of</strong>iles.<br />
If <strong>the</strong> convective parameterization is triggered <strong>to</strong>o quickly<br />
(<strong>to</strong>o late) in <strong>the</strong> model, lapse rates and measures <strong>of</strong> stability<br />
will tend <strong>to</strong> be under<strong>forecast</strong> (over<strong>forecast</strong>) for a<br />
given <strong>forecast</strong> hour.<br />
Operationally, it is generally more useful <strong>to</strong> use<br />
SHARP-derived data from model <strong>forecast</strong> soundings as<br />
input <strong>to</strong> <strong>the</strong> <strong>equations</strong> (Hart et al. 1998). Model soundings<br />
provide objective assessments <strong>of</strong> temperature, moisture<br />
and wind pr<strong>of</strong>iles valid for <strong>the</strong> exact time <strong>the</strong> <strong>forecast</strong>er<br />
is interested in. Observed atmospheric soundings<br />
can also be used <strong>to</strong> provide input in<strong>to</strong> <strong>the</strong> <strong>equations</strong>.<br />
However, since observed atmospheric soundings are typically<br />
used <strong>to</strong> <strong>forecast</strong> potential severe wea<strong>the</strong>r 6 <strong>to</strong> 12<br />
hours after <strong>the</strong> sounding observation time, <strong>the</strong>y may<br />
\<br />
require more extensive subjective modification than a<br />
model sounding.<br />
The CAT and SIZE <strong>equations</strong> were developed using a<br />
sample <strong>of</strong> modified soundings, constructed <strong>to</strong> approximate<br />
<strong>the</strong> general synoptic scale atmospheric conditions<br />
at <strong>the</strong> time <strong>of</strong> <strong>the</strong> event. During operations, output from<br />
application programs (such as SHARP) that examine<br />
numerical model soundings or actual soundings is used<br />
as input <strong>to</strong> <strong>the</strong> <strong>equations</strong> in order <strong>to</strong> make objective conditional<br />
pategorical <strong>forecast</strong>s <strong>of</strong> <strong>hail</strong> <strong>severity</strong> and maximum<br />
<strong>hail</strong> size. Because <strong>the</strong> <strong>equations</strong> are conditional in<br />
nature, <strong>the</strong>y provide guidance on <strong>the</strong> overall <strong>hail</strong> <strong>severity</strong><br />
and <strong>the</strong> maximum size <strong>of</strong> <strong>the</strong> <strong>hail</strong>, given that thunders<strong>to</strong>rms<br />
actually occur.<br />
Operationally, <strong>forecast</strong>ers can use <strong>the</strong>se <strong>equations</strong> <strong>to</strong><br />
determine <strong>the</strong> <strong>hail</strong> threat for a particular location, or, by<br />
applying <strong>the</strong>se <strong>equations</strong> <strong>to</strong> model soundings at a number<br />
<strong>of</strong> locations, <strong>forecast</strong>ers can attempt <strong>to</strong> identifY <strong>the</strong><br />
location within <strong>the</strong>ir <strong>forecast</strong> area most prone <strong>to</strong> severe<br />
<strong>hail</strong>. Forecasters can use <strong>the</strong>se <strong>equations</strong> well in advance<br />
<strong>of</strong> <strong>the</strong> initiation <strong>of</strong> convection in order <strong>to</strong> provide <strong>the</strong> public<br />
with sufficient advance notice <strong>of</strong> possible severe<br />
wea<strong>the</strong>r, and <strong>to</strong> help determine <strong>the</strong> need for extra<br />
staffing. They can also use <strong>the</strong> <strong>equations</strong> in real time and<br />
make adjustments <strong>to</strong> model or actual soundings based on<br />
observed values such as surface temperature and dewpoint,<br />
wind structure based on WSR-88D wind pr<strong>of</strong>iles or<br />
surface data, and observed s<strong>to</strong>rm motion. When used in<br />
real time and with observed values, <strong>forecast</strong>ers can use<br />
<strong>the</strong> <strong>equations</strong> <strong>to</strong> determine if <strong>the</strong>ir initial evaluation <strong>of</strong><br />
<strong>the</strong> severe wea<strong>the</strong>r potential was correct, and, if not,<br />
make last minute adjustments <strong>to</strong> public <strong>forecast</strong> products<br />
and staffing needs.<br />
6. Case Studies<br />
As an additional test <strong>of</strong> <strong>the</strong> <strong>equations</strong>' ability <strong>to</strong> provide<br />
useful guidance <strong>to</strong> <strong>forecast</strong>ers, three extreme <strong>hail</strong><br />
days that were not part <strong>of</strong> <strong>the</strong> 25 day validation data set<br />
were examined. The first case, 29 May 1995, included<br />
widespread severe wea<strong>the</strong>r across <strong>the</strong> nor<strong>the</strong>ast portion<br />
<strong>of</strong> <strong>the</strong> U S. including an F3 <strong>to</strong>rnado. On that day, thunders<strong>to</strong>rms,<br />
including supercells, developed in a very<br />
unstable (CAPE 2489 J kg!) and highly sheared (SRH<br />
324 m 2 S-2) environment as shown in Fig. 3a. There were<br />
67 reports (US. Department <strong>of</strong> Commerce 1995) <strong>of</strong><br />
severe <strong>hail</strong> across <strong>the</strong> Nor<strong>the</strong>ast. The CAT equation correctly<br />
<strong>predict</strong>ed an extreme <strong>hail</strong> day. While CAPE, TT,<br />
and EQLV had <strong>the</strong> greatest influence on <strong>the</strong> <strong>forecast</strong> <strong>of</strong><br />
an extreme <strong>hail</strong> event, SRH and 850T also had a significant<br />
influence on <strong>the</strong> <strong>forecast</strong>. The SIZE equation <strong>forecast</strong><br />
a maximum <strong>hail</strong> size <strong>of</strong> 2.02 inches as compared <strong>to</strong><br />
<strong>the</strong> observed maximum <strong>hail</strong> size <strong>of</strong> 1.75 inches. Table 5<br />
summarizes <strong>the</strong> values <strong>of</strong> <strong>the</strong> meteorological parameters<br />
input in<strong>to</strong> <strong>the</strong> <strong>equations</strong>. Table 6 gives <strong>the</strong> value <strong>of</strong> each<br />
term in <strong>the</strong> CAT equation. Table 7 gives <strong>the</strong> value <strong>of</strong> each<br />
term in <strong>the</strong> SIZE equation.<br />
The CAT equation again performed well for <strong>the</strong><br />
20 June 1995 case. On that day, <strong>the</strong> CAT equation correctly<br />
<strong>predict</strong>ed an extreme <strong>hail</strong> day. There were 33<br />
reports <strong>of</strong> large <strong>hail</strong> and 10 reports <strong>of</strong> damaging winds<br />
(US. Department <strong>of</strong> Commerce 1995). While atmospher-<br />
J
58<br />
National Wea<strong>the</strong>r Digest<br />
Table 5.<br />
Predic<strong>to</strong>rs values for 3 case studies.<br />
Case 1 Case 2 Case 3<br />
29 May 1995 20 June 1995 11 July 1995<br />
.1<br />
211<br />
EQLV (k ft) 40.7 46.2 36.5<br />
W8ZCAT 0 1 0<br />
CAPE 2489 3915 2931<br />
TT 55 53 50<br />
SRH 324 -2 -10<br />
850T 15.3 21.4 11.6<br />
Table 6. Values <strong>of</strong> each term in <strong>the</strong> categorical <strong>hail</strong> <strong>severity</strong><br />
<strong>forecast</strong> (CAT) equation, <strong>forecast</strong> and observed <strong>severity</strong> for <strong>the</strong><br />
three case studies.<br />
Case 1 Case 2 Case 3<br />
29 May 1995 20 June 1995 11 July 1995<br />
311<br />
411<br />
SII<br />
711<br />
85<br />
f:g ~==~~==~====~~~~==~~~~~~~<br />
8<br />
EQLV (k ft) -5.86 -6.65 -5.26<br />
W8ZCAT 0.00 -0.50 0.00<br />
CAPE +4.53 +7.13 +5.33<br />
TT +4.42 +4.26 +4.02<br />
SRH +1.96 -0.01 -0.06<br />
850T +3.11 +4.34 +2.35<br />
Constant +0.15 +0.15 +0.15<br />
CAT 8.31 8.72 6.53<br />
Forecast extreme extreme major<br />
<strong>hail</strong> event <strong>hail</strong> event <strong>hail</strong> event<br />
Observed extreme extreme extreme<br />
<strong>hail</strong> event <strong>hail</strong> event <strong>hail</strong> event<br />
a8<br />
all<br />
48<br />
58<br />
Table 7. Values <strong>of</strong> each term in <strong>the</strong> <strong>forecast</strong> <strong>hail</strong> size equation,<br />
<strong>forecast</strong> maximum <strong>hail</strong> size (SIZE) and observed maximum <strong>hail</strong><br />
size for <strong>the</strong> 3 case studies.<br />
Case 1 Case 2 Case 3<br />
29 May 1995 20 June 1995 11 July 1995<br />
EQLV (k ft) -1.29 -1.47 -1 .16<br />
W8ZCAT 0.00 -0.12 0.00<br />
CAPE +1.20 +1 .89 +1.42<br />
TT +1.29 +1.25 +1 .18<br />
SRH +0.75 0.00 -0.02<br />
850T +0.84 +1.17 +0.64<br />
Constant -0.77 -0.77 -0.77<br />
SIZE 2.02 in. 1.95 in. 1.29 in.<br />
Observed 1.75 in. 2.75 in. 2.75 in.<br />
max <strong>hail</strong> size<br />
ic buoyancy was extreme (CAPE 3915 J kgl), environmental<br />
winds were not strong (40 kt or less through <strong>the</strong><br />
troposphere) and low-level wind shear was small (SRH-<br />
2 m 2 S-2) (Fig. 3b). CAPE and EQLV had <strong>the</strong> most influence<br />
on <strong>the</strong> <strong>forecast</strong> <strong>of</strong> an extreme <strong>hail</strong> day, with IT and<br />
78<br />
as<br />
1~211<br />
~<br />
-1.8 ..<br />
Fig. 3. Soundings for 29 May 1995 (A); 20 June 1995 (8); and<br />
11 July 1995 (C) with <strong>the</strong> horizontal axis temperature (0C) and vertical<br />
axis pressure (mb x 10). Solid lines represent environmental<br />
temperature (right) and dewpoint (left). The dotted line indicates<br />
<strong>the</strong> path <strong>of</strong> a surface-based lifted parcel. Wind barbs (kt) along <strong>the</strong><br />
right side are plotted using <strong>the</strong> standard convention.<br />
850T also making significant contributions <strong>to</strong> <strong>the</strong> <strong>forecast</strong>.<br />
The maximum size <strong>hail</strong> <strong>forecast</strong> was 1.95 inches<br />
with <strong>hail</strong> observed as large as 2.75 inches. Meteorological<br />
parameters, CAT equation terms, and SIZE equation<br />
terms are provided in Tables 5, 6 and 7 respectively.<br />
The 11 July 1995 case was similar <strong>to</strong> <strong>the</strong> 20 June 1995<br />
case in that <strong>hail</strong> was <strong>the</strong> predominant form <strong>of</strong> severe<br />
wea<strong>the</strong>r. There were 22 reports <strong>of</strong>large <strong>hail</strong> in <strong>the</strong> nor<strong>the</strong>astern<br />
U. S. and just 4 reports <strong>of</strong> wind damage (U.S.<br />
Department <strong>of</strong> Commerce 1995). The atmosphere was<br />
quite unstable (CAPE 2931 J kgl), but not as unstable as<br />
<strong>the</strong> 20 June 1995 case. Winds were relatively light<br />
through <strong>the</strong> troposphere with minimal low-level wind
Volume 24 Numbers 1,2 June 2000<br />
59<br />
shear (SRH = -10 m 2 S·2) (Fig. 3c). The <strong>forecast</strong> <strong>equations</strong><br />
both underestimated <strong>the</strong> <strong>severity</strong> <strong>of</strong> this <strong>hail</strong> day. The<br />
CAT equation <strong>forecast</strong> a major <strong>hail</strong> day as compared <strong>to</strong><br />
<strong>the</strong> observed extreme day. The SIZE equation <strong>forecast</strong> <strong>of</strong><br />
1.29 inches was well below <strong>the</strong> maximum observed size <strong>of</strong><br />
2.75 inches. Several fac<strong>to</strong>rs may have contributed <strong>to</strong> <strong>the</strong><br />
error in <strong>the</strong> <strong>forecast</strong>. First, as discussed, <strong>the</strong> equation for<br />
SIZE is biased <strong>to</strong>ward under<strong>forecast</strong>ing <strong>hail</strong> size (Fig. 2).<br />
In addition, inaccuracies in <strong>the</strong> sounding created <strong>to</strong><br />
describe atmospheric conditions on 11 July may have<br />
contributed <strong>to</strong> errors in <strong>the</strong> <strong>forecast</strong> <strong>equations</strong>. Third,<br />
standard sounding data provide only limited information<br />
that is relevant <strong>to</strong> <strong>hail</strong> formation processes, especially<br />
microphysical aspects <strong>of</strong> <strong>hail</strong> formation such as drop size<br />
distributions and entrainment rates. Finally, since <strong>hail</strong><br />
size is usually estimated ra<strong>the</strong>r than measured directly,<br />
<strong>the</strong>re is uncertainty in <strong>the</strong> accuracy <strong>of</strong> <strong>the</strong> <strong>hail</strong> size data<br />
base, and any inaccuracies can lead <strong>to</strong> equation <strong>forecast</strong><br />
errors. Meteorological parameters, CAT equation terms,<br />
and SIZE equation terms are provided in Tables 5, 6 and<br />
7 respectively.<br />
7. Discussion<br />
Forecasters at <strong>the</strong> NWS <strong>forecast</strong> <strong>of</strong>fice at Albany have<br />
found that <strong>the</strong> equation developed in ML97, which provides<br />
guidance on <strong>forecast</strong>ing days when <strong>to</strong>rnadic, non-<strong>to</strong>rnadic<br />
but severe, and non-severe thunders<strong>to</strong>rms occur, <strong>to</strong><br />
be a useful <strong>to</strong>ol in assessing <strong>the</strong> potential for severe convection.<br />
However, <strong>the</strong> equation didn't identifY whe<strong>the</strong>r <strong>the</strong><br />
main threat from non-<strong>to</strong>rnadic severe s<strong>to</strong>rms was damaging<br />
winds or large <strong>hail</strong>. This update <strong>to</strong> that study developed<br />
<strong>equations</strong> <strong>to</strong> <strong>forecast</strong> <strong>the</strong> categorical <strong>severity</strong> <strong>of</strong> a <strong>hail</strong><br />
day and <strong>the</strong> maximum <strong>hail</strong> size. The CAT equation showed<br />
an overall correlation with <strong>the</strong> <strong>development</strong> data <strong>of</strong> .50<br />
while <strong>the</strong> overall correlation <strong>of</strong> <strong>the</strong> SIZE equation was .46.<br />
These regression analysis results were tested for significance<br />
using <strong>the</strong> F-test, and <strong>the</strong> F-test showed that <strong>the</strong><br />
regression analysis results were significant at <strong>the</strong> 99% confidence<br />
level for both <strong>equations</strong>. Based on <strong>the</strong> validation<br />
data, CAT equation <strong>forecast</strong>s <strong>of</strong> <strong>hail</strong> <strong>severity</strong> showed a<br />
Heidke skill score <strong>of</strong> 0.35. In comparison, <strong>the</strong> convective<br />
potential equation developed in ML97 showed greater skill<br />
with an overall correlation <strong>to</strong> <strong>the</strong> <strong>development</strong> data sample<br />
<strong>of</strong> .64, and validation data <strong>forecast</strong> results producing a<br />
Heidke skill score <strong>of</strong> 0.48. Despite <strong>the</strong> lower scores for <strong>the</strong><br />
<strong>hail</strong> <strong>equations</strong>, <strong>the</strong> validation test results for maximum<br />
<strong>hail</strong> size and <strong>the</strong>ir graphical representation in Fig. 2 are<br />
similar <strong>to</strong> <strong>the</strong> <strong>forecast</strong> <strong>of</strong> maximum <strong>hail</strong> size results<br />
achieved by Moore and Pino (1990), and much better than<br />
<strong>the</strong> results achieved by Fawbush and Miller (1953).<br />
The conditional nature <strong>of</strong> <strong>the</strong> two <strong>hail</strong> <strong>equations</strong> necessitates<br />
a two step approach <strong>to</strong> its application. First, <strong>forecast</strong>ers<br />
must assess <strong>the</strong> likelihood that deep convection<br />
will develop. The output from <strong>the</strong>se <strong>equations</strong> is not<br />
intended <strong>to</strong> provide any guidance for this <strong>forecast</strong> problem.<br />
Thus, if thunders<strong>to</strong>rms are not expected or do not<br />
form, <strong>the</strong>n <strong>the</strong> <strong>equations</strong>' output has no meaning. If<br />
analyses <strong>of</strong> observed data and numerical model output<br />
indicate thunders<strong>to</strong>rms are possible, or if thunders<strong>to</strong>rms<br />
are already occurring, <strong>the</strong>n <strong>the</strong> <strong>equations</strong>' output should<br />
provide useful guidance. In addition, when using <strong>the</strong><br />
<strong>equations</strong> with numerical model output, systematic<br />
errors <strong>of</strong> <strong>the</strong> model will be reflected as systematic errors<br />
in <strong>the</strong> <strong>forecast</strong>s from <strong>the</strong> <strong>equations</strong>. However, if <strong>forecast</strong>ers<br />
are aware <strong>of</strong> model errors or biases for <strong>the</strong>ir area,<br />
<strong>the</strong>y can subjectively adjust <strong>the</strong> model output, <strong>the</strong>reby<br />
reducing <strong>the</strong> impact <strong>of</strong> this limitation. Finally, even<br />
though <strong>the</strong>se <strong>equations</strong> should only be applied in <strong>the</strong> specific<br />
geographic area for which <strong>the</strong>y were derived, <strong>the</strong><br />
methods used <strong>to</strong> develop <strong>the</strong>m can be applied elsewhere.<br />
Acknowledgments<br />
The authors would like <strong>to</strong> thank Laurie Hogan <strong>of</strong> <strong>the</strong><br />
NWS Eastern Region Headquarters for her constructive<br />
review <strong>of</strong> this paper. Thanks also <strong>to</strong> David Kitzmiller <strong>of</strong><br />
<strong>the</strong> NWS Techniques Development Labora<strong>to</strong>ry, and<br />
Steven Weiss <strong>of</strong> <strong>the</strong> NWS S<strong>to</strong>rm Prediction Center for<br />
<strong>the</strong>ir thorough reviews <strong>of</strong> this paper. Data for this study<br />
came from <strong>the</strong> NWS Albany Meso-Clima<strong>to</strong>logical<br />
Project's data archives.<br />
Authors<br />
Kenneth LaPenta has been a Lead Forecaster at <strong>the</strong><br />
NWS Forecast Office at Albany, New York since 1986.<br />
Prior <strong>to</strong> joining <strong>the</strong> NWS in 1975 he worked at <strong>the</strong><br />
National Hurricane Research Labora<strong>to</strong>ry in Coral<br />
Cables, Florida and with S<strong>to</strong>ne and Webster<br />
Engineering Corporation in Bos<strong>to</strong>n, Massachusetts. He<br />
earned a B.S. in Meteorology in 1971, and a M.S. in<br />
Meteorology in 1973 from Saint Louis University. His<br />
primary research interests are <strong>the</strong> analysis and <strong>forecast</strong>ing<br />
<strong>of</strong> severe s<strong>to</strong>rms in <strong>the</strong> nor<strong>the</strong>ast U.S. Mr.<br />
LaPenta shared <strong>the</strong> NWA Operational Achievement<br />
Group Award for <strong>the</strong> year 2000 with Jonathan Blaes for<br />
outstanding teamwork in issuing early special wea<strong>the</strong>r<br />
statements and warnings resulting in no lives lost from<br />
<strong>the</strong> <strong>to</strong>rnadoes that hit New York's Montgomery and<br />
Sara<strong>to</strong>ga Counties on 31 May 1998.<br />
George Maglaras has been a Lead Forecaster at <strong>the</strong><br />
NWS Forecast Office at Albany, New York since 1988.<br />
He is interested in statistical <strong>forecast</strong> methods and<br />
analysis, and in <strong>forecast</strong> verification. From 1980 <strong>to</strong> 1986<br />
he worked at <strong>the</strong> Techniques Development Labora<strong>to</strong>ry<br />
in Silver Spring, Maryland. Between 1986 and 1988 he<br />
worked at <strong>the</strong> NWS Forecast Office in Washing<strong>to</strong>n,<br />
D.C., where he was part <strong>of</strong> <strong>the</strong> Satellite Field Service<br />
Station. He earned his B.S. Degree in Meteorology in<br />
1978, and a M.s. Degree in Computer Science in 1981<br />
from <strong>the</strong> City College <strong>of</strong> <strong>the</strong> City University <strong>of</strong> New<br />
York. In addition, between 1984 and 1986 he completed<br />
all course work <strong>to</strong>ward a M.s. Degree in Meteorology at<br />
<strong>the</strong> University <strong>of</strong> Maryland.<br />
Robert Mundschenk earned his B.S. degree in<br />
Meteorology in 1985 from <strong>the</strong> State University <strong>of</strong> New<br />
York at Oswego. He began his National Wea<strong>the</strong>r Service<br />
career in 1989 at <strong>the</strong> NWS Forecast Office in Buffalo,<br />
New York. He was a <strong>forecast</strong>er at <strong>the</strong> NWS Forecast<br />
Office at Albany, New York, from 1995 <strong>to</strong> 1998, and is<br />
currently a <strong>forecast</strong>er at <strong>the</strong> NWS Office at<br />
Bingham<strong>to</strong>n, New York. He is interested in radar meteorology<br />
and lake-effect snow <strong>forecast</strong>ing.<br />
I I
60<br />
National Wea<strong>the</strong>r Digest<br />
References<br />
Brooks, H. E., and R. B. Wilhelmson, 1990: The effect <strong>of</strong><br />
low-level hodograph curvature on supercell structure.<br />
Preprints, 16th Conference on Severe Local S<strong>to</strong>rms,<br />
Kananaskis Park, Alberta, Amer. Meteor. Soc., 588-592.<br />
____ , C. A Doswell III and J. Cooper, 1994: On <strong>the</strong><br />
environments <strong>of</strong><strong>to</strong>rnadic and non-<strong>to</strong>rnadic mesocyclones.<br />
Wea. Forecasting, 9, 606-618.<br />
Fawbush, E. J., and R. C. Miller, 1953: A method for <strong>forecast</strong>ing<br />
<strong>hail</strong>s<strong>to</strong>ne size at <strong>the</strong> Earth's surface. Bull. Amer.<br />
Meteor. Soc., 34, 235-244.<br />
__----::---:-::-' and<br />
, 1954: The types <strong>of</strong> airmasses<br />
in which North American <strong>to</strong>rnadoes form. Bull. Amer.<br />
Meteor. Soc., 35, 413-417.<br />
Hart, J. A, and W. Korotky, 1991: The SHARP workstation<br />
v1.50 users guide. National Wea<strong>the</strong>r Service, NOAA,<br />
U.S. Department <strong>of</strong> Commerce, 30 pp. [Available from<br />
NWS Eastern Region Headquarters, Scientific Services<br />
Division, 630 Johnson Ave., Bohemia, NY 11716.]<br />
Hart, R. E., G. S. Forbes, and R. H. Grumm, 1998: The<br />
use <strong>of</strong> hourly model-generated soundings <strong>to</strong> <strong>forecast</strong><br />
mesoscale phenomena. Part I: Initial assessment in <strong>forecast</strong>ing<br />
warm-season phenomena. Wea. Forecasting, 13,<br />
1165-1185.<br />
Johns, R. H., and C. A Doswell III, 1992: Severe local<br />
s<strong>to</strong>rms <strong>forecast</strong>ing. Wea. Forecasting, 7, 588-612.<br />
LaPenta, K. D., 1995: Forecasting <strong>to</strong>rnadic versus non<strong>to</strong>rnadic<br />
severe thunders<strong>to</strong>rms in New York State.<br />
Eastern Region Technical Attachment, No. 95-4A,<br />
National Wea<strong>the</strong>r Service, NOAA, U.S. Department <strong>of</strong><br />
Commerce, 15 pp.<br />
____ , and G. J. Maglaras, 1993: New York State<br />
Tornadoes. Eastern Region Technical Attachment, No. 93-<br />
12A, National Wea<strong>the</strong>r Service, NOAA, U.S. Department<br />
<strong>of</strong> Commerce, 13 pp.<br />
Maglaras, G. J., and K. D. LaPenta, 1997: Development <strong>of</strong><br />
a <strong>forecast</strong> equation <strong>to</strong> <strong>predict</strong> <strong>the</strong> <strong>severity</strong> <strong>of</strong> thunders<strong>to</strong>rm<br />
events in New York State. Natl. Wea. Dig., 21:3 , 3-9.<br />
Miller, R. C., 1972: Notes on analysis and severe s<strong>to</strong>rm<br />
<strong>forecast</strong>ing r procedures <strong>of</strong> <strong>the</strong> Air Force Global Wea<strong>the</strong>r<br />
Central. TR 200 (Rev.), Air Wea<strong>the</strong>r Service (MAC), U.S.<br />
Air Force.<br />
Moore, J . T. and J. P. Pino, 1990: An interactive method<br />
for estimating maximum <strong>hail</strong>s<strong>to</strong>ne size from <strong>forecast</strong><br />
soundings. Wea. Forecasting, 5, 508-525.<br />
SYSTAT Version 7.0.1 for Windows, 1997: SPSS Inc,<br />
Chicago, IL.<br />
u .S. Department <strong>of</strong> Commerce, 1989-1993, 1995: S<strong>to</strong>rm<br />
Data, 31-37.<br />
Weisman, M. L., and J. B. Klemp, 1984: The structure<br />
and classification <strong>of</strong> numerically simulated convective<br />
s<strong>to</strong>rms in directionally varying wind shears. Mon. Wea.<br />
Rev., 112,2479-2498.<br />
____" and , 1986: Characteristics <strong>of</strong> isolated<br />
convection. Mesoscale Meteorology and Forecasting,<br />
P. S. Ray, Ed., Amer. Meteor. Soc., 331-358.<br />
Wooldridge, M., and S. Burrus, 1995: Statistical<br />
COrrelation and Regression (SCORE). National Wea<strong>the</strong>r<br />
Service, NOAA, U.S. Department <strong>of</strong> Commerce.