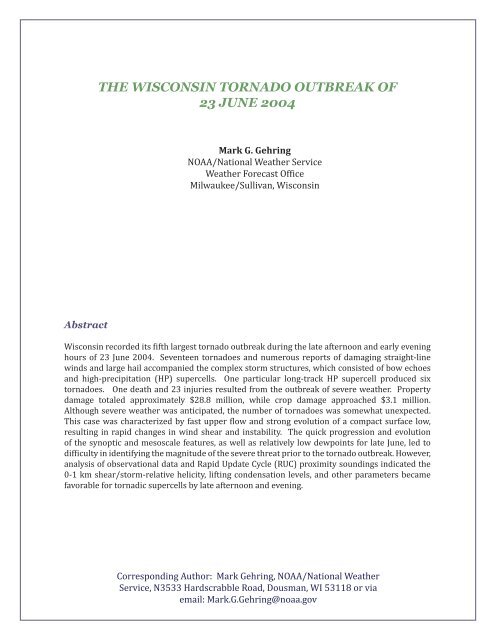
the wisconsin tornado outbreak of 23 june 2004 - National Weather ...
the wisconsin tornado outbreak of 23 june 2004 - National Weather ...
the wisconsin tornado outbreak of 23 june 2004 - National Weather ...

You also want an ePaper? Increase the reach of your titles
YUMPU automatically turns print PDFs into web optimized ePapers that Google loves.
THE WISCONSIN TORNADO OUTBREAK OF<br />
<strong>23</strong> JUNE <strong>2004</strong><br />
Mark G. Gehring<br />
NOAA/<strong>National</strong> Wea<strong>the</strong>r Service<br />
Wea<strong>the</strong>r Forecast Office<br />
Milwaukee/Sullivan, Wisconsin<br />
Abstract<br />
Wisconsin recorded its fifth largest <strong>tornado</strong> <strong>outbreak</strong> during <strong>the</strong> late afternoon and early evening<br />
hours <strong>of</strong> <strong>23</strong> June <strong>2004</strong>. Seventeen <strong>tornado</strong>es and numerous reports <strong>of</strong> damaging straight-line<br />
winds and large hail accompanied <strong>the</strong> complex storm structures, which consisted <strong>of</strong> bow echoes<br />
and high-precipitation (HP) supercells. One particular long-track HP supercell produced six<br />
<strong>tornado</strong>es. One death and <strong>23</strong> injuries resulted from <strong>the</strong> <strong>outbreak</strong> <strong>of</strong> severe wea<strong>the</strong>r. Property<br />
damage totaled approximately $28.8 million, while crop damage approached $3.1 million.<br />
Although severe wea<strong>the</strong>r was anticipated, <strong>the</strong> number <strong>of</strong> <strong>tornado</strong>es was somewhat unexpected.<br />
This case was characterized by fast upper flow and strong evolution <strong>of</strong> a compact surface low,<br />
resulting in rapid changes in wind shear and instability. The quick progression and evolution<br />
<strong>of</strong> <strong>the</strong> synoptic and mesoscale features, as well as relatively low dewpoints for late June, led to<br />
difficulty in identifying <strong>the</strong> magnitude <strong>of</strong> <strong>the</strong> severe threat prior to <strong>the</strong> <strong>tornado</strong> <strong>outbreak</strong>. However,<br />
analysis <strong>of</strong> observational data and Rapid Update Cycle (RUC) proximity soundings indicated <strong>the</strong><br />
0-1 km shear/storm-relative helicity, lifting condensation levels, and o<strong>the</strong>r parameters became<br />
favorable for tornadic supercells by late afternoon and evening.<br />
Corresponding Author: Mark Gehring, NOAA/<strong>National</strong> Wea<strong>the</strong>r<br />
Service, N3533 Hardscrabble Road, Dousman, WI 53118 or via<br />
email: Mark.G.Gehring@noaa.gov
Gehring<br />
1. Introduction<br />
The Wisconsin <strong>tornado</strong> <strong>outbreak</strong> during <strong>the</strong> late<br />
afternoon and evening (Galway 1977; Doswell et al. 2006)<br />
<strong>of</strong> <strong>23</strong> June <strong>2004</strong> consisted <strong>of</strong> seventeen <strong>tornado</strong>es (Fig. 1),<br />
including four that were strong (F2 and F3 on <strong>the</strong> Fujita<br />
scale; Fujita 1971). The tornadic storms and associated<br />
Fig. 1. Map <strong>of</strong> severe wea<strong>the</strong>r reports from 1430 UTC <strong>23</strong><br />
June <strong>2004</strong> through 0425 UTC 24 June <strong>2004</strong>.<br />
<strong>of</strong> <strong>the</strong> synoptic and mesoscale environments is discussed,<br />
and close monitoring <strong>of</strong> <strong>the</strong> rapidly evolving meteorological<br />
features and severe wea<strong>the</strong>r indices is emphasized. Finally,<br />
<strong>the</strong> challenges faced by forecasters are briefly discussed.<br />
2. Methodology and Data Sources<br />
The evolution <strong>of</strong> <strong>the</strong> synoptic and mesoscale<br />
environments was analyzed from early in <strong>the</strong> day over <strong>the</strong><br />
Nor<strong>the</strong>rn Plains to <strong>the</strong> eventual <strong>tornado</strong> <strong>outbreak</strong> over<br />
Wisconsin in <strong>the</strong> evening. The following data sources were<br />
utilized: Rapid Update Cycle (RUC)-based mesoanalysis<br />
graphics (Bothwell et al. 2002) from <strong>the</strong> NOAA/Storm<br />
Prediction Center (SPC) Web site [available on line at<br />
www.spc.noaa.gov/exper/mesoanalysis/]; RUC-20 model<br />
(Benjamin et al. <strong>2004</strong>) output viewed on a 40-km and 80-<br />
km grid available on <strong>the</strong> Wea<strong>the</strong>r Event Simulator (WES;<br />
Magsig et al. 2006); <strong>the</strong> wind pr<strong>of</strong>iler at Blue River, Wisconsin<br />
(BLRW3); surface observations from <strong>the</strong> Automated<br />
Surface Observing Systems (ASOS) and Automated Wea<strong>the</strong>r<br />
Observing Systems (AWOS); and radar images from <strong>the</strong><br />
Wea<strong>the</strong>r Surveillance Radar-1988 Doppler (WSR-88D).<br />
Severe wea<strong>the</strong>r parameters were calculated from<br />
six RUC analysis gridpoint soundings taken at ASOS and<br />
AWOS sites located near tornadic supercells (Fig. 2). Much<br />
research has focused on <strong>the</strong> use <strong>of</strong> proximity soundings to<br />
determine <strong>the</strong> near storm environment <strong>of</strong> tornadic versus<br />
nontornadic supercells (Markowski et al. 2003). The<br />
severe hail and wind were characterized by complex storm<br />
structures, bow echoes (Fujita 1978), and supercells that<br />
were primarily <strong>of</strong> <strong>the</strong> high-precipitation (HP) variety<br />
(Moller et al. 1990). One death and <strong>23</strong> injuries resulted<br />
from <strong>the</strong> <strong>outbreak</strong> <strong>of</strong> severe wea<strong>the</strong>r.<br />
This <strong>outbreak</strong> had only some <strong>of</strong> <strong>the</strong> “synoptically evident”<br />
parameters highlighted in o<strong>the</strong>r <strong>outbreak</strong>s by Doswell et<br />
al. (1993) and Johns and Doswell (1992). However, <strong>the</strong><br />
aforementioned authors pointed out that <strong>tornado</strong> episodes<br />
can still occur in <strong>the</strong>se situations, and in fact most <strong>tornado</strong><br />
days are not “synoptically evident.” As shown later, strong<br />
wind shear was in place over Wisconsin, but <strong>the</strong> surface<br />
low <strong>of</strong> approximately 1006 mb was relatively weak when<br />
compared to <strong>the</strong> “synoptically evident” <strong>tornado</strong> days. This<br />
was mainly due to <strong>the</strong> displacement <strong>of</strong> <strong>the</strong> 100 kt jet streak<br />
and strongest cyclonic vorticity advection to <strong>the</strong> north <strong>of</strong><br />
<strong>the</strong> surface low. The displacement <strong>of</strong> <strong>the</strong> upper-level jet<br />
streak, relatively low surface dewpoints (40s°F to lower<br />
50s°F) to begin <strong>the</strong> day, and <strong>the</strong> fast evolution/progression<br />
<strong>of</strong> <strong>the</strong> low and associated kinematic and <strong>the</strong>rmodynamic<br />
fields led to difficulty in identifying <strong>the</strong> severe threat by late<br />
afternoon and evening. In <strong>the</strong> present study, <strong>the</strong> evolution<br />
122 <strong>National</strong> Wea<strong>the</strong>r Digest<br />
Fig. 2. Map <strong>of</strong> AWOS and ASOS locations where RUC<br />
analysis gridpoint soundings were taken. Also, Blue River<br />
pr<strong>of</strong>iler and <strong>tornado</strong> tracks with F-scale intensity are<br />
shown.
Wisconsin Tornado Outbreak<br />
Fig. 3(a). RUC 300 mb analysis valid 1200 UTC <strong>23</strong> June<br />
<strong>2004</strong>. Thick solid lines are geopotential heights every 12<br />
dm. Black dashed lines are isotachs every 20 kt. Shading<br />
is 80 kt or greater. Thin solid gray lines are 300 mb<br />
Q-vector divergence (K m -2 1e16 s -1 ) while thin dashed<br />
lines are Q-vector convergence. RAOB data included with<br />
standard station model format.<br />
research by many authors has identified specific values <strong>of</strong><br />
various parameters that favor tornadic supercells versus<br />
values that favor nontornadic supercells, and thus <strong>the</strong><br />
findings <strong>of</strong> <strong>the</strong> proximity soundings from this <strong>tornado</strong><br />
<strong>outbreak</strong> will be investigated. The Sounding Toolkit Version<br />
1.5 (Bunkers et al. 2005; hereafter ST1.5), available on <strong>the</strong><br />
WES, and a locally developed program were utilized to<br />
generate severe wea<strong>the</strong>r parameters for <strong>the</strong>se proximity<br />
soundings. A virtual temperature correction was applied to<br />
<strong>the</strong> soundings for <strong>the</strong> analysis <strong>of</strong> <strong>the</strong>rmodynamic variables<br />
(Doswell and Rasmussen 1994). There was little to no<br />
convective precipitation produced by <strong>the</strong> RUC during <strong>the</strong><br />
time <strong>of</strong> <strong>the</strong> soundings; hence, no contamination from <strong>the</strong><br />
convective parameterization scheme occurred.<br />
3. Synoptic and Mesoscale Setting and Evolution<br />
a. 1200 UTC to 2100 UTC<br />
The upper air features (Fig. 3a-c) were dominated by a<br />
broad and cold cyclonic circulation centered over Manitoba<br />
and Ontario. A 300-mb (100 kt) jet and a 500-mb shortwave<br />
trough were digging sou<strong>the</strong>ast toward <strong>the</strong> Dakotas, with<br />
cold 500-mb temperatures from -16°C to -19°C already<br />
located over Wisconsin. Warm-air advection (5°C per 12<br />
Fig. 3(b). RUC 500 mb analysis valid 1200 UTC <strong>23</strong> June<br />
<strong>2004</strong>. Thick solid lines are geopotential heights every 6<br />
dm. Thin solid gray lines are 500 mb Q-vector divergence<br />
(K m -2 1e16 s -1 ) while thin dashed lines are Q-vector<br />
convergence. Shading is 500 mb vorticity advection <strong>of</strong><br />
5*1e9 s -1 or greater. RAOB data included with standard<br />
station model format.<br />
hour) was evident at 850 mb over nor<strong>the</strong>astern North<br />
Dakota and northwestern Minnesota (not shown). At <strong>the</strong><br />
surface (Fig. 3d), a cold front extended west from a 1010<br />
mb open wave <strong>of</strong> low pressure over sou<strong>the</strong>astern Manitoba,<br />
with a surface trough extending south <strong>of</strong> <strong>the</strong> low. Deep<br />
(low and mid levels) Q-vector convergence was evident<br />
with <strong>the</strong>se synoptic features over eastern North Dakota and<br />
northwestern Minnesota. Stronger upper-level Q-vector<br />
convergence was maximized upstream over sou<strong>the</strong>rn<br />
Manitoba, where <strong>the</strong> left exit region and greatest 500 mb<br />
cyclonic vorticity advection was located. Far<strong>the</strong>r east, a<br />
surface cold front extended from eastern Lake Superior<br />
to nor<strong>the</strong>rn Iowa. Surface dewpoints ranged from <strong>the</strong> 40s<br />
(°F) to <strong>the</strong> lower 50s (°F) across Minnesota and Wisconsin<br />
with areas <strong>of</strong> middle 50s (°F) dewpoints near and south<br />
<strong>of</strong> <strong>the</strong> cold front. The cold front was expected to stall with<br />
sufficient moisture and heating anticipated along and south<br />
<strong>of</strong> <strong>the</strong> front for surface-based convective initiation later<br />
in <strong>the</strong> day. This synoptic setup which included increasing<br />
vertical wind shear allowed forecasters to anticipate severe<br />
thunderstorms but not necessarily a <strong>tornado</strong> <strong>outbreak</strong>.<br />
More on <strong>the</strong> challenges <strong>of</strong> <strong>the</strong> forecast will be discussed in<br />
Section 4.<br />
Volume 31 Number 2 ~ December 2007 1<strong>23</strong>
Gehring<br />
Fig. 3(c). RUC 850 mb analysis valid 1200 UTC <strong>23</strong> June<br />
<strong>2004</strong>. Thick solid lines are geopotential heights every 3<br />
dm. Thin solid lines are temperature every 2°C. Shading<br />
are dewpoints <strong>of</strong> 4°C or greater. RUC wind barbs (kt)<br />
included and RAOB data included with standard station<br />
model format.<br />
Despite very low mean-layer (ML; Craven et al. 2002)<br />
convective available potential energy (MLCAPE) around<br />
100 J kg -1 (not shown) within <strong>the</strong> small warm sector over<br />
far eastern North Dakota and far northwestern Minnesota,<br />
organized convection developed by mid-morning as<br />
<strong>the</strong> Canadian cold front and aforementioned Q-vector<br />
convergence progressed across <strong>the</strong> region. The convection<br />
produced two weak (F0 and F1 on <strong>the</strong> Fujita scale) <strong>tornado</strong>es<br />
(Fig. 1). Boundary layer-6 km shear (not shown) from 50<br />
to 60 kt was prevalent across <strong>the</strong> Nor<strong>the</strong>rn Plains into<br />
northwestern Wisconsin. This strong deep layer shear is<br />
supportive <strong>of</strong> supercell storms (Weisman and Klemp 1982,<br />
1984). Johns et al. (1993) found that tornadic supercells can<br />
occur in environments with very low MLCAPE and strong<br />
shear. The low instability and high wind shear environment<br />
was prevalent throughout this event.<br />
By 1800 UTC, <strong>the</strong> cold front had moved across<br />
northwestern Minnesota and extended west into <strong>the</strong><br />
Dakotas (Fig. 4a). A warm front extended sou<strong>the</strong>astward<br />
across Minnesota into nor<strong>the</strong>rn Illinois where it joined with<br />
a stationary front, previously a cold front, Fig. 3d. A north<br />
to south surface trough had developed in <strong>the</strong> warm sector<br />
over southwestern Minnesota. The earlier convection was<br />
still ongoing along <strong>the</strong> cold front as seen in <strong>the</strong> 1815 UTC<br />
Fig. 3(d). Subjective surface analysis valid 1200 UTC <strong>23</strong><br />
June <strong>2004</strong>. Black dashed lines are RUC analysis 1000-850<br />
mb Q-vector convergence (K m -2 1e16 s -1 ). Solid lines are<br />
isobars contoured every 2 mb. Long and thick dashed line<br />
is a surface trough. Solid symbols are conventional surface<br />
features. Standard station model format are shown.<br />
Shading represents dewpoints <strong>of</strong> 55°F or greater.<br />
visible satellite image (Fig. 5a). Meanwhile a new area <strong>of</strong><br />
deep moist convection had developed just to <strong>the</strong> south<br />
near <strong>the</strong> intersection <strong>of</strong> <strong>the</strong> surface trough and cold front<br />
in west-central Minnesota. The new convection initiated<br />
in a narrow axis <strong>of</strong> MLCAPE (600 J kg -1 ) with much lower<br />
MLCAPE present to <strong>the</strong> east across Minnesota (not shown).<br />
The 1800 UTC wind fields (compared to 1200 UTC) had<br />
increased within <strong>the</strong> warm sector and behind <strong>the</strong> cold front.<br />
This was in response to dynamically induced isallobaric<br />
couplet that had developed across western Minnesota and<br />
North Dakota (Fig. 4a). The increased pressure gradient and<br />
low-level wind fields resulted in frontogenesis (Fig. 6) along<br />
<strong>the</strong> cold front, along with an increase in warm-air advection,<br />
1000 mb-850 mb equivalent potential temperature (<strong>the</strong>ta-e)<br />
advection, and <strong>the</strong> associated Q-vector convergence (Fig.<br />
7a) across most <strong>of</strong> Minnesota. These processes, along with<br />
strong insolation within <strong>the</strong> warm sector, were important<br />
factors in providing moisture, instability, and lift (Doswell<br />
1987) to developing convection as it moved east across<br />
sou<strong>the</strong>rn Minnesota during <strong>the</strong> afternoon. The deep moist<br />
convection that initiated near <strong>the</strong> surface trough and cold<br />
front intersection progressed eastward across sou<strong>the</strong>rn<br />
Minnesota (Fig. 5b) and did result in isolated to scattered<br />
severe hail and wind reports (Fig. 1). The convection<br />
124 <strong>National</strong> Wea<strong>the</strong>r Digest
Wisconsin Tornado Outbreak<br />
Fig. 4a-d. Subjective surface analysis for (a) 1800 UTC, (b) 2100 UTC, (c) 0000 UTC, (d) 0300 UTC.<br />
Solid lines are isobars contoured every 2 mb. Long dashed lines are surface troughs. Short dashed lines<br />
are 3-hour pressure change contoured every 2 mb. Solid symbols are conventional surface features.<br />
Standard station model format is shown. Shading represents dewpoints <strong>of</strong> 55°F or greater.<br />
Volume 31 Number 2 ~ December 2007 125
Gehring<br />
Fig. 5(a). Visible satellite image for 1815 UTC. Solid<br />
symbols are conventional surface features.<br />
would eventually evolve into a significant severe convective<br />
complex across Wisconsin. The convection to <strong>the</strong> north also<br />
translated eastward but remained north <strong>of</strong> a developing<br />
surface low without any fur<strong>the</strong>r severe wea<strong>the</strong>r.<br />
Also at 1800 UTC and far<strong>the</strong>r to <strong>the</strong> sou<strong>the</strong>ast, an area<br />
<strong>of</strong> subsynoptic low pressure had formed over nor<strong>the</strong>astern<br />
Iowa along <strong>the</strong> stationary front (Fig. 4a). This low may have<br />
been a surface reflection <strong>of</strong> a low amplitude shortwave<br />
trough at 500 mb (Fig. 3b). The resultant pressure gradient<br />
allowed southwest winds to prevail along and south <strong>of</strong><br />
<strong>the</strong> stationary front while lighter winds and high-based<br />
scattered showers and isolated thunderstorms existed<br />
north <strong>of</strong> <strong>the</strong> front over sou<strong>the</strong>rn Wisconsin (Fig. 5a). This<br />
acted to maintain weak frontogenesis (Fig. 6) and surface<br />
moisture flux convergence (not shown) along and north<br />
<strong>of</strong> <strong>the</strong> stationary front.<br />
By 2100 UTC, a closed surface low had developed<br />
near Minneapolis (Fig. 4b). The isallobaric couplet shifted<br />
sou<strong>the</strong>astward into most <strong>of</strong> Minnesota and <strong>the</strong> low had<br />
deepened 3.5 mb since 1800 UTC. The warm front and<br />
trailing surface trough had surged eastward and extended<br />
south-sou<strong>the</strong>ast <strong>of</strong> <strong>the</strong> low. The surface analysis and<br />
2115 UTC visible satellite image (Fig. 5b) showed a band<br />
<strong>of</strong> towering cumulus with WSR-88Ds detecting scattered<br />
showers (not shown) along <strong>the</strong> surface trough. Surface<br />
dewpoints were mainly in <strong>the</strong> 40s (°F) along and west<br />
<strong>of</strong> <strong>the</strong> warm front and surface trough over Minnesota.<br />
The minimal surface moisture (very low MLCAPE) and<br />
Fig. 5(b). 2115 UTC.<br />
Fig. 5(c). 0015 UTC.<br />
126 <strong>National</strong> Wea<strong>the</strong>r Digest
Wisconsin Tornado Outbreak<br />
Over central Wisconsin, south winds had developed<br />
in response to <strong>the</strong> isallobaric couplet. Low-level moisture<br />
began to advect northward into central Wisconsin (Fig.<br />
7b) and dewpoints increased 3-7 (°F) between 1200 UTC<br />
and 1800 UTC (Fig. 4b). The surface-based CAPE at 2200<br />
UTC was from 500 to 1000 J kg -1 to <strong>the</strong> east-sou<strong>the</strong>ast <strong>of</strong><br />
<strong>the</strong> surface low (Fig. 8). But over sou<strong>the</strong>rn Wisconsin, less<br />
cloud cover and <strong>the</strong>refore strong insolation had resulted in<br />
surface-based CAPE from 1500 to 2000 J kg -1 . Convergence<br />
along a lake breeze front (Fig. 5b) and along a southwest-tonor<strong>the</strong>ast<br />
oriented surface trough (Fig. 4b) initiated surfacebased<br />
convection in far sou<strong>the</strong>astern Wisconsin around<br />
2100 UTC (Fig. 5b). New convection developed south along<br />
<strong>the</strong> surface trough through 2200 UTC. The thunderstorms<br />
did become severe in far sou<strong>the</strong>astern Wisconsin for a short<br />
time before moving eastward into Lower Michigan.<br />
Fig. 6. 1800 UTC RUC 1000-850 mb two-dimensional<br />
frontogenesis (K m -1 1e10 s -1 ) analysis. Shading is 10 K m -1<br />
1e10 s -1 or greater.<br />
southward displacement from <strong>the</strong> upper-level dynamics<br />
appeared to be limiting factors for deep, severe convection<br />
across sou<strong>the</strong>rn Minnesota. However, this was not <strong>the</strong><br />
case far<strong>the</strong>r north across east-central Minnesota, near <strong>the</strong><br />
surface low and cold front. A bow echo and o<strong>the</strong>r isolated<br />
convection were evident northwest <strong>of</strong> Minneapolis at<br />
2040 UTC (not shown). The bow echo dissipated shortly<br />
<strong>the</strong>reafter, but new cells developed ahead <strong>of</strong> and along an<br />
associated gust front. Although this severe wea<strong>the</strong>r event<br />
did not qualify as a “northwest flow <strong>outbreak</strong>” (Johns 1982;<br />
average 500 mb flow was not 280 degrees or greater), <strong>the</strong><br />
surface pattern at 2100 UTC (Fig. 4b) and throughout this<br />
event resembled type “Q2” in Johns (1984). Type “Q2”<br />
convection occurs in <strong>the</strong> vicinity <strong>of</strong> <strong>the</strong> surface low and <strong>the</strong><br />
upper levels are defined by a digging shortwave trough.<br />
For this event, severe deep moist convection occurred near<br />
<strong>the</strong> surface low and in <strong>the</strong> vicinity <strong>of</strong> <strong>the</strong> fronts and trough<br />
lines. However, <strong>the</strong> strong 500-mb shortwave trough and<br />
jet streak remained mostly across nor<strong>the</strong>rn Minnesota<br />
and Lake Superior during <strong>the</strong> afternoon and evening.<br />
The surface low through 2100 UTC was on <strong>the</strong> sou<strong>the</strong>rn<br />
periphery <strong>of</strong> Q-vector convergence (not shown) from 700<br />
mb up to 300 mb, implying <strong>the</strong> aforementioned upper<br />
dynamics contributed to <strong>the</strong> deepening <strong>of</strong> <strong>the</strong> surface low.<br />
The northward displacement <strong>of</strong> <strong>the</strong> left exit region, 500 mb<br />
cyclonic vorticity advection, and <strong>the</strong> associated upper level<br />
Q-vector convergence is discussed in more depth later in<br />
this paper.<br />
b. 2100 UTC to 0300 UTC<br />
Between 2100 UTC and 0300 UTC, <strong>the</strong> surface low<br />
and isallobaric couplet progressed from Minneapolis to<br />
Green Bay without any fur<strong>the</strong>r deepening <strong>of</strong> <strong>the</strong> low (Fig.<br />
4b-d). The warm front from Minneapolis to far sou<strong>the</strong>rn<br />
Wisconsin lifted to <strong>the</strong> nor<strong>the</strong>ast, continuing <strong>the</strong> advection<br />
<strong>of</strong> low-level moisture into central Wisconsin. The cold<br />
front translated well into sou<strong>the</strong>rn Wisconsin by 0300 UTC.<br />
Early during this period, new thunderstorms developed<br />
along <strong>the</strong> surface trough over far sou<strong>the</strong>astern Minnesota<br />
as it pushed into a higher CAPE environment (Fig. 8). This<br />
new area <strong>of</strong> thunderstorms and <strong>the</strong> ongoing thunderstorms<br />
near Minneapolis evolved into a severe convective complex<br />
<strong>of</strong> mostly HP supercells and bow echoes as it tracked across<br />
central and sou<strong>the</strong>rn Wisconsin (Fig. 5c). Figure 9 displays<br />
several <strong>of</strong> <strong>the</strong> HP supercells from various WSR-88Ds at 0.5<br />
elevation reflectivity.<br />
The strong deep layer wind shear that was already in place<br />
across <strong>the</strong> Nor<strong>the</strong>rn Plains into northwestern Wisconsin<br />
had expanded eastward over <strong>the</strong> western Great Lakes<br />
by 1800 UTC. The bulk Richardson number (BRN;<br />
Weisman and Klemp 1982) shear was consistently<br />
80 m 2 s -2 or larger throughout this event (Fig. 8). This is<br />
well into <strong>the</strong> range <strong>of</strong> tornadic supercell storms (Thompson<br />
1998; Thompson et al. 2003, hereafter T03). While strong<br />
deep-layer shear was in place throughout this event, <strong>the</strong><br />
low-level wind shear attained an appreciable increase from<br />
<strong>the</strong> late afternoon into <strong>the</strong> evening hours. This was due<br />
to <strong>the</strong> isallobaric couplet and <strong>the</strong> resultant increase in <strong>the</strong><br />
pressure gradient east and south <strong>of</strong> <strong>the</strong> surface low (Fig.<br />
4c). The increase in wind speed is shown by <strong>the</strong> Blue River,<br />
Wisconsin wind pr<strong>of</strong>iler (Fig. 10). The most substantial<br />
increase in wind speed around 15 kts occurred within<br />
<strong>the</strong> 0-2 km layer between 2100 UTC and 0000 UTC. The<br />
following parameters also indicated an increase in low-level<br />
Volume 31 Number 2 ~ December 2007 127
Gehring<br />
wind shear between 2200 UTC and 0100 UTC: surface-1<br />
km shear (Fig 11a-b), 0-3 km storm-relative helicity (SRH;<br />
Davies-Jones et al 1990; Fig. 12a-b), and 0-1 km SRH (Fig.<br />
12c-d). Surface-1 km shear increased sharply from less<br />
than 10 kt to 15 to 25 kt by 0100 UTC. Craven et al. (<strong>2004</strong>)<br />
revealed that 0-1 km shear discriminates very well between<br />
significant <strong>tornado</strong>es and o<strong>the</strong>r severe events. Their data<br />
suggested a lower general guideline <strong>of</strong> 10 m s -1 may be used<br />
for significant <strong>tornado</strong>es.<br />
The 0-3 km SRH and 0-1 km SRH [using <strong>the</strong> Bunkers et<br />
al. (2000) supercell motion estimate] had maximum values<br />
around 200 m 2 s -2 and 100 m 2 s -2 respectively in <strong>the</strong> vicinity<br />
Fig. 7 (a-d). RUC 1000-850 mb equivalent potential temperature advection (C 12 hr -1 ) analysis and 1000-850 mb<br />
positive and negative Q-vector divergence for (a) 1800 UTC, (b) 2100 UTC, (c) 0000 UTC, and (d) 0300 UTC. Thin solid<br />
and dashed gray lines are <strong>the</strong>ta-e advection with shading for 10 C 12 hr -1 or greater and -10 C 12 hr -1 or less. Solid black<br />
lines are 1000-850 mb positive and negative Q-vector divergence (K m -2 1e16 s -1 ).<br />
128 <strong>National</strong> Wea<strong>the</strong>r Digest
Wisconsin Tornado Outbreak<br />
Fig. 8. SPC RUC-based BRN shear and surface CAPE valid<br />
2200 UTC <strong>23</strong> June <strong>2004</strong>. CAPE greater than 500 J kg -1 is<br />
shaded.<br />
<strong>of</strong> <strong>the</strong> convective complex over sou<strong>the</strong>astern Minnesota and<br />
far western Wisconsin. Ano<strong>the</strong>r maximum was located over<br />
far sou<strong>the</strong>astern Wisconsin and Lake Michigan where <strong>the</strong><br />
easterly winds from <strong>the</strong> lake breeze resulted in strong lowlevel<br />
wind shear. The axis <strong>of</strong> higher SRH did extend to <strong>the</strong><br />
west along <strong>the</strong> warm front over nor<strong>the</strong>rn Illinois as well.<br />
By 0100 UTC, <strong>the</strong> SRH values had increased (0-3 km SRH<br />
around 250 m 2 s -2 and 0-1 km SRH <strong>of</strong> 150-200 m 2 s -2 ) over<br />
much <strong>of</strong> central and sou<strong>the</strong>rn Wisconsin with <strong>the</strong> axis <strong>of</strong><br />
highest SRH along <strong>the</strong> warm front. T03 showed that <strong>the</strong> 0-1<br />
km helicity using <strong>the</strong> Bunkers et al. (2000) supercell motion<br />
estimate was statistically different between significantly<br />
tornadic supercells and nontornadic supercells. The large<br />
0-1 km SRH in this case study is near <strong>the</strong> 50 th percentile<br />
for significant <strong>tornado</strong>es in T03. The SRH values based on<br />
observed storm motion are discussed later in this section.<br />
The increase in low-level wind speed resulted in<br />
<strong>the</strong> nor<strong>the</strong>astward movement <strong>of</strong> <strong>the</strong> warm front and its<br />
associated <strong>the</strong>ta-e advection, with a large area <strong>of</strong> 1000-850<br />
mb Q-vector convergence within <strong>the</strong> warm-air advection<br />
ahead <strong>of</strong> <strong>the</strong> low and cold front (Fig. 7b-d). The <strong>the</strong>ta-e<br />
advection had resulted in a slight increase in MLCAPE (not<br />
shown) over central Wisconsin from 2200 UTC to 0100<br />
UTC, despite <strong>the</strong> approach <strong>of</strong> sunset.<br />
The 0000 UTC upper-air maps show <strong>the</strong> left exit<br />
region <strong>of</strong> a 300 mb jet streak and associated Q-vector<br />
convergence (Fig. 13a) remaining just north <strong>of</strong> <strong>the</strong> surface<br />
low, while appreciable 500 mb cyclonic vorticity advection<br />
and Q-vector convergence (Fig. 13b) is over southwestern<br />
Ontario and western Lake Superior, and also north <strong>of</strong> <strong>the</strong><br />
surface low over west-central Wisconsin. When compared<br />
to <strong>the</strong> 1200 UTC maps (Fig. 3a-d), more <strong>of</strong> a displacement<br />
has occurred between <strong>the</strong> upper level Q-vector convergence<br />
and <strong>the</strong> surface low and cold front. This would explain<br />
why no fur<strong>the</strong>r deepening <strong>of</strong> <strong>the</strong> low occurred after 2100<br />
UTC (<strong>the</strong> low actually filled by 0.8 mb between 2100 UTC<br />
and 0300 UTC). Maddox and Doswell (1982) emphasized<br />
<strong>the</strong> importance <strong>of</strong> lower-tropospheric warm-air advection<br />
to convective events, especially in <strong>the</strong> less than “classic”<br />
synoptic scale settings. Overall this event was characterized<br />
by lower tropospheric warm-air advection, <strong>the</strong>ta-e<br />
advection, and 1000-850 mb Q-vector convergence playing<br />
a key role in propagating <strong>the</strong> pressure falls and surface low<br />
eastward, and supplying moisture, instability, and synopticscale<br />
lift to <strong>the</strong> ongoing convection. The frontogenesis along<br />
<strong>the</strong> cold front and <strong>the</strong> supercell structures and gust fronts<br />
<strong>the</strong>mselves provided <strong>the</strong> mesoscale and storm-scale lift to<br />
support continuing severe convection.<br />
c. Gridpoint soundings<br />
Proximity gridpoint soundings from <strong>the</strong> RUC were used<br />
to sample <strong>the</strong> near storm environment associated with <strong>the</strong><br />
tornadic supercells. The soundings were generated for<br />
0000, 0001, and 0200 UTC 24 June <strong>2004</strong>. This coincided<br />
with <strong>the</strong> times that tornadic supercells approached and<br />
moved to a distance <strong>of</strong> 5 to 39 km from an ASOS or AWOS<br />
site (Table 1 and Fig. 2).<br />
RUC proximity gridpoint soundings were generated at<br />
each <strong>of</strong> <strong>the</strong> six surface observation sites. The surface data<br />
in <strong>the</strong> model soundings were modified with <strong>the</strong> observed<br />
surface data (i.e., temperature, dewpoint, and wind) from<br />
<strong>the</strong> ASOS and AWOS sites. The time <strong>of</strong> surface observations<br />
coincided with <strong>the</strong> time <strong>of</strong> <strong>the</strong> generated proximity soundings<br />
with one exception – Sparta, Wisconsin (KCMY). Cool air<br />
from <strong>the</strong> outflow associated with an isolated cell modified<br />
<strong>the</strong> observation taken at <strong>the</strong> time <strong>of</strong> <strong>the</strong> sounding (0000<br />
UTC 24 June). Therefore, <strong>the</strong> <strong>23</strong>00 UTC <strong>23</strong> June surface<br />
observation was used to modify <strong>the</strong> model sounding since<br />
it was more representative <strong>of</strong> <strong>the</strong> near storm environment.<br />
Of interest, <strong>the</strong> isolated cell and its cool outflow did<br />
remain east and south <strong>of</strong> <strong>the</strong> tornadic supercell’s path<br />
located nor<strong>the</strong>ast <strong>of</strong> KCMY. Finally, <strong>the</strong> ST1.5 was used for<br />
<strong>the</strong>rmodynamic calculations while RUC sounding wind data<br />
were transferred to a locally developed program [available<br />
on line from <strong>the</strong> NOAA/<strong>National</strong> Wea<strong>the</strong>r Service Wea<strong>the</strong>r<br />
Forecast Office (WFO) Rapid City, SD, Web site at www.<br />
crh.noaa.gov/unr/?n=scm for calculations involving wind<br />
shear. Table 1 lists <strong>the</strong> severe wea<strong>the</strong>r parameters for each<br />
site. In following detail, <strong>the</strong> results <strong>of</strong> Table 1 are explored.<br />
The MLBRN ranged from 2 to 12 which are partially in<br />
<strong>the</strong> supercell range <strong>of</strong> 10 to 40 determined by Weisman and<br />
Klemp (1982, 1984) through <strong>the</strong> use <strong>of</strong> a three-dimensional<br />
Volume 31 Number 2 ~ December 2007 129
Gehring<br />
Fig. 9(a-d). 0.5 Reflectivity from various WSR-88Ds over Wisconsin showing HP supercells.<br />
(a) Two conjoined HP supercells 92 km north <strong>of</strong> La Crosse<br />
(ARX) WSR-88D.<br />
(b) Two tornadic HP supercells with comma head features<br />
97 km west <strong>of</strong> Green Bay (GRB) WSR-88D.<br />
(c) Tornadic spiral-banded HP supercell 72 km north <strong>of</strong><br />
Sullivan (MKX) WSR-88D.<br />
(d) Tornadic HP supercell with large RFD/hook echo 18<br />
km southwest <strong>of</strong> Sullivan (MKX) WSR-88D.<br />
130 <strong>National</strong> Wea<strong>the</strong>r Digest
Wisconsin Tornado Outbreak<br />
cloud model. However, Johns et al. (1993) examined 242<br />
proximity soundings <strong>of</strong> F2 and greater <strong>tornado</strong>es and<br />
revealed that 47% occurred with BRNs less than 8 and<br />
nearly 79% less than 20. Riley and Colquhoun (1990) found<br />
that nearly 50% <strong>of</strong> <strong>the</strong>ir cases had BRN less than 21 for all<br />
ranges <strong>of</strong> <strong>the</strong> F-scale. Johns et al. (1993) noted that <strong>the</strong><br />
majority <strong>of</strong> <strong>the</strong>ir tornadic supercells were associated with<br />
“complex multicellular convective structures”, such as bow<br />
echoes, lines, clusters, and spiral bands. Moller et al. (1990,<br />
1994) and Doswell et al. (1990) recognized many <strong>of</strong> <strong>the</strong>se<br />
storms as HP supercells, with common characteristics <strong>of</strong> (1)<br />
rotation, (2) a “distinctive” (Forbes 1981) appearance on<br />
reflectivity despite being surrounded by o<strong>the</strong>r convection,<br />
and (3) containing a large amount <strong>of</strong> precipitation in <strong>the</strong><br />
mesocyclone. Since HP supercells produced <strong>the</strong> majority<br />
<strong>of</strong> severe wea<strong>the</strong>r and <strong>tornado</strong>es on <strong>23</strong> June <strong>2004</strong>, fur<strong>the</strong>r<br />
discussion is warranted.<br />
More recent research on supercell type (Rasmussen and<br />
Straka 1998) focused on storm-relative (SR) upper flow.<br />
Rasmussen and Straka (1998) found SR upper flow greater<br />
than 30 m s -1 supported low precipitation (LP) supercells<br />
while SR flow <strong>of</strong> less than 12 m s -1 supported HP supercells.<br />
SR upper flow from 12-30 m s -1 and 0-3 km SRH less than<br />
250 m 2 s -2 supported LP supercells while <strong>the</strong> same SR upper<br />
flow and 0-3 km SRH greater than 250 m 2 s -2 trended toward<br />
HP supercells. However, it was stressed that storm mergers<br />
and seeding from o<strong>the</strong>r storms may lead to HP supercells<br />
Fig. 10. Blue River, WI pr<strong>of</strong>iler data. Note increase in 0-2<br />
km winds (kt) from 2100 UTC to 0000 UTC.<br />
and that this process may dominate over SR upper flow.<br />
On <strong>23</strong> June <strong>2004</strong> <strong>the</strong>re were at least a half-dozen<br />
tornadic HP supercells that were embedded, surrounded, or<br />
merged with o<strong>the</strong>r convective cells very similar to <strong>the</strong> cases<br />
discussed by Johns et al. (1993) that had low BRN. The HP<br />
supercell type in this event was most likely a result from<br />
seeding due to <strong>the</strong> close spacing <strong>of</strong> <strong>the</strong> storms (Fig. 5c). The<br />
long-track HP supercell that produced six <strong>tornado</strong>es had 10<br />
km SR flow <strong>of</strong> 20 m s -1 and 0-3 km SRH <strong>of</strong> 260 m 2 s -2 (Fig. 14).<br />
This matches <strong>the</strong> SR upper flow and SRH that Rasmussen and<br />
Straka (1998) found for HP supercells. However, <strong>the</strong> long<br />
RUC<br />
sounding<br />
0100 UTC<br />
DLL<br />
0100 UTC<br />
MSN<br />
0100 UTC<br />
FLD<br />
0000 UTC<br />
CMY<br />
0000 UTC<br />
STE<br />
0200 UTC<br />
GRB<br />
Storm Motion 280° at 38 kt 284° at 40 kt 285° at 44 kt 282° at 45 kt 270° at 42 kt 280° at 36 kt<br />
Location and<br />
time <strong>of</strong> <strong>tornado</strong><br />
w.r.t. RUC<br />
sounding<br />
39 km north at<br />
0045 UTC<br />
40 km<br />
nor<strong>the</strong>ast at<br />
0100 UTC<br />
12 km<br />
northwest<br />
at 0135 UTC<br />
32 km<br />
southwest<br />
at 0145 UTC<br />
24 km<br />
nor<strong>the</strong>ast<br />
at <strong>23</strong>59 UTC<br />
35 km<br />
sou<strong>the</strong>ast<br />
at 0050 UTC<br />
5 km north<br />
at 0227 UTC<br />
MLBRN 11 12 7 5 2 5<br />
0-1 km Shear 8 m s -1 10 m s -1 11 m s -1 9 m s -1 7 m s -1 6 m s -1<br />
MLLCL .926 km .985 km .834 km .995 km 1.206 km .911 km<br />
MLCAPE 1274 J kg -1 1350 J kg -1 903 J kg -1 730 J kg -1 303 J kg -1 591 J kg -1<br />
0-3 km CAPE 121 J kg -1 118 J kg -1 108 J kg -1 87 J kg -1 94 J kg -1 103 J kg -1<br />
MLLFC 1.301 km 1.285 km 1.246 km 1.402 km 1.403 km 1.452 km<br />
MLCIN<br />
21 J kg -1 15 J kg -1 22 J kg -1 30 J kg -1 14 J kg -1 36 J kg -1<br />
(negative)<br />
0-3 km SRH 162 m 2 s -2 204 m 2 s -2 260 m 2 s -2 174 m 2 s -2 67 m 2 s -2 147 m 2 s -2<br />
0-1 km SRH 106 m 2 s -2 148 m 2 s -2 175 m 2 s -2 97 m 2 s -2 82 m 2 s -2 83 m 2 s -2<br />
Table 1. RUC Analysis Proximity Soundings and Severe Wea<strong>the</strong>r Parameters<br />
Volume 31 Number 2 ~ December 2007 131
Gehring<br />
Fig. 11(a-b). SPC RUC-based Surface-1 km shear vector valid (a) 2200 UTC and (b) 0100 UTC.<br />
track supercell intensified and clearly became an HP when<br />
a line <strong>of</strong> thunderstorms merged with it from <strong>the</strong> west. This<br />
HP supercell (Fig. 9c) produced 6 <strong>tornado</strong>es including two<br />
F3-rated <strong>tornado</strong>es and one F2-rated <strong>tornado</strong>. The F3-rated<br />
<strong>tornado</strong>es occurred approximately 45 minutes after and 32<br />
km southwest <strong>of</strong> <strong>the</strong> Fond du Lac, Wisconsin (KFLD) 0100<br />
UTC RUC sounding (Fig. 14). The supercell lasted 3 hours<br />
and exhibited a large and strong persistent mesocyclone<br />
with a comma-head and spiral-banded reflectivity structure<br />
for <strong>the</strong> last two hours <strong>of</strong> its life cycle. O<strong>the</strong>r HP supercells<br />
evolved into small-scale bow echoes with <strong>tornado</strong>genesis<br />
occurring within <strong>the</strong> comma-head (Przybylinski 1995).<br />
One F0 <strong>tornado</strong> also developed along <strong>the</strong> leading edge <strong>of</strong><br />
a bow structure south <strong>of</strong> <strong>the</strong> comma-head. This long-track<br />
HP supercell and <strong>the</strong> convective complex in general tracked<br />
east to sou<strong>the</strong>ast (~ 44 kt) along and ahead <strong>of</strong> <strong>the</strong> cold<br />
front but parallel to <strong>the</strong> slow northward moving warm front<br />
throughout <strong>the</strong> early evening (Fig. 4c-d).<br />
The tornadic supercells traveling near <strong>the</strong> warm front<br />
are noteworthy since Markowski et al. (1998a) found that<br />
70% <strong>of</strong> <strong>tornado</strong>es in <strong>the</strong> Verification <strong>of</strong> <strong>the</strong> Origin <strong>of</strong> Rotation<br />
in Tornadoes Experiment (VORTEX-95) were near or within<br />
boundaries, usually from 10 km on <strong>the</strong> warm side to 30 km<br />
on <strong>the</strong> cool side. The process <strong>of</strong> tilting and stretching <strong>of</strong><br />
horizontal vorticity associated with a boundary was believed<br />
to support low-level mesocyclogenesis. The <strong>tornado</strong><br />
<strong>outbreak</strong> in this case study did fit <strong>the</strong> aforementioned<br />
research with tornadic HP supercells near a warm front<br />
that were surrounded, embedded, or merged with o<strong>the</strong>r<br />
convective cells, within a low BRN environment. The HP<br />
supercells also followed <strong>the</strong> two composite life cycles <strong>of</strong> HP<br />
supercells presented by Moller et al. (1990) in which a HP<br />
supercell transitions into a bow echo with a rotating comma<br />
head while <strong>the</strong> o<strong>the</strong>r becomes a cyclic HP supercell without<br />
transition into a bow echo.<br />
The following severe wea<strong>the</strong>r parameters were also<br />
supportive <strong>of</strong> tornadic supercells.<br />
The 0-1 km shear values in Table 1 hovered near <strong>the</strong> 25 th<br />
percentile (lower rough threshold <strong>of</strong> 10 m s -1 and 8 m s -1 )<br />
in <strong>the</strong> significant <strong>tornado</strong> category in Craven et al. (<strong>2004</strong>)<br />
and T03 respectively. The ML lifting condensation level<br />
(MLLCL) in Table 1 fell mostly within <strong>the</strong> 25 th to 75 th<br />
percentile (low LCLs) for <strong>the</strong> significant <strong>tornado</strong> category <strong>of</strong><br />
all three proximity sounding studies by Craven et al. (<strong>2004</strong>),<br />
Rasmussen and Blanchard (1998), and T03. LCLs are<br />
apparently critical to <strong>tornado</strong>genesis since Markowski et<br />
al. (2002) observed warm, moist (low dewpoint depression<br />
air, thus low LCLs) RFD air containing some CAPE within<br />
tornadic storms versus nontornadic storms characterized<br />
by larger dewpoint depressions, and thus higher LCLs.<br />
The 0-3 km CAPE values in Table 1 were large and fell<br />
mostly above <strong>the</strong> 75 th percentile in <strong>the</strong> strong tornadic<br />
category in Rasmussen (2003). The ML level <strong>of</strong> free<br />
convection (MLLFC) values in Table 1 were near <strong>the</strong> 50 th<br />
percentile (low LFC) in <strong>the</strong> strong tornadic category in<br />
Davies (<strong>2004</strong>) while <strong>the</strong> ML convective inhibition (MLCIN)<br />
values were within <strong>the</strong> 25 th to 75 th percentile. Values <strong>of</strong> large<br />
0-3 km CAPE, low MLLFC, and low MLCIN on <strong>23</strong> June <strong>2004</strong><br />
supported an environment <strong>of</strong> low-level parcel ascent and<br />
stretching that may have fostered a favorable environment<br />
for <strong>tornado</strong>genesis (Davies <strong>2004</strong>; Rasmussen 2003).<br />
The 0-3 km SRH in Table 1 fell between <strong>the</strong> 25 th and<br />
75 th percentiles in <strong>the</strong> significant <strong>tornado</strong> category for<br />
Rasmussen and Blanchard (1998), while Sparta (KCMY),<br />
132 <strong>National</strong> Wea<strong>the</strong>r Digest
Wisconsin Tornado Outbreak<br />
Fig. 12(a-d). SPC RUC-based 0-3 km SRH (a,b) and 0-1 km SRH (c,d) valid 2200 UTC and 0100 UTC respectively. SRH<br />
calculated using <strong>the</strong> Bunkers et al. (2000) supercell storm motion estimate.<br />
Madison (KMSN), and Fond du Lac, Wisconsin (KFLD) fell<br />
within <strong>the</strong> middle 50 th percentile <strong>of</strong> T03. However, based<br />
on a large amount <strong>of</strong> overlap with o<strong>the</strong>r categories, 0-3 km<br />
SRH is best used as a supercell predictor (relative to <strong>the</strong><br />
0-1 km SRH). The 0-1 km SRH/wind shear was found by<br />
Markowski et al. (1998b) and Markowski et al. (2003) to be<br />
a strong indicator <strong>of</strong> significant tornadic supercells. Using<br />
over six thousand 0000 UTC soundings, Markowski et al.<br />
(1998b) found <strong>the</strong> 0-1 km SRH values for significant tornadic<br />
supercells averaged nearly 100 m 2 s -2 and accounted for<br />
nearly 53% <strong>of</strong> <strong>the</strong> SRH in <strong>the</strong> 0-3 km layer. Table 1 shows<br />
<strong>the</strong> 0-1 km SRH values ranged from 82 m 2 s -2 to 175 m 2 s -2 ,<br />
and accounted for approximately 56-73% <strong>of</strong> <strong>the</strong> total 0-3<br />
km SRH. In fact, <strong>the</strong> 0-1 km SRH was larger than <strong>the</strong> 0-3 km<br />
SRH at KSTE. The 0-1 km SRH fell within <strong>the</strong> 25 th and 75 th<br />
percentiles in Rasmussen (2003) while Baraboo (KDLL),<br />
Madison (KMSN) and Fond du Lac, Wisconsin (KFLD) fell<br />
within <strong>the</strong> middle 50 th percentile <strong>of</strong> T03.<br />
Volume 31 Number 2 ~ December 2007 133
Gehring<br />
Fig. 13(a). Same as Fig. 3a except for 0000 UTC 24 June<br />
<strong>2004</strong>.<br />
Overall, <strong>the</strong> severe wea<strong>the</strong>r parameters from RUC<br />
proximity analysis soundings in Table 1 were supportive<br />
<strong>of</strong> tornadic supercells on <strong>23</strong> June <strong>2004</strong>. The sounding for<br />
Stevens Point, Wisconsin (KSTE) was marginal for tornadic<br />
supercells, although <strong>the</strong>re were two nearby weak <strong>tornado</strong>es<br />
and an F2 <strong>tornado</strong> (HP with comma-head structure) 35 km<br />
to <strong>the</strong> sou<strong>the</strong>ast. The 0-3 km SRH value was low primarily<br />
because <strong>the</strong> storm motion (Table 1) was 270°, <strong>the</strong>reby<br />
plotted much closer to <strong>the</strong> hodograph, but <strong>the</strong> 0-1 km SRH<br />
value <strong>of</strong> 82 m 2 s -2 was respectable. The KFLD and KDLL<br />
proximity soundings were taken to represent <strong>the</strong> long-track<br />
HP supercell that was responsible for six <strong>tornado</strong>es (three<br />
<strong>of</strong> which were strong). The strong <strong>tornado</strong>es occurred<br />
closest to KFLD and <strong>the</strong> sounding revealed <strong>the</strong> lowest<br />
MLLCL and MLLFC and <strong>the</strong> highest low level wind shear<br />
(SRH and 0-1 km shear) compared to <strong>the</strong> remainder <strong>of</strong> <strong>the</strong><br />
proximity soundings. Figure 14 is <strong>the</strong> hodograph for KFLD<br />
with observed storm motion plotted. The parameters for<br />
this particular HP supercell were in solid agreement with<br />
<strong>the</strong> strong tornadic supercell distributions <strong>of</strong> <strong>the</strong> various<br />
referenced authors in this paper. The 4-6 km SR flow <strong>of</strong> 24<br />
kt and <strong>the</strong> 10 km SR flow <strong>of</strong> 39 kt were <strong>the</strong> median values<br />
in <strong>the</strong> strong <strong>tornado</strong> category for T03 and Rasmussen and<br />
Blanchard (1998) respectively.<br />
4. Forecast Challenges<br />
The NWS morning area forecast discussions and SPC<br />
outlooks for <strong>the</strong> morning <strong>of</strong> <strong>23</strong> June <strong>2004</strong> focused on <strong>the</strong><br />
Fig. 13(b). Same as Fig. 3b except for 0000 UTC 24 June<br />
slow-moving cold front over Wisconsin (Fig. 3d). Convective<br />
initiation, aided by a weak shortwave trough, and possible<br />
severe wea<strong>the</strong>r (“slight risk” issued by SPC) were expected<br />
in <strong>the</strong> vicinity <strong>of</strong> <strong>the</strong> front by afternoon from Lower Michigan<br />
through central and sou<strong>the</strong>rn Wisconsin into eastern Iowa.<br />
The discussions and outlooks identified a sufficient amount<br />
<strong>of</strong> moisture, CAPE, lift, and wind shear for damaging winds,<br />
large hail, and isolated <strong>tornado</strong>es. The Nor<strong>the</strong>rn Plains<br />
system was treated separately and with a slower forecast<br />
progression than what was observed.<br />
The afternoon area forecast discussions and SPC<br />
outlooks continued to keep <strong>the</strong> two systems separate. The<br />
lack <strong>of</strong> moisture and CAPE across Wisconsin in <strong>the</strong> early<br />
afternoon, and <strong>the</strong> expected northward displacement <strong>of</strong> <strong>the</strong><br />
most focused upper-level dynamics (Fig. 13a-b) contributed<br />
to lower confidence <strong>of</strong> severe convective potential among<br />
<strong>the</strong> local NWS forecast <strong>of</strong>fices. The area forecast discussions<br />
mentioned little <strong>of</strong> <strong>the</strong> weak but developing surface low and<br />
isallobaric couplet that was occurring over Minnesota at<br />
<strong>the</strong> time. The slight risk was continued by <strong>the</strong> SPC and <strong>the</strong>n<br />
upgraded to moderate risk by 0036 UTC 24 June <strong>2004</strong>.<br />
The 1200 UTC <strong>23</strong> June <strong>2004</strong> Eta forecasted a reasonably<br />
well depiction <strong>of</strong> <strong>the</strong> event. The surface low and northward<br />
moving warm front were resolved by <strong>the</strong> model, but<br />
were slightly slower with <strong>the</strong> progression compared to<br />
<strong>the</strong> observed surface maps. The 1200 UTC Eta correctly<br />
forecasted 0-3 km SRH above 200 m 2 s -2 and accurately placed<br />
<strong>the</strong> north to south CAPE gradient over central and sou<strong>the</strong>rn<br />
Wisconsin. The previous run from 0000 UTC <strong>23</strong> June <strong>2004</strong><br />
134 <strong>National</strong> Wea<strong>the</strong>r Digest
Wisconsin Tornado Outbreak<br />
Eta was far<strong>the</strong>r north than <strong>the</strong> 1200 UTC run<br />
and positioned <strong>the</strong> morning cold front to <strong>the</strong><br />
east and south by late afternoon and evening.<br />
With no indication <strong>of</strong> <strong>the</strong> cold front possibly<br />
reversing and moving to <strong>the</strong> north as a warm<br />
front, <strong>the</strong> warm-air advection and 0-3 km SRH<br />
were consequently weaker. This case clearly<br />
was not “synoptically evident” (Doswell et<br />
al. 1993) on <strong>the</strong> Eta or <strong>the</strong> current analyses<br />
throughout <strong>the</strong> day due to <strong>the</strong> weak surface<br />
low, strong upper-level dynamics (Fig. 13a-b)<br />
north <strong>of</strong> <strong>the</strong> <strong>outbreak</strong> area and marginal<br />
CAPE over central Wisconsin. In addition, <strong>the</strong><br />
incorrect depiction <strong>of</strong> <strong>the</strong> event by <strong>the</strong> 0000<br />
UTC <strong>23</strong> June <strong>2004</strong> Eta model led to difficulty in<br />
determining how significant and widespread<br />
<strong>the</strong> severe wea<strong>the</strong>r would be.<br />
5. Summary and Conclusions<br />
On <strong>23</strong> June <strong>2004</strong>, Wisconsin’s fifth largest<br />
<strong>tornado</strong> <strong>outbreak</strong> occurred during <strong>the</strong> late<br />
afternoon and early evening hours. The<br />
parent deep moist convection was comprised<br />
<strong>of</strong> complex storm structures, bow echoes, and<br />
HP supercells. The event was characterized by<br />
a fast propagating isallobaric couplet and surface low with a<br />
100 kt 300-mb jet streak, and a pre-existing front that lifted<br />
northward as a warm front. Low-level tropospheric warmair<br />
advection, positive <strong>the</strong>ta-e advection, frontogenesis, and<br />
convergence along <strong>the</strong> fronts and surface troughs appeared<br />
to be <strong>the</strong> catalyst for synoptic scale and mesoscale lift. In<br />
addition, an increase in low-level wind shear late in <strong>the</strong><br />
day was a key ingredient in <strong>the</strong> development <strong>of</strong> tornadic<br />
supercells. The RUC proximity soundings were characterized<br />
by low BRN, low MLLCL, low MLLFC, low MLCIN, high 0-3<br />
km CAPE, high SRH, and high 0-1 km shear. The values <strong>of</strong><br />
<strong>the</strong>se parameters, were favorable for tornadic supercells by<br />
late afternoon and evening.<br />
This study suggests factors that can assist forecasters<br />
in anticipating high impact severe wea<strong>the</strong>r events when<br />
<strong>the</strong> numerical model predictions suggest o<strong>the</strong>rwise. These<br />
factors include a severe wea<strong>the</strong>r conceptual knowledge<br />
base, a diligent “wea<strong>the</strong>r watch”, and <strong>the</strong> utilization <strong>of</strong><br />
progressive tools (e.g., mesoscale models) that add value<br />
beyond well established forecast practices.<br />
Conceptual thinking based upon empirical forecast<br />
experience, informal case studies, and findings from<br />
published research provides <strong>the</strong> foundation from which<br />
forecasters can <strong>the</strong>n employ a diligent “wea<strong>the</strong>r watch” in a<br />
skilled and efficient manner. Knowing what to look for and<br />
<strong>the</strong> implications <strong>of</strong> what is found on all scales (i.e., synoptic,<br />
Fig. 14. 0100 UTC KFLD hodograph with observed storm motion.<br />
Hodograph in m s -1 .<br />
meso, and storm) should present better opportunities to<br />
more accurately and in a more timely fashion anticipate<br />
convection initiation, <strong>the</strong> predominant convective mode,<br />
significant changes to <strong>the</strong> convective mode and <strong>the</strong> resulting<br />
wea<strong>the</strong>r impacts. Finally, high resolution mesoscale models<br />
configured to address critical forecast issues provide <strong>the</strong><br />
means to evaluate changes to <strong>the</strong> pre-storm and nearstorm<br />
environments both in real-time or as a valuable postanalysis<br />
research tool.<br />
Author<br />
Mark Gehring is a Journeyman Forecaster with <strong>the</strong> <strong>National</strong><br />
Wea<strong>the</strong>r Service Wea<strong>the</strong>r Forecast Office (WFO) in Sullivan,<br />
Wisconsin. He also has worked as a Meteorologist Intern at<br />
<strong>the</strong> Elko, Nevada WFO <strong>of</strong>fice before coming to <strong>the</strong> Sullivan<br />
<strong>of</strong>fice in 2000. He earned his B.S. in Geosciences from <strong>the</strong><br />
University <strong>of</strong> Wisconsin-Milwaukee in 1997 and earned<br />
his M.S. in Geosciences from <strong>the</strong> University <strong>of</strong> Wisconsin-<br />
Milwaukee in 1999. His meteorological interests include<br />
severe convection, fire wea<strong>the</strong>r, and flash flooding. He can<br />
be contacted at Mark Gehring, <strong>National</strong> Wea<strong>the</strong>r Service,<br />
N3533 Hardscrabble Road, Dousman, WI 53118; E-mail:<br />
Mark.G.Gehring@noaa.gov.<br />
Volume 31 Number 2 ~ December 2007 135
Gehring<br />
Acknowledgments<br />
The author would like to thank Bill Borgh<strong>of</strong>f for his time and effort in drafting <strong>the</strong> figures for this paper. The<br />
author benefited from discussions with <strong>the</strong> entire staff at NWS Milwaukee/Sullivan, including Bill Borgh<strong>of</strong>f<br />
and Alex Lamers. John Eise and Alex Lamers provided much <strong>of</strong> <strong>the</strong> data used in this manuscript. The author<br />
thanks Mat<strong>the</strong>w Bunkers for providing a locally developed program used for wind shear calculations. Lastly,<br />
<strong>the</strong> author thanks Kim Licitar for his help and expertise in maintaining <strong>the</strong> s<strong>of</strong>tware used in this study.<br />
References<br />
Benjamin, S. G., D. Dévényi, S. S. Weygandt, K. J. Brundage,<br />
J. M. Brown, G. A. Grell, D. Kim, B. E. Schwartz, T. G.<br />
Smirnova, T. L. Smith, and G. S. Manikin, <strong>2004</strong>: An hourly<br />
assimilation–forecast cycle: The RUC. Mon. Wea. Rev.,<br />
132, 495–518.<br />
Bothwell, P.D., J.A. Hart, and R.L. Thompson, 2002: An<br />
integrated three-dimensional objective analysis scheme<br />
in use at <strong>the</strong> Storm Prediction Center. Preprints, 21st<br />
Conference on Severe Local Storms, San Antonio, TX,<br />
Amer. Meteor. Soc., J117-J120.<br />
Bunkers, M.J., and M. Magsig, X. Yu, 2005: Sounding Toolkit<br />
Version 1.5. NWS AWIPS Local Application.<br />
_______, B.A. Klimowski, J.W. Zeitler, R.L. Thompson, and M.L.<br />
Weisman, 2000: Predicting supercell motion using a<br />
new hodograph technique. Wea. Forecasting, 15, 61-79.<br />
Craven, J.P., and Harold E. Brooks, <strong>2004</strong>: Baseline climatology<br />
<strong>of</strong> sounding derived parameters associated with deep,<br />
moist convection. Natl. Wea. Dig., 28, 13-24.<br />
_______, R.E. Jewell, and H.E. Brooks, 2002: Comparison<br />
between observed convective cloud-base heights and<br />
lifting condensation level for two different lifted parcels.<br />
Wea. Forecasting, 17, 885-890.<br />
Davies, J. M., <strong>2004</strong>: Estimations <strong>of</strong> CIN and LFC associated<br />
with tornadic and nontornadic supercells. Wea.<br />
Forecasting, 19, 714-726.<br />
Davies-Jones, R.P., D. Burgess, and M. Foster, 1990: Test <strong>of</strong><br />
helicity as a <strong>tornado</strong> forecast parameter. Preprints, 16th<br />
Conference on Severe Local Storms, Kananaskis Park,<br />
Alberta, Canada, Amer. Meteor. Soc., 588-592.<br />
Doswell, C.A. III, 1987: The distinction between large-scale<br />
and mesoscale contribution to severe convection: A<br />
case study example. Wea. Forecasting, 2, 3-16.<br />
_______, and E.N. Rasmussen, 1994: The effect <strong>of</strong> neglecting<br />
<strong>the</strong> virtual temperature correction on CAPE calculations.<br />
Wea. Forecasting, 9, 625-629.<br />
_______, A.R. Moller, and R. Przybylinski, 1990: A unified set<br />
<strong>of</strong> conceptual models for variations on <strong>the</strong> supercell<br />
<strong>the</strong>me. Preprints, 16th Conference on Severe Local<br />
Storms, Kananaskis Park, Alberta, Canada, Amer. Meteor.<br />
Soc., 40-45.<br />
_______, S.J. Weiss, and R.H. Johns, 1993: Tornado forecasting-<br />
--A review. The Tornado: Its Structure, Dynamics,<br />
Prediction, and Hazaards, Geophys. Monogr., No. 79,<br />
Amer. Geophys. Union, 557-571.<br />
_______, R. Edwards, R.L. Thompson, J.A. Hart, and K.C.<br />
Crosbie, 2006: A simple and flexible method for ranking<br />
severe wea<strong>the</strong>r events. Wea. Forecasting, 21, 939-951.<br />
Forbes, G.S., 1981: On <strong>the</strong> reliability <strong>of</strong> hook echoes as<br />
<strong>tornado</strong> indicators. Mon. Wea. Rev., 109, 1457-1466.<br />
Fujita, T.T., 1971: Proposed characterization <strong>of</strong> <strong>tornado</strong>es<br />
and hurricanes by area and intensity. Satellite and<br />
Mesometeorology Research Paper No. 91, Dept. <strong>of</strong><br />
Geophysical Sciences, University <strong>of</strong> Chicago, 42 pp.<br />
_______, 1978: Manual <strong>of</strong> downburst identification for project<br />
NIMROD. Satellite and Mesometeorology Research<br />
Paper No. 156, Dept. <strong>of</strong> Geophysical Sciences, University<br />
<strong>of</strong> Chicago, 104 pp.<br />
Galway, J.G., 1977: Some climatological aspects <strong>of</strong> <strong>tornado</strong><br />
<strong>outbreak</strong>s. Mon. Wea. Rev., 105, 477-484.<br />
Johns, R.H., 1982: A synoptic climatology <strong>of</strong> northwest<br />
flow severe wea<strong>the</strong>r <strong>outbreak</strong>s. Part I: Nature and<br />
significance. Mon. Wea. Rev., 110, 1653-1663.<br />
136 <strong>National</strong> Wea<strong>the</strong>r Digest
Wisconsin Tornado Outbreak<br />
_______, 1984: A synoptic climatology <strong>of</strong> northwest flow<br />
severe wea<strong>the</strong>r <strong>outbreak</strong>s. Part II: Meteorological<br />
parameters and synoptic patterns. Mon. Wea. Rev., 112,<br />
449-464.<br />
_______, and C. A. Doswell III, 1992: Severe local storms<br />
forecasting. Wea. Forecasting, 7, 588-612.<br />
_______, J.M. Davies, and P.W. Leftwich, 1993: Some wind<br />
and instability parameters associated with strong and<br />
violent <strong>tornado</strong>es. 2. Variations in <strong>the</strong> combinations<br />
<strong>of</strong> wind and instability parameters. The Tornado: Its<br />
Structure, Dynamics, Prediction, and Hazards, Geophys.<br />
Monogr., No. 79, Amer. Geophys. Union, 583-590.<br />
Maddox, R.A., and C.A. Doswell III, 1982: An examination<br />
<strong>of</strong> jet stream configurations, 500 mb vorticity advection<br />
and low-level <strong>the</strong>rmal advection patterns during<br />
extended periods <strong>of</strong> intense convection. Mon. Wea. Rev.,<br />
110, 184-197.<br />
Magsig, M. A., T. Decker, and N. M. Said, 2006: Builds five and<br />
six <strong>of</strong> NOAA’s NWS wea<strong>the</strong>r event simulator. Preprints,<br />
22nd International Conference on Interactive Information<br />
and Processing Systems (IIPS), Atlanta, GA, Amer. Meteor.<br />
Soc., CD-ROM, 7.7.<br />
Markowski, P.M., E.N. Rasmussen, and J.M. Straka, 1998a:<br />
The occurrence <strong>of</strong> <strong>tornado</strong>es in supercells interacting<br />
with boundaries during VORTEX-95. Wea. Forecasting,<br />
13, 852-859.<br />
_______, J.M. Straka, and E.N. Rasmussen, 1998b: A<br />
preliminary investigation <strong>of</strong> <strong>the</strong> importance <strong>of</strong> helicity<br />
‘location’ in <strong>the</strong> hodograph. Preprints, 19th Conference<br />
on Severe Local Storms, Minneapolis, MN, Amer. Meteor.<br />
Soc., <strong>23</strong>0-<strong>23</strong>3.<br />
_______, J.M. Straka, and E.N. Rasmussen, 2002: Direct surface<br />
<strong>the</strong>rmodynamic observations within <strong>the</strong> rear-flank<br />
downdrafts <strong>of</strong> nontornadic and tornadic supercells.<br />
Mon. Wea. Rev., 130, 1692-1721.<br />
_______, C. Hannon, J. Frame, E. Lancaster, A. Pietrycha, R.<br />
Edwards, and R. Thompson, 2003: Characteristics <strong>of</strong><br />
vertical wind pr<strong>of</strong>iles near supercells obtained from <strong>the</strong><br />
Rapid Update Cycle. Wea. Forecasting, 18, 1262-1272.<br />
Moller, A.R., C.A. Doswell III, and R. Przybylinski, 1990:<br />
High precipitation supercells: A conceptual model and<br />
documentation. Preprints, 16th Conference on Severe<br />
Local Storms, Kananaskis Park, Alberta, Canada, Amer.<br />
Meteor. Soc., 52-57.<br />
_______, _______, M.P. Foster, and G.R. Woodall, 1994: The<br />
operational recognition <strong>of</strong> supercell thunderstorm<br />
environments and storm structure. Wea. Forecasting, 9,<br />
327-347.<br />
Przybylinski, R.W., 1995: The bow echo: Observations,<br />
numerical simulations, and severe wea<strong>the</strong>r detection<br />
methods. Wea. Forecasting, 10, 203-217.<br />
Rasmussen, E.N., 2003: Refined supercell and <strong>tornado</strong><br />
forecast parameters. Wea. Forecasting, 18, 530-535.<br />
_______, and D.O. Blanchard, 1998: A baseline climatology<br />
<strong>of</strong> sounding-derived supercell and <strong>tornado</strong> forecast<br />
parameters. Wea. Forecasting, 13, 1148-1164.<br />
_______, and J.M. Straka, 1998: Variations in supercell<br />
morphology. Part I: Observations <strong>of</strong> <strong>the</strong> role <strong>of</strong> upperlevel<br />
storm-relative flow. Mon. Wea. Rev., 126, 2406-<br />
2421.<br />
Riley, P.A., and J.R. Colquhoun, 1990: Thermodynamic and<br />
wind related variables in <strong>the</strong> environment <strong>of</strong> United<br />
States <strong>tornado</strong>es and <strong>the</strong>ir relationship to <strong>tornado</strong><br />
intensity. Preprints, 16th Conference on Severe Local<br />
Storms, Kananaskis Park, Alberta, Canada, Amer. Meteor.<br />
Soc., 599-602.<br />
Thompson, R.L., 1998: Eta Model storm-relative winds<br />
associated with tornadic and nontornadic supercells.<br />
Wea. Forecasting, 13, 125-137.<br />
_______, R. Edwards, J. A. Hart, K. L. Elmore, and P. Markowski,<br />
2003: Close proximity soundings within supercell<br />
environments obtained from <strong>the</strong> Rapid Update Cycle.<br />
Wea. Forecasting, 18, 1243-1261.<br />
Weisman, M.L., and J.B. Klemp, 1982: The dependence <strong>of</strong><br />
numerically simulated convective storms on wind shear<br />
and buoyancy. Mon. Wea. Rev., 110, 504-520.<br />
_______, and _______, 1984: The structure and classification <strong>of</strong><br />
numerically simulated convective storms in directionally<br />
varying wind shears. Mon. Wea. Rev., 112, 2479-2498.<br />
Volume 31 Number 2 ~ December 2007 137