the wisconsin tornado outbreak of 23 june 2004 - National Weather ...
the wisconsin tornado outbreak of 23 june 2004 - National Weather ...
the wisconsin tornado outbreak of 23 june 2004 - National Weather ...

You also want an ePaper? Increase the reach of your titles
YUMPU automatically turns print PDFs into web optimized ePapers that Google loves.
Gehring<br />
wind shear between 2200 UTC and 0100 UTC: surface-1<br />
km shear (Fig 11a-b), 0-3 km storm-relative helicity (SRH;<br />
Davies-Jones et al 1990; Fig. 12a-b), and 0-1 km SRH (Fig.<br />
12c-d). Surface-1 km shear increased sharply from less<br />
than 10 kt to 15 to 25 kt by 0100 UTC. Craven et al. (<strong>2004</strong>)<br />
revealed that 0-1 km shear discriminates very well between<br />
significant <strong>tornado</strong>es and o<strong>the</strong>r severe events. Their data<br />
suggested a lower general guideline <strong>of</strong> 10 m s -1 may be used<br />
for significant <strong>tornado</strong>es.<br />
The 0-3 km SRH and 0-1 km SRH [using <strong>the</strong> Bunkers et<br />
al. (2000) supercell motion estimate] had maximum values<br />
around 200 m 2 s -2 and 100 m 2 s -2 respectively in <strong>the</strong> vicinity<br />
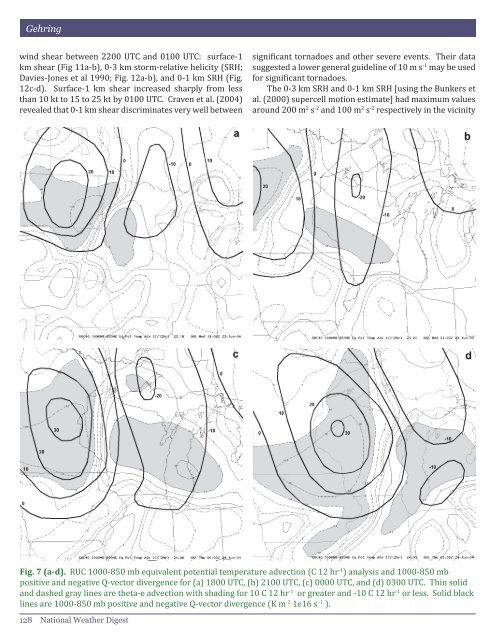
Fig. 7 (a-d). RUC 1000-850 mb equivalent potential temperature advection (C 12 hr -1 ) analysis and 1000-850 mb<br />
positive and negative Q-vector divergence for (a) 1800 UTC, (b) 2100 UTC, (c) 0000 UTC, and (d) 0300 UTC. Thin solid<br />
and dashed gray lines are <strong>the</strong>ta-e advection with shading for 10 C 12 hr -1 or greater and -10 C 12 hr -1 or less. Solid black<br />
lines are 1000-850 mb positive and negative Q-vector divergence (K m -2 1e16 s -1 ).<br />
128 <strong>National</strong> Wea<strong>the</strong>r Digest