the wisconsin tornado outbreak of 23 june 2004 - National Weather ...
the wisconsin tornado outbreak of 23 june 2004 - National Weather ...
the wisconsin tornado outbreak of 23 june 2004 - National Weather ...

You also want an ePaper? Increase the reach of your titles
YUMPU automatically turns print PDFs into web optimized ePapers that Google loves.
Gehring<br />
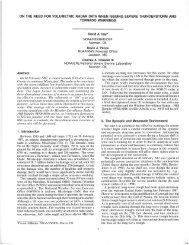
Fig. 3(c). RUC 850 mb analysis valid 1200 UTC <strong>23</strong> June<br />
<strong>2004</strong>. Thick solid lines are geopotential heights every 3<br />
dm. Thin solid lines are temperature every 2°C. Shading<br />
are dewpoints <strong>of</strong> 4°C or greater. RUC wind barbs (kt)<br />
included and RAOB data included with standard station<br />
model format.<br />
Despite very low mean-layer (ML; Craven et al. 2002)<br />
convective available potential energy (MLCAPE) around<br />
100 J kg -1 (not shown) within <strong>the</strong> small warm sector over<br />
far eastern North Dakota and far northwestern Minnesota,<br />
organized convection developed by mid-morning as<br />
<strong>the</strong> Canadian cold front and aforementioned Q-vector<br />
convergence progressed across <strong>the</strong> region. The convection<br />
produced two weak (F0 and F1 on <strong>the</strong> Fujita scale) <strong>tornado</strong>es<br />
(Fig. 1). Boundary layer-6 km shear (not shown) from 50<br />
to 60 kt was prevalent across <strong>the</strong> Nor<strong>the</strong>rn Plains into<br />
northwestern Wisconsin. This strong deep layer shear is<br />
supportive <strong>of</strong> supercell storms (Weisman and Klemp 1982,<br />
1984). Johns et al. (1993) found that tornadic supercells can<br />
occur in environments with very low MLCAPE and strong<br />
shear. The low instability and high wind shear environment<br />
was prevalent throughout this event.<br />
By 1800 UTC, <strong>the</strong> cold front had moved across<br />
northwestern Minnesota and extended west into <strong>the</strong><br />
Dakotas (Fig. 4a). A warm front extended sou<strong>the</strong>astward<br />
across Minnesota into nor<strong>the</strong>rn Illinois where it joined with<br />
a stationary front, previously a cold front, Fig. 3d. A north<br />
to south surface trough had developed in <strong>the</strong> warm sector<br />
over southwestern Minnesota. The earlier convection was<br />
still ongoing along <strong>the</strong> cold front as seen in <strong>the</strong> 1815 UTC<br />
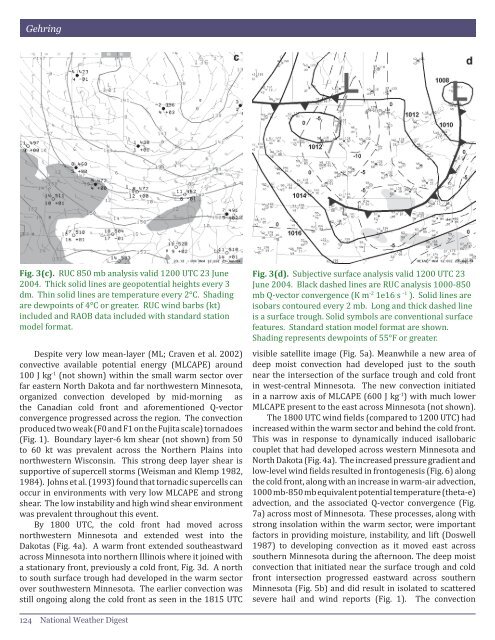
Fig. 3(d). Subjective surface analysis valid 1200 UTC <strong>23</strong><br />
June <strong>2004</strong>. Black dashed lines are RUC analysis 1000-850<br />
mb Q-vector convergence (K m -2 1e16 s -1 ). Solid lines are<br />
isobars contoured every 2 mb. Long and thick dashed line<br />
is a surface trough. Solid symbols are conventional surface<br />
features. Standard station model format are shown.<br />
Shading represents dewpoints <strong>of</strong> 55°F or greater.<br />
visible satellite image (Fig. 5a). Meanwhile a new area <strong>of</strong><br />
deep moist convection had developed just to <strong>the</strong> south<br />
near <strong>the</strong> intersection <strong>of</strong> <strong>the</strong> surface trough and cold front<br />
in west-central Minnesota. The new convection initiated<br />
in a narrow axis <strong>of</strong> MLCAPE (600 J kg -1 ) with much lower<br />
MLCAPE present to <strong>the</strong> east across Minnesota (not shown).<br />
The 1800 UTC wind fields (compared to 1200 UTC) had<br />
increased within <strong>the</strong> warm sector and behind <strong>the</strong> cold front.<br />
This was in response to dynamically induced isallobaric<br />
couplet that had developed across western Minnesota and<br />
North Dakota (Fig. 4a). The increased pressure gradient and<br />
low-level wind fields resulted in frontogenesis (Fig. 6) along<br />
<strong>the</strong> cold front, along with an increase in warm-air advection,<br />
1000 mb-850 mb equivalent potential temperature (<strong>the</strong>ta-e)<br />
advection, and <strong>the</strong> associated Q-vector convergence (Fig.<br />
7a) across most <strong>of</strong> Minnesota. These processes, along with<br />
strong insolation within <strong>the</strong> warm sector, were important<br />
factors in providing moisture, instability, and lift (Doswell<br />
1987) to developing convection as it moved east across<br />
sou<strong>the</strong>rn Minnesota during <strong>the</strong> afternoon. The deep moist<br />
convection that initiated near <strong>the</strong> surface trough and cold<br />
front intersection progressed eastward across sou<strong>the</strong>rn<br />
Minnesota (Fig. 5b) and did result in isolated to scattered<br />
severe hail and wind reports (Fig. 1). The convection<br />
124 <strong>National</strong> Wea<strong>the</strong>r Digest