the wisconsin tornado outbreak of 23 june 2004 - National Weather ...
the wisconsin tornado outbreak of 23 june 2004 - National Weather ...
the wisconsin tornado outbreak of 23 june 2004 - National Weather ...

Create successful ePaper yourself
Turn your PDF publications into a flip-book with our unique Google optimized e-Paper software.
Gehring<br />
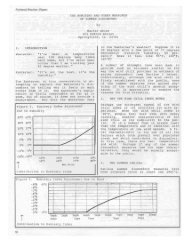
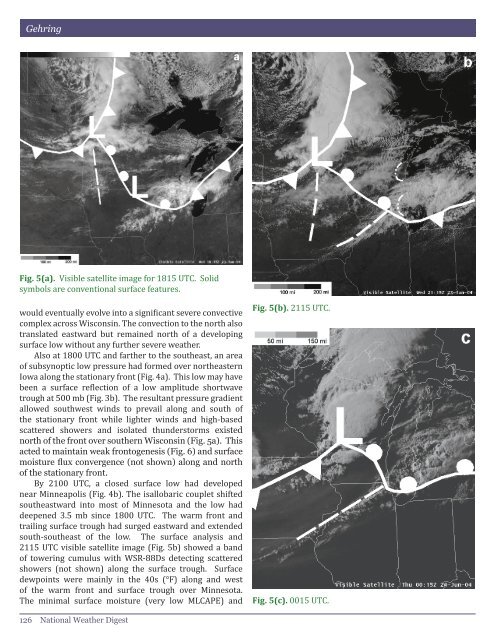
Fig. 5(a). Visible satellite image for 1815 UTC. Solid<br />
symbols are conventional surface features.<br />
would eventually evolve into a significant severe convective<br />
complex across Wisconsin. The convection to <strong>the</strong> north also<br />
translated eastward but remained north <strong>of</strong> a developing<br />
surface low without any fur<strong>the</strong>r severe wea<strong>the</strong>r.<br />
Also at 1800 UTC and far<strong>the</strong>r to <strong>the</strong> sou<strong>the</strong>ast, an area<br />
<strong>of</strong> subsynoptic low pressure had formed over nor<strong>the</strong>astern<br />
Iowa along <strong>the</strong> stationary front (Fig. 4a). This low may have<br />
been a surface reflection <strong>of</strong> a low amplitude shortwave<br />
trough at 500 mb (Fig. 3b). The resultant pressure gradient<br />
allowed southwest winds to prevail along and south <strong>of</strong><br />
<strong>the</strong> stationary front while lighter winds and high-based<br />
scattered showers and isolated thunderstorms existed<br />
north <strong>of</strong> <strong>the</strong> front over sou<strong>the</strong>rn Wisconsin (Fig. 5a). This<br />
acted to maintain weak frontogenesis (Fig. 6) and surface<br />
moisture flux convergence (not shown) along and north<br />
<strong>of</strong> <strong>the</strong> stationary front.<br />
By 2100 UTC, a closed surface low had developed<br />
near Minneapolis (Fig. 4b). The isallobaric couplet shifted<br />
sou<strong>the</strong>astward into most <strong>of</strong> Minnesota and <strong>the</strong> low had<br />
deepened 3.5 mb since 1800 UTC. The warm front and<br />
trailing surface trough had surged eastward and extended<br />
south-sou<strong>the</strong>ast <strong>of</strong> <strong>the</strong> low. The surface analysis and<br />
2115 UTC visible satellite image (Fig. 5b) showed a band<br />
<strong>of</strong> towering cumulus with WSR-88Ds detecting scattered<br />
showers (not shown) along <strong>the</strong> surface trough. Surface<br />
dewpoints were mainly in <strong>the</strong> 40s (°F) along and west<br />
<strong>of</strong> <strong>the</strong> warm front and surface trough over Minnesota.<br />
The minimal surface moisture (very low MLCAPE) and<br />
Fig. 5(b). 2115 UTC.<br />
Fig. 5(c). 0015 UTC.<br />
126 <strong>National</strong> Wea<strong>the</strong>r Digest