the wisconsin tornado outbreak of 23 june 2004 - National Weather ...
the wisconsin tornado outbreak of 23 june 2004 - National Weather ...
the wisconsin tornado outbreak of 23 june 2004 - National Weather ...

You also want an ePaper? Increase the reach of your titles
YUMPU automatically turns print PDFs into web optimized ePapers that Google loves.
Wisconsin Tornado Outbreak<br />
Over central Wisconsin, south winds had developed<br />
in response to <strong>the</strong> isallobaric couplet. Low-level moisture<br />
began to advect northward into central Wisconsin (Fig.<br />
7b) and dewpoints increased 3-7 (°F) between 1200 UTC<br />
and 1800 UTC (Fig. 4b). The surface-based CAPE at 2200<br />
UTC was from 500 to 1000 J kg -1 to <strong>the</strong> east-sou<strong>the</strong>ast <strong>of</strong><br />
<strong>the</strong> surface low (Fig. 8). But over sou<strong>the</strong>rn Wisconsin, less<br />
cloud cover and <strong>the</strong>refore strong insolation had resulted in<br />
surface-based CAPE from 1500 to 2000 J kg -1 . Convergence<br />
along a lake breeze front (Fig. 5b) and along a southwest-tonor<strong>the</strong>ast<br />
oriented surface trough (Fig. 4b) initiated surfacebased<br />
convection in far sou<strong>the</strong>astern Wisconsin around<br />
2100 UTC (Fig. 5b). New convection developed south along<br />
<strong>the</strong> surface trough through 2200 UTC. The thunderstorms<br />
did become severe in far sou<strong>the</strong>astern Wisconsin for a short<br />
time before moving eastward into Lower Michigan.<br />
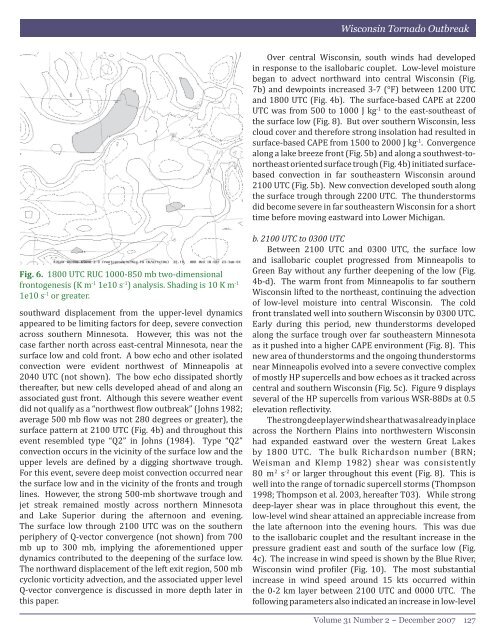
Fig. 6. 1800 UTC RUC 1000-850 mb two-dimensional<br />
frontogenesis (K m -1 1e10 s -1 ) analysis. Shading is 10 K m -1<br />
1e10 s -1 or greater.<br />
southward displacement from <strong>the</strong> upper-level dynamics<br />
appeared to be limiting factors for deep, severe convection<br />
across sou<strong>the</strong>rn Minnesota. However, this was not <strong>the</strong><br />
case far<strong>the</strong>r north across east-central Minnesota, near <strong>the</strong><br />
surface low and cold front. A bow echo and o<strong>the</strong>r isolated<br />
convection were evident northwest <strong>of</strong> Minneapolis at<br />
2040 UTC (not shown). The bow echo dissipated shortly<br />
<strong>the</strong>reafter, but new cells developed ahead <strong>of</strong> and along an<br />
associated gust front. Although this severe wea<strong>the</strong>r event<br />
did not qualify as a “northwest flow <strong>outbreak</strong>” (Johns 1982;<br />
average 500 mb flow was not 280 degrees or greater), <strong>the</strong><br />
surface pattern at 2100 UTC (Fig. 4b) and throughout this<br />
event resembled type “Q2” in Johns (1984). Type “Q2”<br />
convection occurs in <strong>the</strong> vicinity <strong>of</strong> <strong>the</strong> surface low and <strong>the</strong><br />
upper levels are defined by a digging shortwave trough.<br />
For this event, severe deep moist convection occurred near<br />
<strong>the</strong> surface low and in <strong>the</strong> vicinity <strong>of</strong> <strong>the</strong> fronts and trough<br />
lines. However, <strong>the</strong> strong 500-mb shortwave trough and<br />
jet streak remained mostly across nor<strong>the</strong>rn Minnesota<br />
and Lake Superior during <strong>the</strong> afternoon and evening.<br />
The surface low through 2100 UTC was on <strong>the</strong> sou<strong>the</strong>rn<br />
periphery <strong>of</strong> Q-vector convergence (not shown) from 700<br />
mb up to 300 mb, implying <strong>the</strong> aforementioned upper<br />
dynamics contributed to <strong>the</strong> deepening <strong>of</strong> <strong>the</strong> surface low.<br />
The northward displacement <strong>of</strong> <strong>the</strong> left exit region, 500 mb<br />
cyclonic vorticity advection, and <strong>the</strong> associated upper level<br />
Q-vector convergence is discussed in more depth later in<br />
this paper.<br />
b. 2100 UTC to 0300 UTC<br />
Between 2100 UTC and 0300 UTC, <strong>the</strong> surface low<br />
and isallobaric couplet progressed from Minneapolis to<br />
Green Bay without any fur<strong>the</strong>r deepening <strong>of</strong> <strong>the</strong> low (Fig.<br />
4b-d). The warm front from Minneapolis to far sou<strong>the</strong>rn<br />
Wisconsin lifted to <strong>the</strong> nor<strong>the</strong>ast, continuing <strong>the</strong> advection<br />
<strong>of</strong> low-level moisture into central Wisconsin. The cold<br />
front translated well into sou<strong>the</strong>rn Wisconsin by 0300 UTC.<br />
Early during this period, new thunderstorms developed<br />
along <strong>the</strong> surface trough over far sou<strong>the</strong>astern Minnesota<br />
as it pushed into a higher CAPE environment (Fig. 8). This<br />
new area <strong>of</strong> thunderstorms and <strong>the</strong> ongoing thunderstorms<br />
near Minneapolis evolved into a severe convective complex<br />
<strong>of</strong> mostly HP supercells and bow echoes as it tracked across<br />
central and sou<strong>the</strong>rn Wisconsin (Fig. 5c). Figure 9 displays<br />
several <strong>of</strong> <strong>the</strong> HP supercells from various WSR-88Ds at 0.5<br />
elevation reflectivity.<br />
The strong deep layer wind shear that was already in place<br />
across <strong>the</strong> Nor<strong>the</strong>rn Plains into northwestern Wisconsin<br />
had expanded eastward over <strong>the</strong> western Great Lakes<br />
by 1800 UTC. The bulk Richardson number (BRN;<br />
Weisman and Klemp 1982) shear was consistently<br />
80 m 2 s -2 or larger throughout this event (Fig. 8). This is<br />
well into <strong>the</strong> range <strong>of</strong> tornadic supercell storms (Thompson<br />
1998; Thompson et al. 2003, hereafter T03). While strong<br />
deep-layer shear was in place throughout this event, <strong>the</strong><br />
low-level wind shear attained an appreciable increase from<br />
<strong>the</strong> late afternoon into <strong>the</strong> evening hours. This was due<br />
to <strong>the</strong> isallobaric couplet and <strong>the</strong> resultant increase in <strong>the</strong><br />
pressure gradient east and south <strong>of</strong> <strong>the</strong> surface low (Fig.<br />
4c). The increase in wind speed is shown by <strong>the</strong> Blue River,<br />
Wisconsin wind pr<strong>of</strong>iler (Fig. 10). The most substantial<br />
increase in wind speed around 15 kts occurred within<br />
<strong>the</strong> 0-2 km layer between 2100 UTC and 0000 UTC. The<br />
following parameters also indicated an increase in low-level<br />
Volume 31 Number 2 ~ December 2007 127